| Param | Original file | Final file |
|---|---|---|
| Filename | modeM0/AS1A09_147T01_9000003754_25788cztM0_level2.evt | modeM0/AS1A09_147T01_9000003754_25788cztM0_level2_quad_clean.evt |
| Size (bytes) | 2,417,241,600 | 412,968,960 |
| Size | 2.3 GB | 393.8 MB |
| Events in quadrant A | 17,035,474 | 2,623,387 |
| Events in quadrant B | 15,084,025 | 2,686,960 |
| Events in quadrant C | 15,129,436 | 2,568,012 |
| Events in quadrant D | 23,859,816 | 2,491,440 |
| Mode M9 | |||
|---|---|---|---|
| Quadrant | BADHDUFLAG | Total packets | Discarded packets |
| A | 0 | 25 | 0 |
| B | 0 | 25 | 0 |
| C | 0 | 25 | 0 |
| D | 0 | 25 | 0 |
| Mode M0 | |||
|---|---|---|---|
| Quadrant | BADHDUFLAG | Total packets | Discarded packets |
| A | 0 | 70645 | 0 |
| B | 0 | 64380 | 0 |
| C | 0 | 64249 | 0 |
| D | 0 | 91730 | 0 |
| Quadrant | Total seconds | Saturated seconds | Saturation percentage |
|---|---|---|---|
| A | 31095 | 1057 | 3.399260% |
| B | 31096 | 709 | 2.280036% |
| C | 31096 | 847 | 2.723823% |
| D | 31095 | 1756 | 5.647210% |
Noise dominated data is calculated using 1-second bins in cleaned event files. If a bin has >2000 counts, and if more than 50% of those come from <1% of pixels, then it is considered to be noise-dominated and hence unusable.
| Quadrant | # 1 sec bins | Bins with >0 counts | Bins with >2000 counts | High rate bins dominated by noise | Noise dominated (total time) | Noise dominated (detector-on time) | Marked lightcurve |
|---|---|---|---|---|---|---|---|
| A | 33655 | 31098 | 385 | 385 | 1.14% | 1.24% | 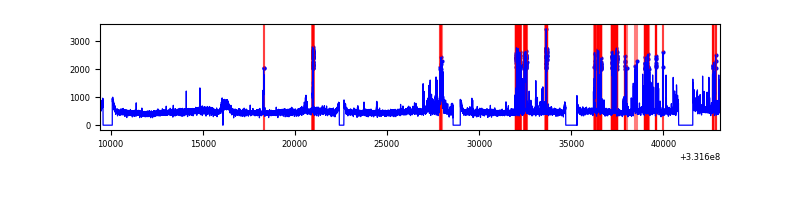 |
| B | 33656 | 31099 | 16 | 16 | 0.05% | 0.05% | 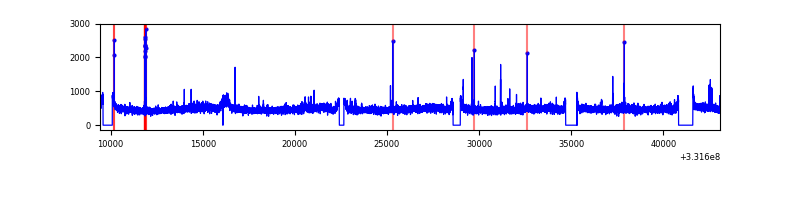 |
| C | 33656 | 31097 | 0 | 0 | 0.00% | 0.00% | 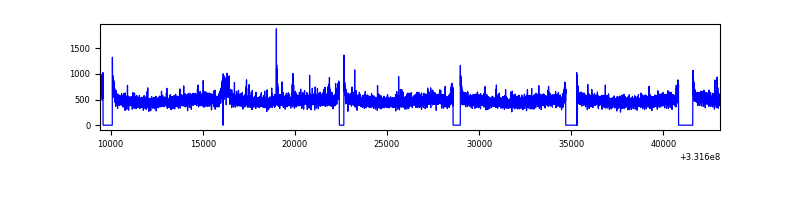 |
| D | 33655 | 31099 | 1115 | 1115 | 3.31% | 3.59% | 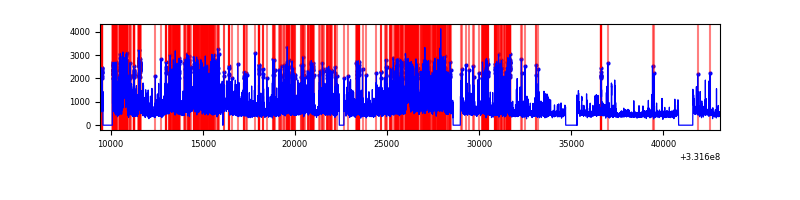 |
Top three noisy pixels from each quadrant. If the there are fewer than three noisy pixels in the level2.evt file, extra rows are filled as -1
| Pixel properties | Quadrant properties | ||||||
|---|---|---|---|---|---|---|---|
| Quadrant | DetID | PixID | Counts | Sigma | Mean | Median | Sigma |
| A | 0 | 13 | 2387568 | 3142.73 | 3791 | 3701 | 758.5 |
| A | 13 | 254 | 43329 | 52.24 | 3791 | 3701 | 758.5 |
| A | 3 | 137 | 36393 | 43.1 | 3791 | 3701 | 758.5 |
| B | 0 | 190 | 103479 | 139.25 | 3772 | 3672 | 716.8 |
| B | 12 | 111 | 89914 | 120.32 | 3772 | 3672 | 716.8 |
| B | 11 | 111 | 81311 | 108.32 | 3772 | 3672 | 716.8 |
| C | 14 | 238 | 579962 | 673.24 | 3671 | 3693 | 856.0 |
| C | 3 | 233 | 235331 | 270.62 | 3671 | 3693 | 856.0 |
| C | 13 | 61 | 25171 | 25.09 | 3671 | 3693 | 856.0 |
| D | 1 | 52 | 6143559 | 7073.0 | 3659 | 3562 | 868.1 |
| D | 7 | 80 | 2967242 | 3414.03 | 3659 | 3562 | 868.1 |
| D | 13 | 104 | 439918 | 502.66 | 3659 | 3562 | 868.1 |
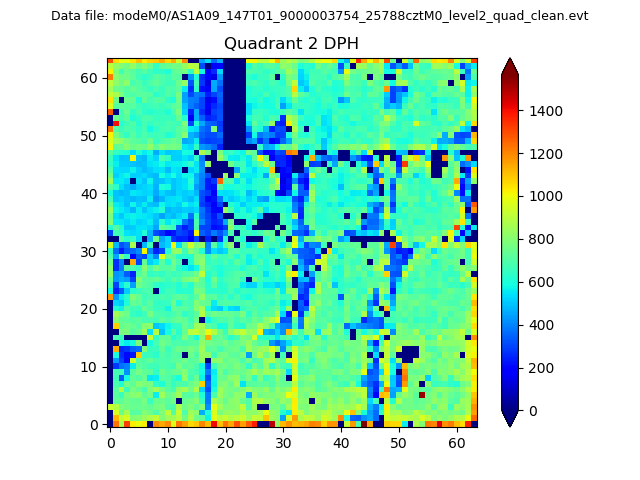
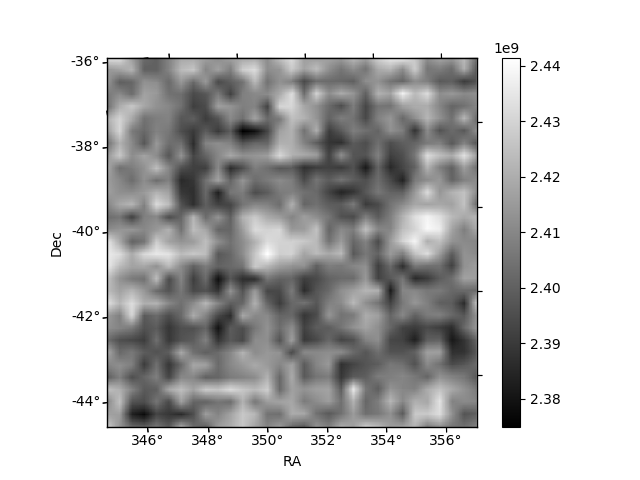
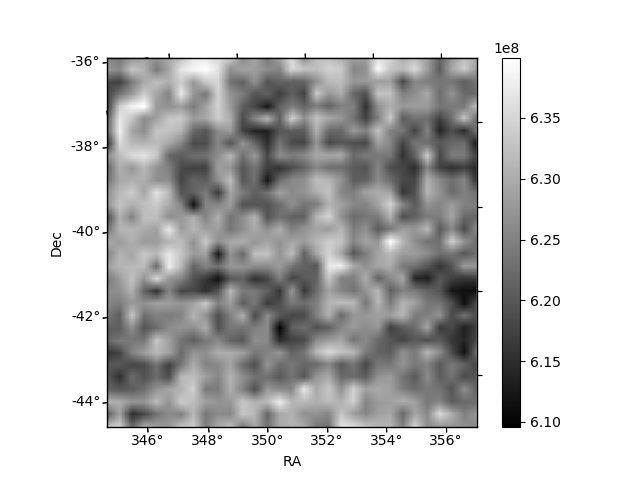
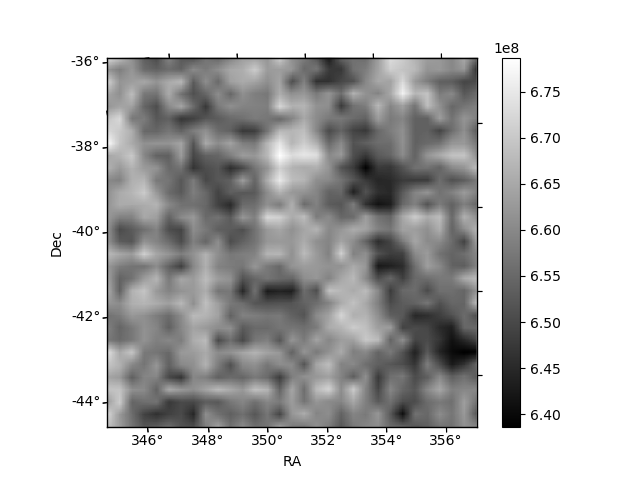
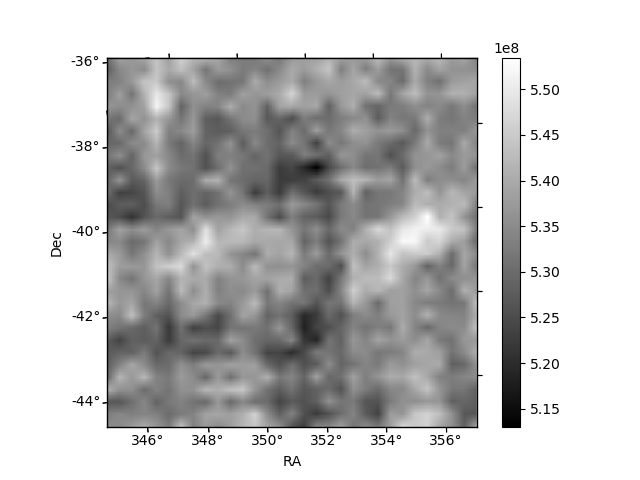
Histogram calculated using DETX and DETY for each event in the final _common_clean file
| Quadrant A | 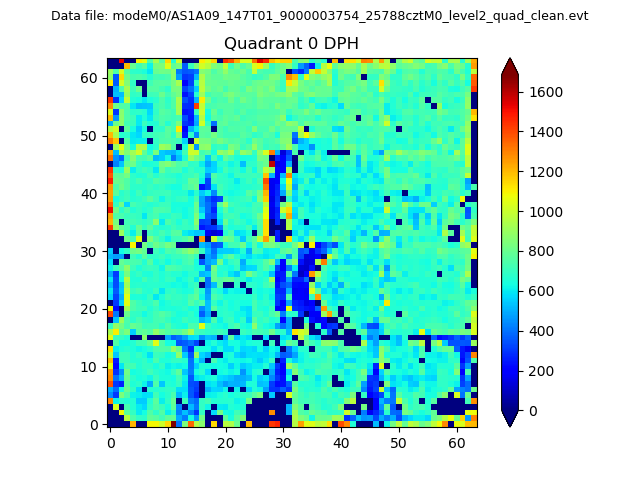 |
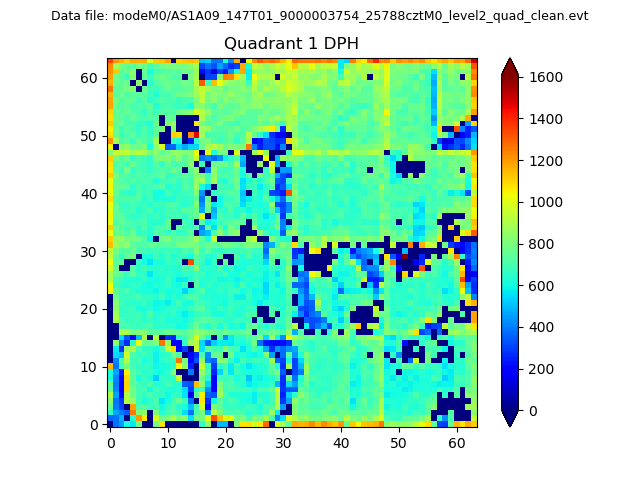 |
Quadrant B |
|---|---|---|---|
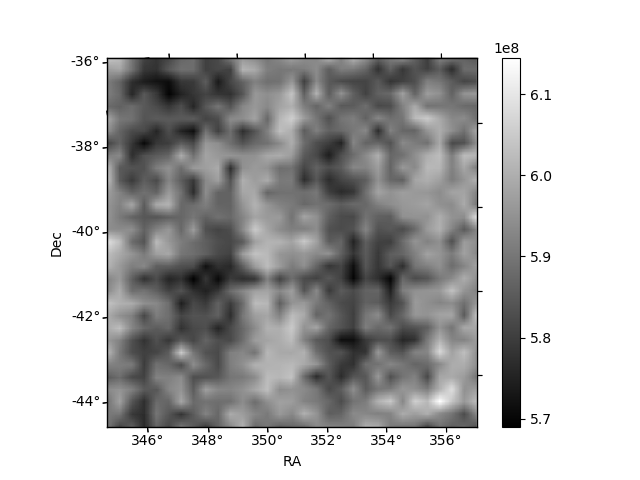
| Quadrant D | 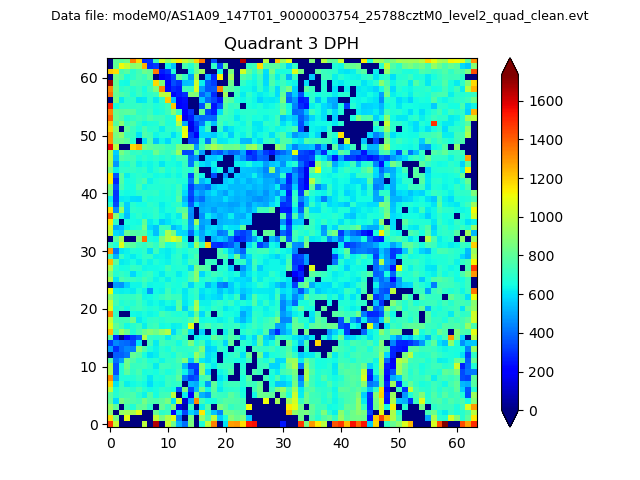 |
 |
Quadrant C |
| Plot type | Count rate plots | Images |
|---|---|---|
| Comparison with Poisson distribution Blue bars denote a histogram of data divided into 1 sec bins. Red curve is a Poisson curve with rate = median count rate of data. |
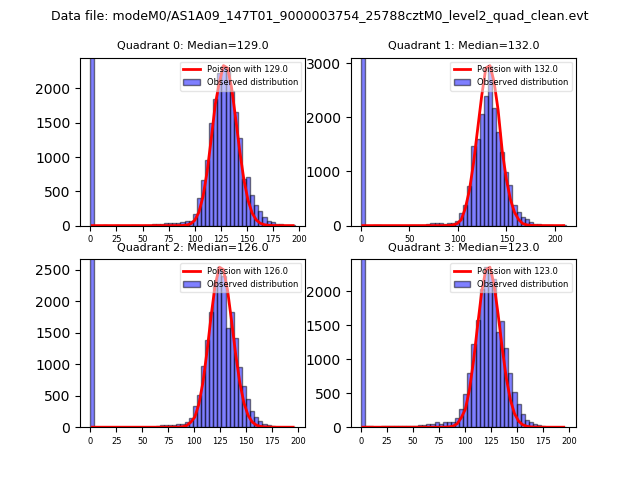 |
 |
| Quadrant-wise count rates Data is divided into 100 sec bins |
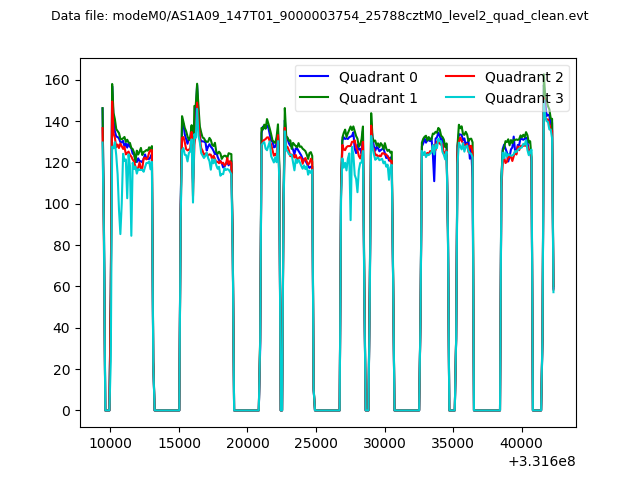 |
|
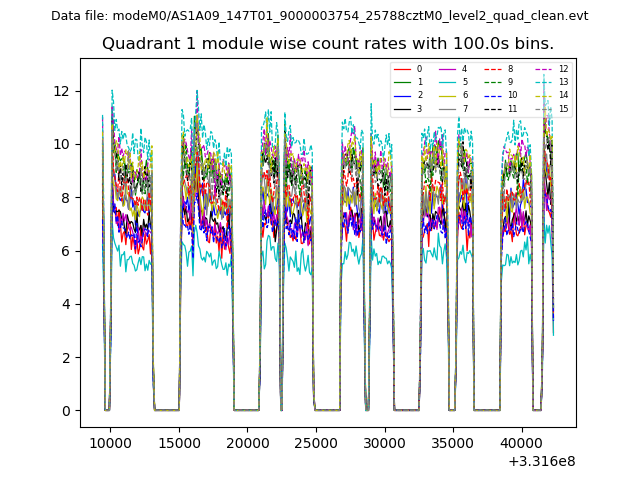
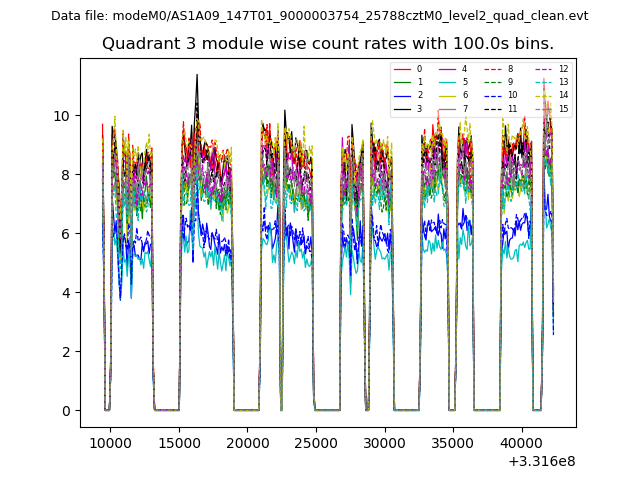
| Module-wise count rates for Quadrant A Data is divided into 100 sec bins |
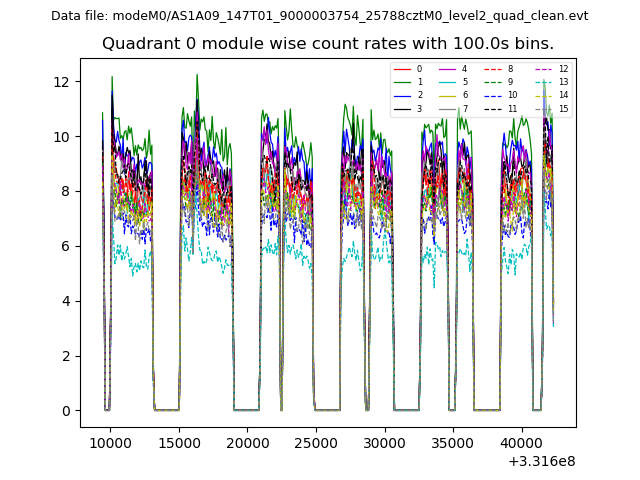 |
 |
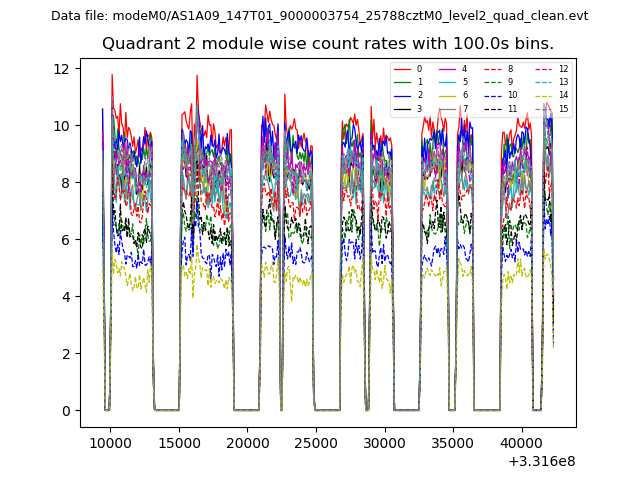
| Module-wise count rates for Quadrant B Data is divided into 100 sec bins |
 |
 |
| Module-wise count rates for Quadrant C Data is divided into 100 sec bins |
 |
 |
| Module-wise count rates for Quadrant D Data is divided into 100 sec bins |
 |
 |
| Parameter | Plot |
|---|---|
| CZT HV Monitor | 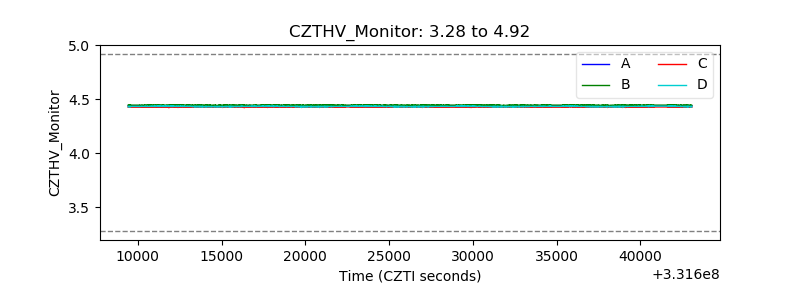 |
| D_VDD | 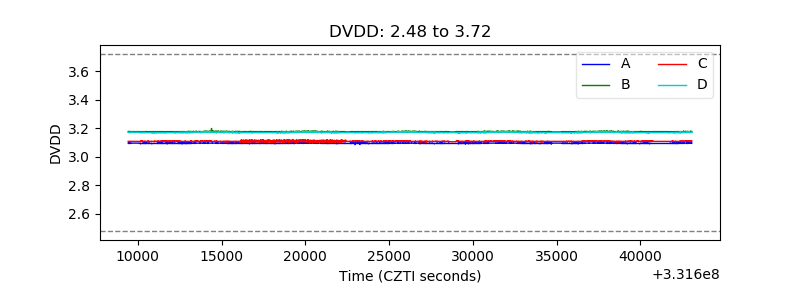 |
| Temperature 1 | 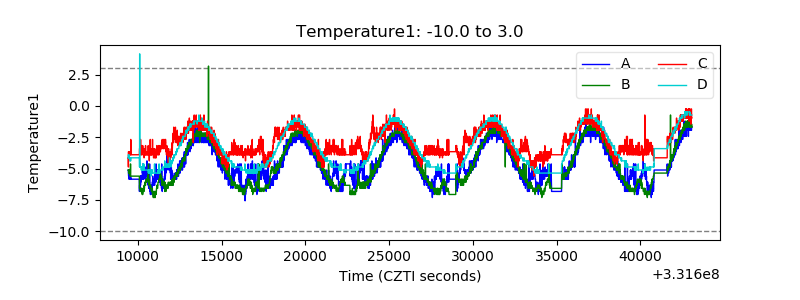 |
| Veto HV Monitor | 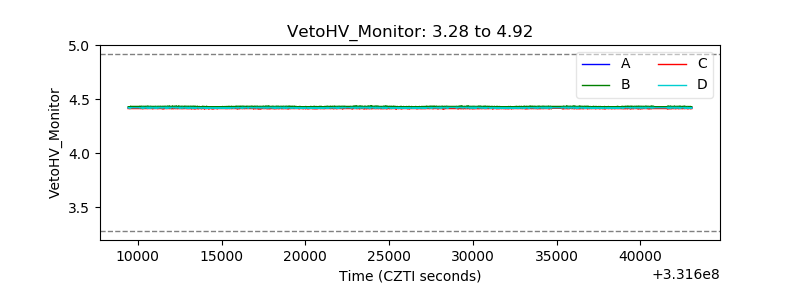 |
| Veto LLD | 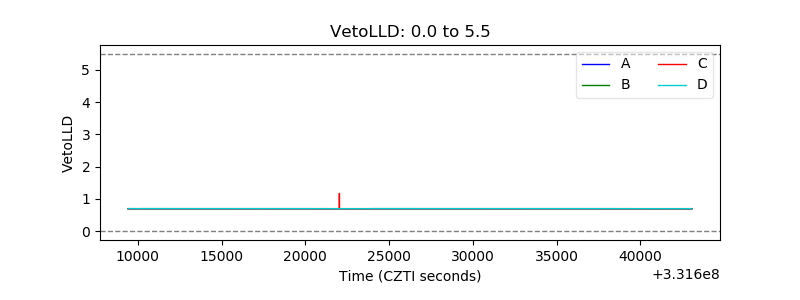 |
| Alpha Counter | 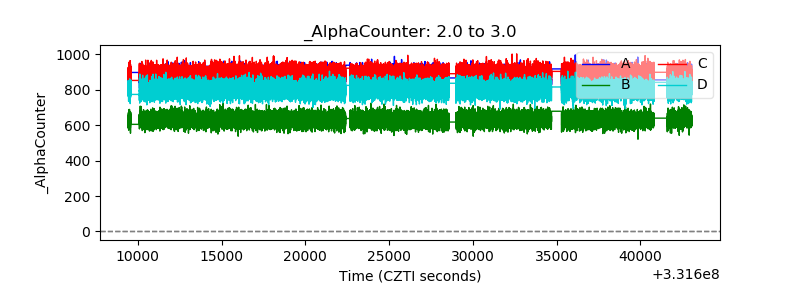 |
| _CPM_Rate | 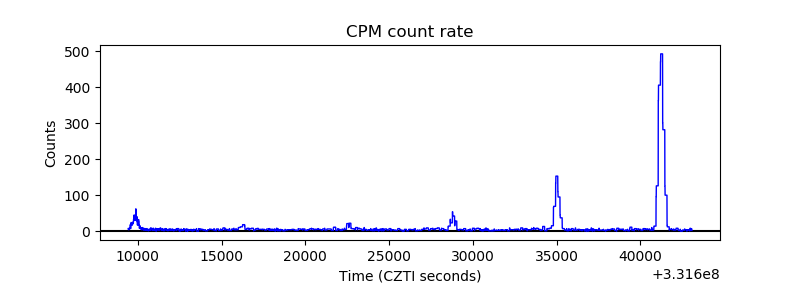 |
| CZT Counter | 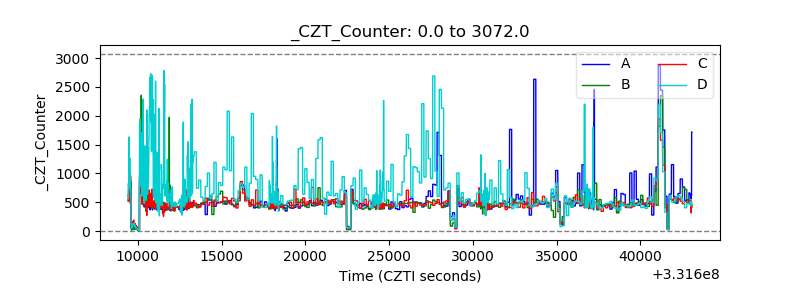 |
| +2.5 Volts monitor |  |
| +5 Volts monitor | 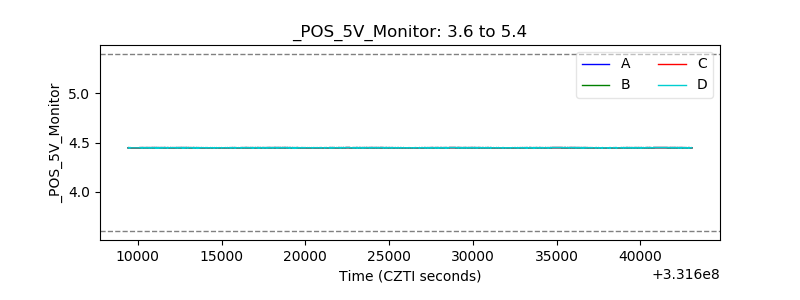 |
| _ROLL_ROT | 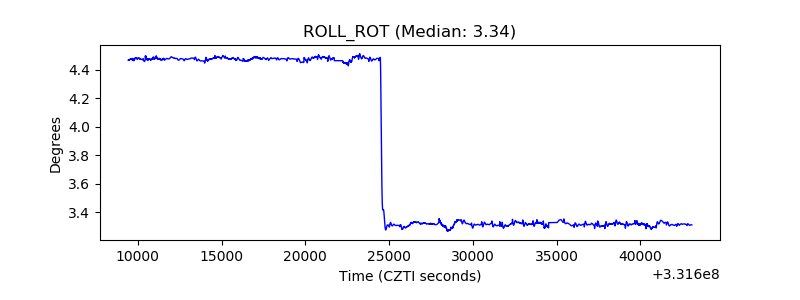 |
| _Roll_DEC | 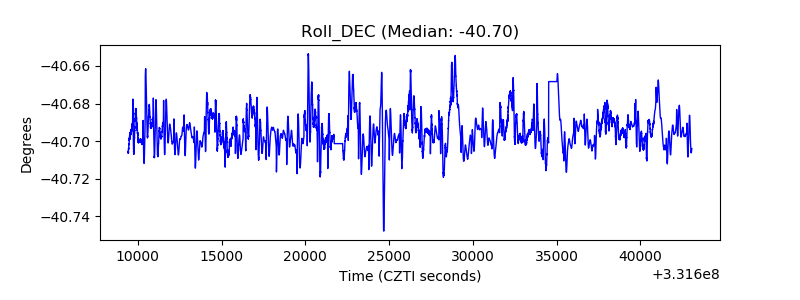 |
| _Roll_RA | 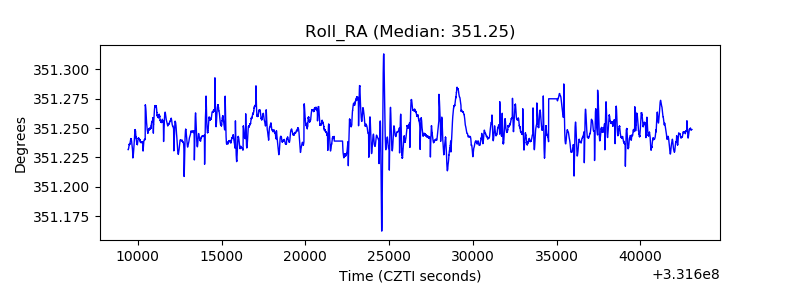 |
| Veto Counter | 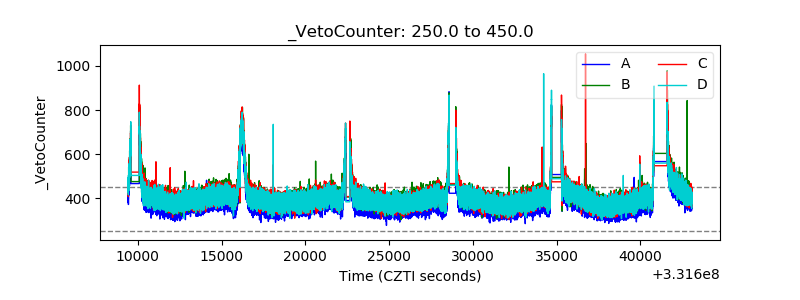 |