| Param | Original file | Final file |
|---|---|---|
| Filename | modeM0/AS1A09_147T01_9000003754_25789cztM0_level2.evt | modeM0/AS1A09_147T01_9000003754_25789cztM0_level2_quad_clean.evt |
| Size (bytes) | 283,593,600 | 41,567,040 |
| Size | 270.5 MB | 39.6 MB |
| Events in quadrant A | 2,738,297 | 242,496 |
| Events in quadrant B | 1,887,079 | 253,885 |
| Events in quadrant C | 1,826,599 | 241,679 |
| Events in quadrant D | 1,868,231 | 242,684 |
| Mode M0 | |||
|---|---|---|---|
| Quadrant | BADHDUFLAG | Total packets | Discarded packets |
| A | 0 | 10453 | 0 |
| B | 0 | 8074 | 0 |
| C | 0 | 7937 | 0 |
| D | 0 | 8167 | 0 |
| Quadrant | Total seconds | Saturated seconds | Saturation percentage |
|---|---|---|---|
| A | 3932 | 277 | 7.044761% |
| B | 3932 | 4 | 0.101729% |
| C | 3932 | 15 | 0.381485% |
| D | 3932 | 12 | 0.305188% |
Noise dominated data is calculated using 1-second bins in cleaned event files. If a bin has >2000 counts, and if more than 50% of those come from <1% of pixels, then it is considered to be noise-dominated and hence unusable.
| Quadrant | # 1 sec bins | Bins with >0 counts | Bins with >2000 counts | High rate bins dominated by noise | Noise dominated (total time) | Noise dominated (detector-on time) | Marked lightcurve |
|---|---|---|---|---|---|---|---|
| A | 3932 | 3932 | 259 | 259 | 6.59% | 6.59% | 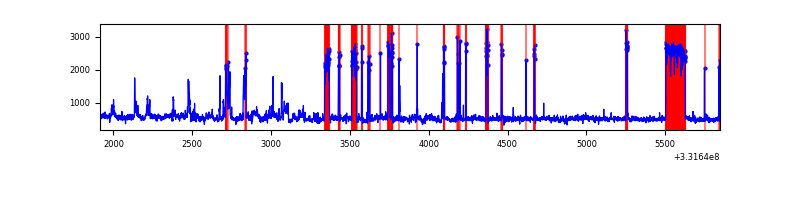 |
| B | 3932 | 3932 | 0 | 0 | 0.00% | 0.00% | 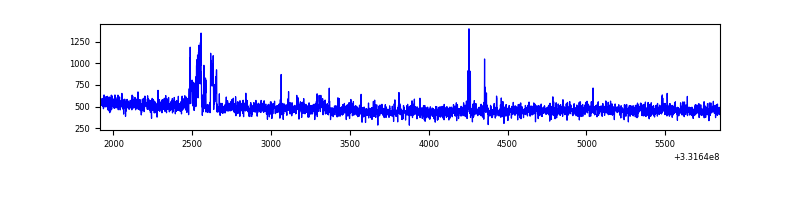 |
| C | 3932 | 3932 | 0 | 0 | 0.00% | 0.00% | 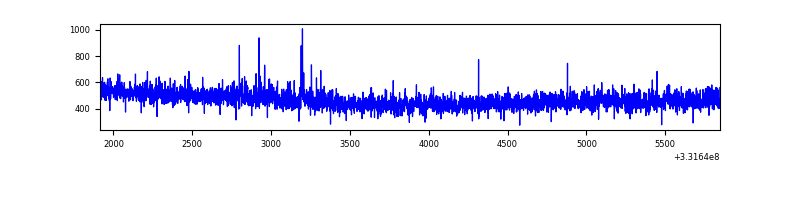 |
| D | 3932 | 3932 | 6 | 6 | 0.15% | 0.15% | 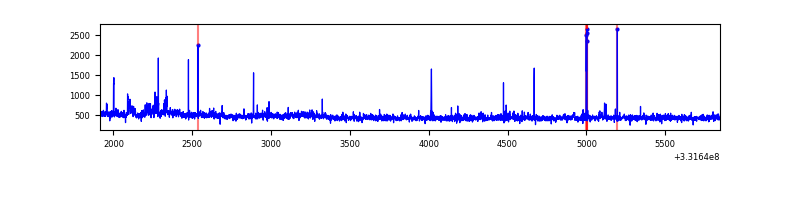 |
Top three noisy pixels from each quadrant. If the there are fewer than three noisy pixels in the level2.evt file, extra rows are filled as -1
| Pixel properties | Quadrant properties | ||||||
|---|---|---|---|---|---|---|---|
| Quadrant | DetID | PixID | Counts | Sigma | Mean | Median | Sigma |
| A | 0 | 13 | 977159 | 10562.71 | 455 | 445 | 92.5 |
| A | 13 | 254 | 6170 | 61.91 | 455 | 445 | 92.5 |
| A | 3 | 137 | 4137 | 39.93 | 455 | 445 | 92.5 |
| B | 0 | 190 | 39867 | 441.19 | 462 | 451 | 89.3 |
| B | 0 | 219 | 19342 | 211.45 | 462 | 451 | 89.3 |
| B | 12 | 111 | 10750 | 115.28 | 462 | 451 | 89.3 |
| C | 14 | 238 | 72746 | 685.79 | 444 | 445 | 105.4 |
| C | 3 | 233 | 20891 | 193.94 | 444 | 445 | 105.4 |
| C | 13 | 61 | 3053 | 24.74 | 444 | 445 | 105.4 |
| D | 1 | 52 | 60715 | 546.4 | 451 | 440 | 110.3 |
| D | 8 | 195 | 47029 | 422.33 | 451 | 440 | 110.3 |
| D | 7 | 80 | 24884 | 221.59 | 451 | 440 | 110.3 |
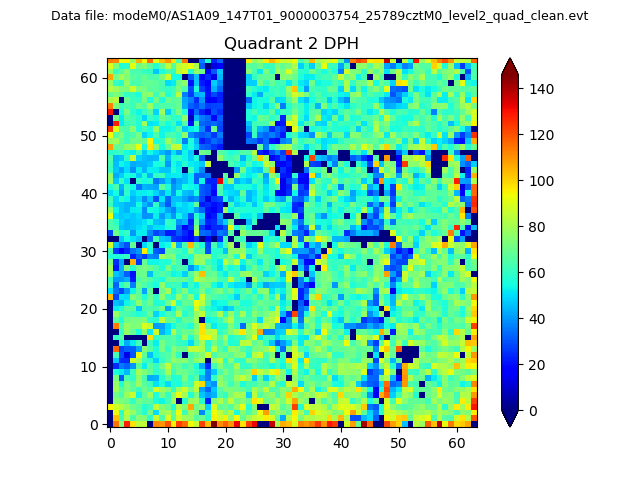
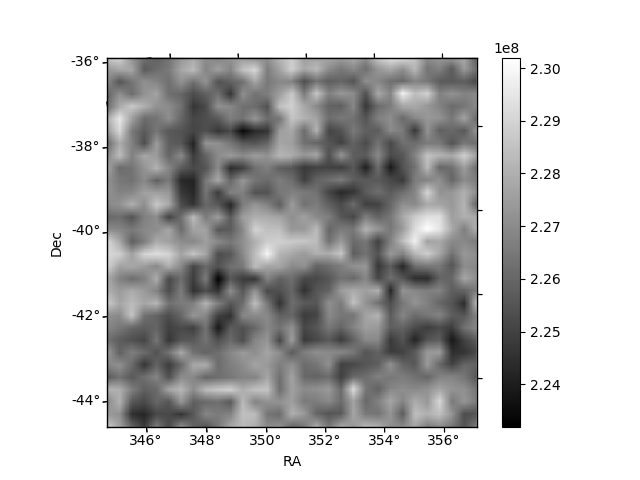
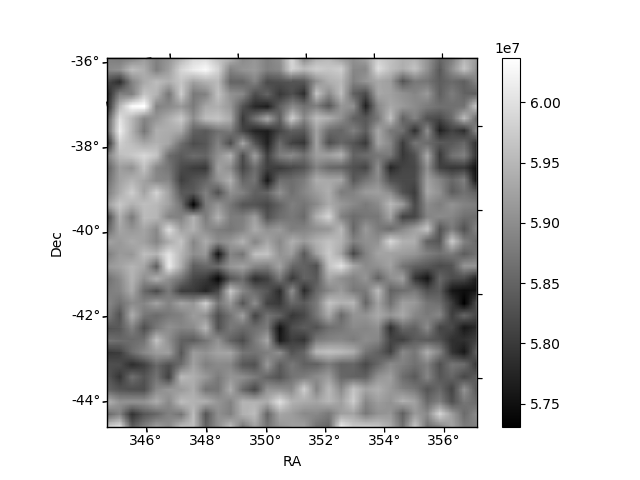
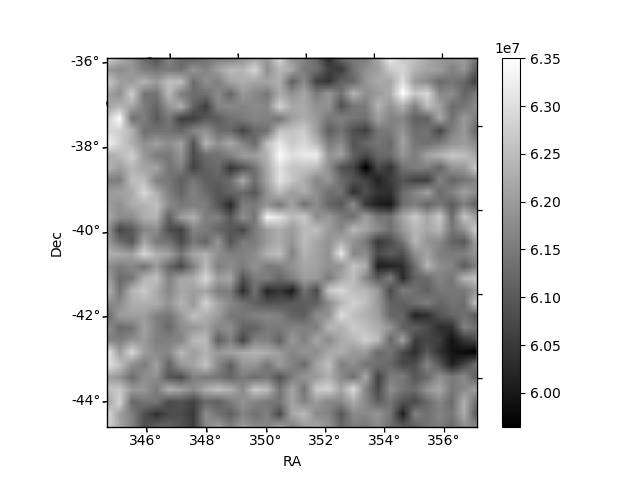
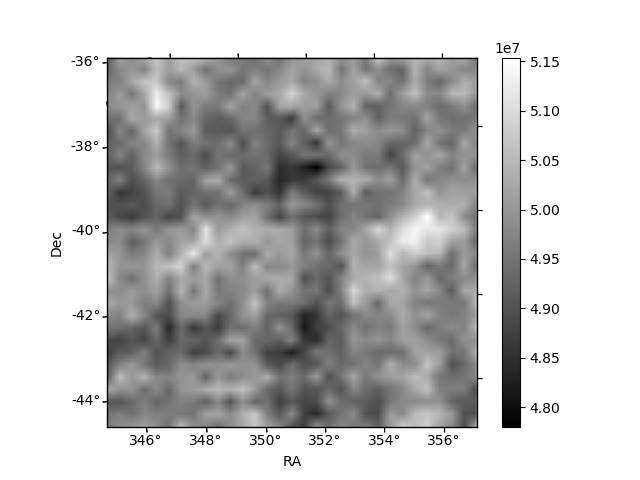
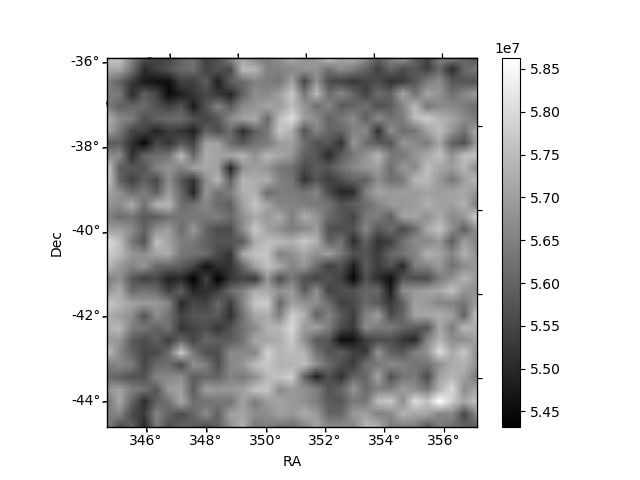
Histogram calculated using DETX and DETY for each event in the final _common_clean file
| Quadrant A | 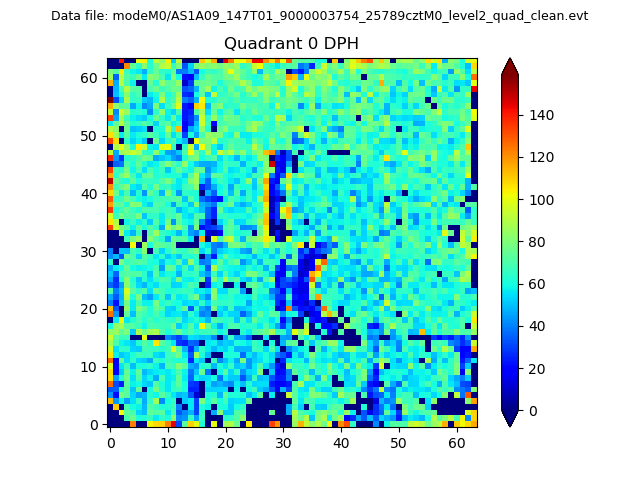 |
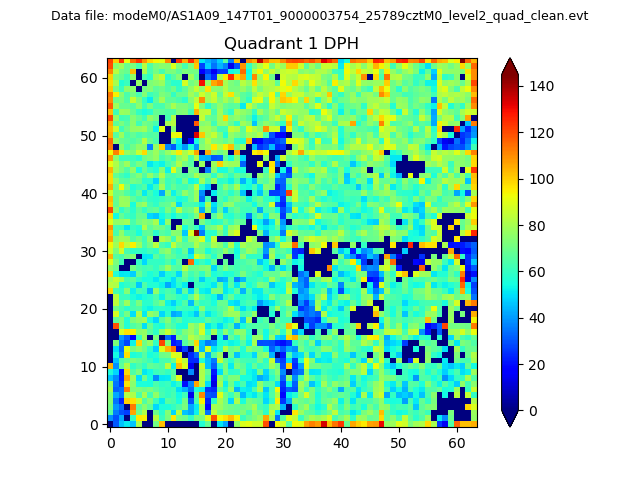 |
Quadrant B |
|---|---|---|---|
| Quadrant D | 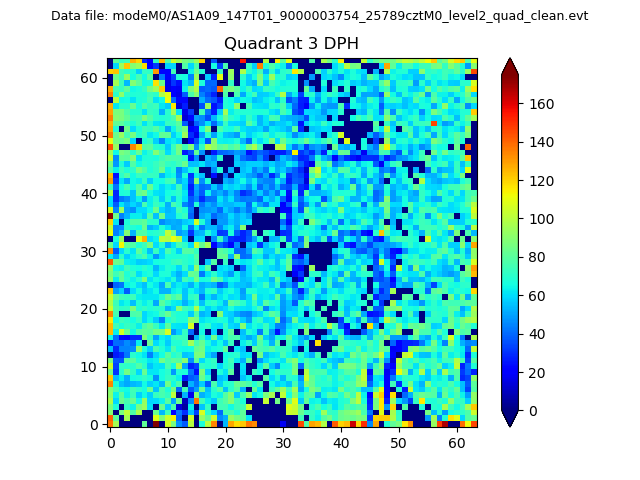 |
 |
Quadrant C |
| Plot type | Count rate plots | Images |
|---|---|---|
| Comparison with Poisson distribution Blue bars denote a histogram of data divided into 1 sec bins. Red curve is a Poisson curve with rate = median count rate of data. |
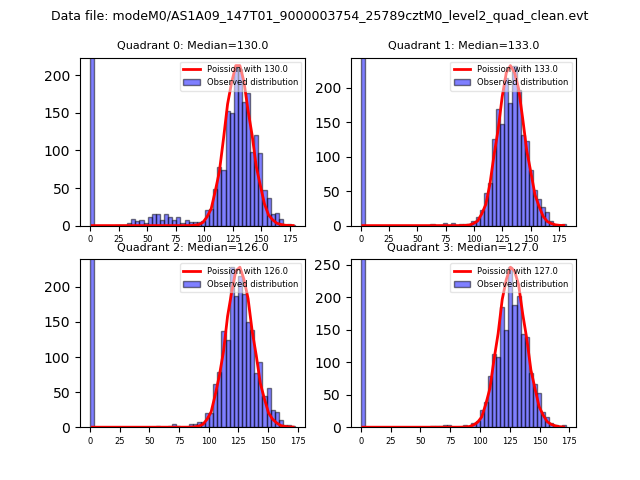 |
 |
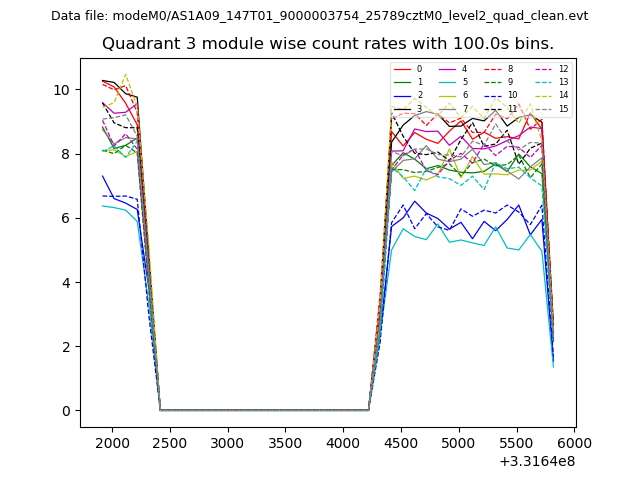
| Quadrant-wise count rates Data is divided into 100 sec bins |
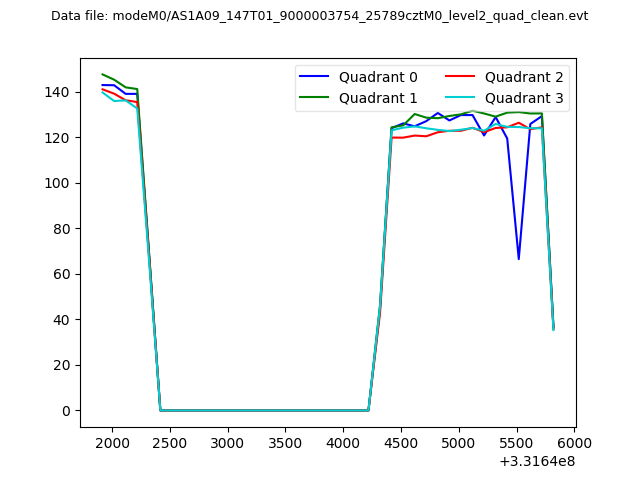 |
|
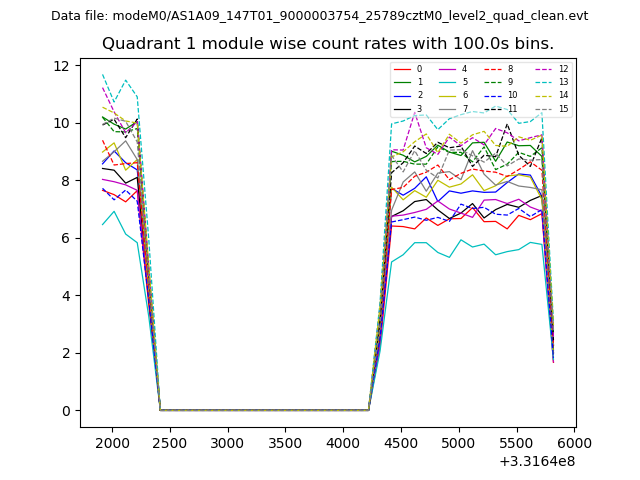
| Module-wise count rates for Quadrant A Data is divided into 100 sec bins |
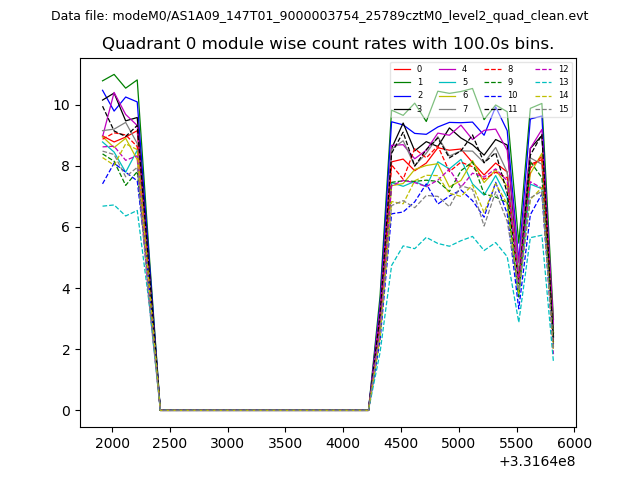 |
 |
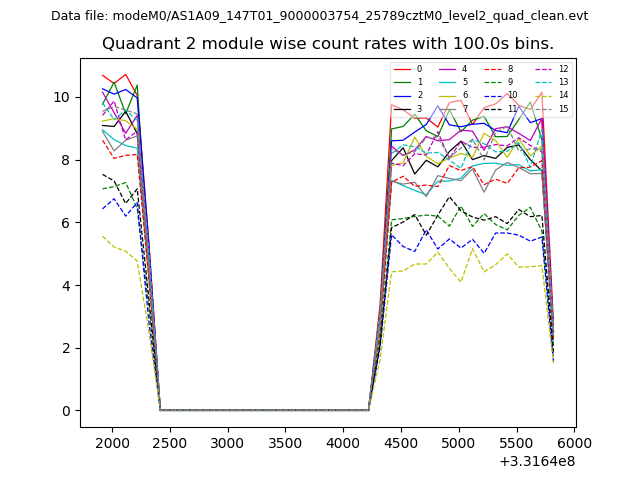
| Module-wise count rates for Quadrant B Data is divided into 100 sec bins |
 |
 |
| Module-wise count rates for Quadrant C Data is divided into 100 sec bins |
 |
 |
| Module-wise count rates for Quadrant D Data is divided into 100 sec bins |
 |
 |
| Parameter | Plot |
|---|---|
| CZT HV Monitor | 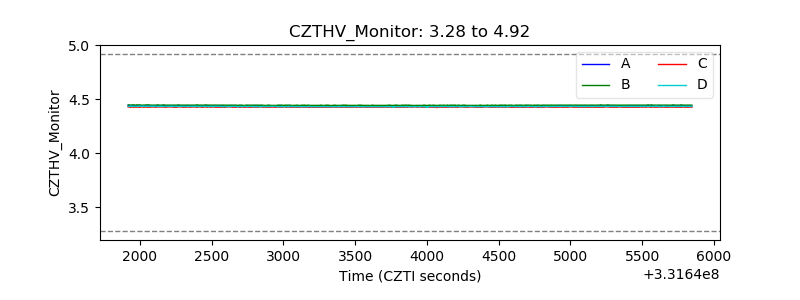 |
| D_VDD | 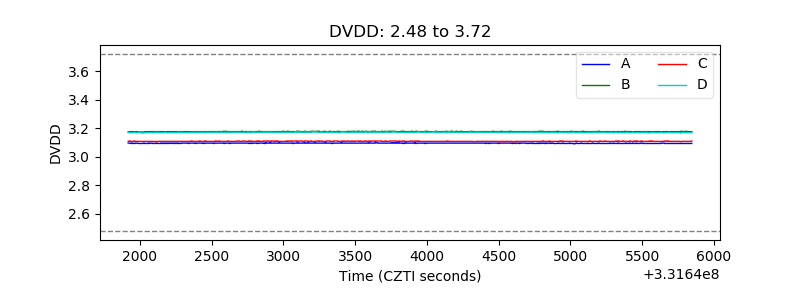 |
| Temperature 1 | 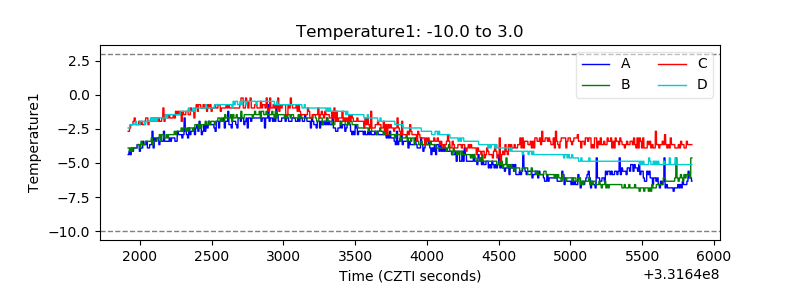 |
| Veto HV Monitor | 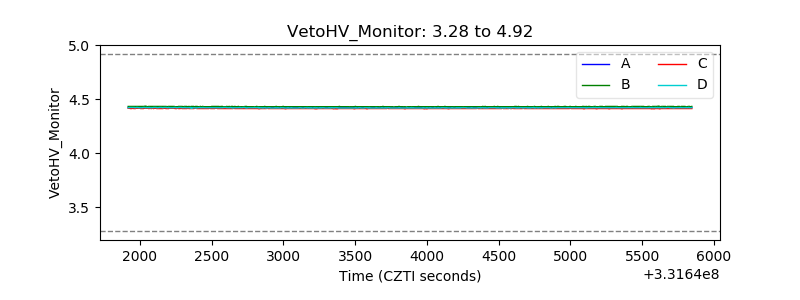 |
| Veto LLD | 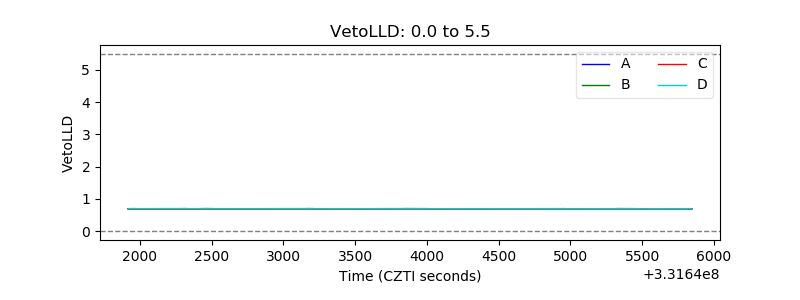 |
| Alpha Counter | 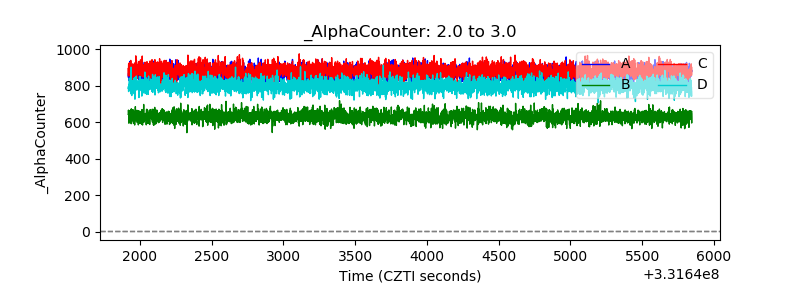 |
| _CPM_Rate | 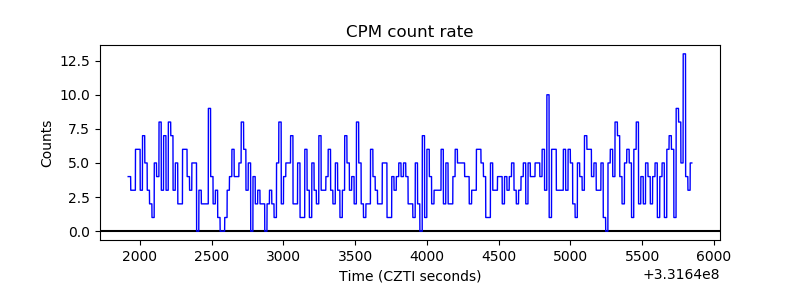 |
| CZT Counter | 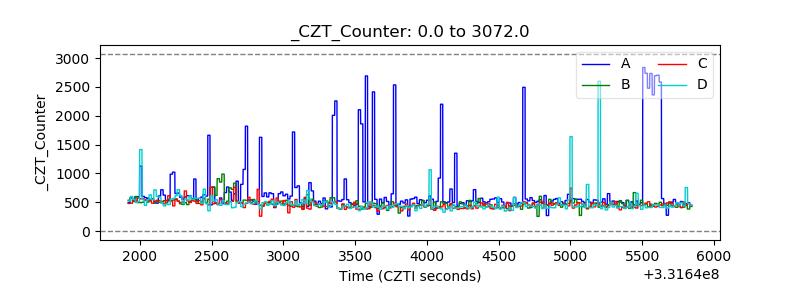 |
| +2.5 Volts monitor |  |
| +5 Volts monitor | 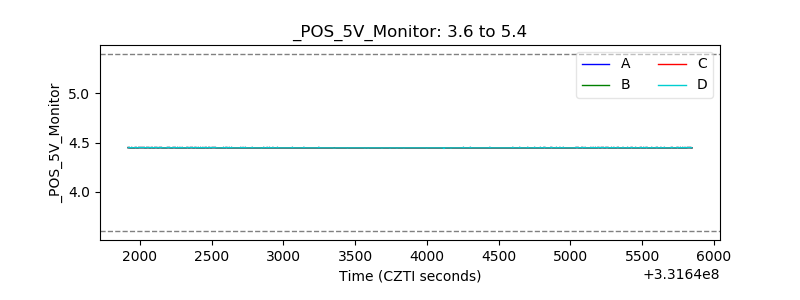 |
| _ROLL_ROT | 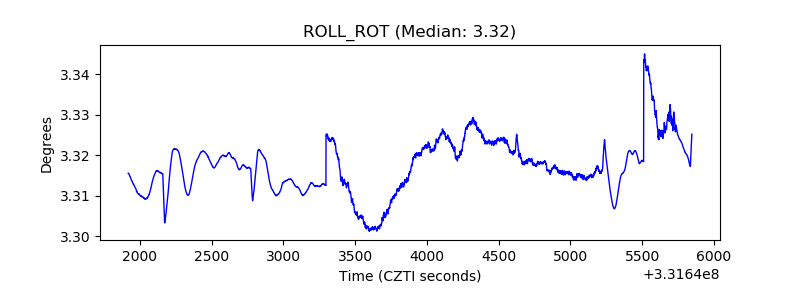 |
| _Roll_DEC | 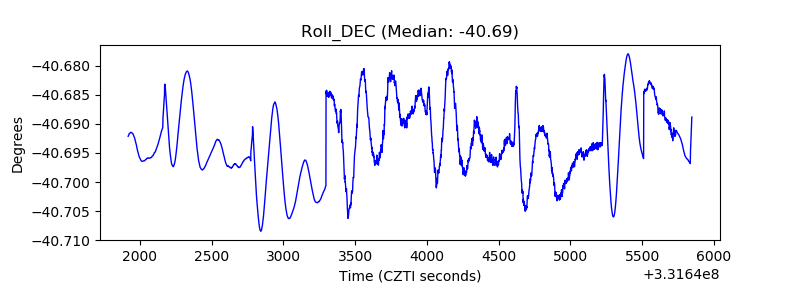 |
| _Roll_RA | 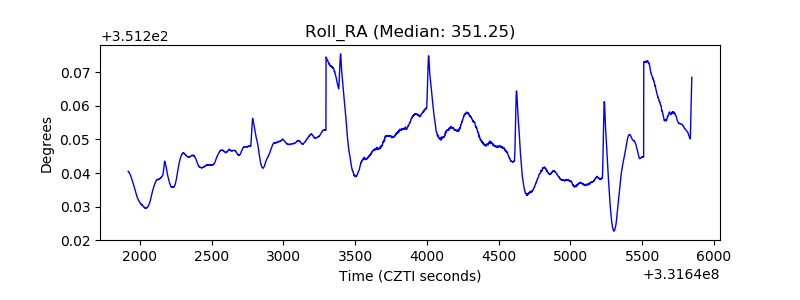 |
| Veto Counter | 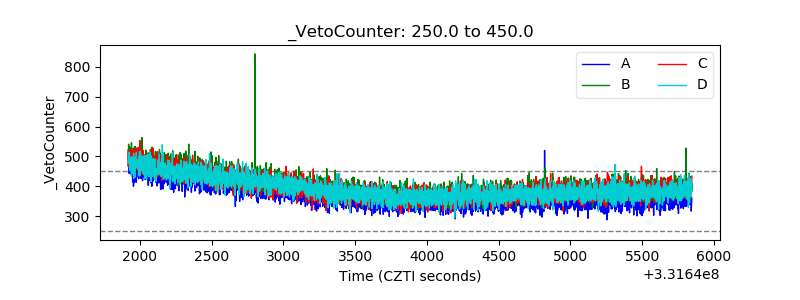 |