| Param | Original file | Final file |
|---|---|---|
| Filename | modeM0/AS1A07_068T01_9000003756cztM0_level2.fits | modeM0/AS1A07_068T01_9000003756cztM0_level2_quad_clean.evt |
| Size (bytes) | 6,040,742,400 | 5,002,657,920 |
| Size | 5.6 GB | 4.7 GB |
| Events in quadrant A | 37,100,432 | 28,293,780 |
| Events in quadrant B | 36,396,760 | 29,379,112 |
| Events in quadrant C | 35,799,162 | 26,714,340 |
| Events in quadrant D | 31,546,068 | 25,044,788 |
| Mode M0 | |||
|---|---|---|---|
| Quadrant | BADHDUFLAG | Total packets | Discarded packets |
| A | 0 | 1659357 | 0 |
| B | 0 | 1316961 | 0 |
| C | 0 | 1463748 | 0 |
| D | 0 | 1662828 | 0 |
| Mode SS | |||
|---|---|---|---|
| Quadrant | BADHDUFLAG | Total packets | Discarded packets |
| A | 0 | 12502 | 0 |
| B | 0 | 12502 | 0 |
| C | 0 | 12502 | 0 |
| D | 0 | 12504 | 0 |
| Mode M9 | |||
|---|---|---|---|
| Quadrant | BADHDUFLAG | Total packets | Discarded packets |
| A | 0 | 1044 | 0 |
| B | 0 | 1044 | 0 |
| C | 0 | 1044 | 0 |
| D | 0 | 1044 | 0 |
| Quadrant | Total seconds | Saturated seconds | Saturation percentage |
|---|---|---|---|
| A | 614400 | 41245 | 6.713053% |
| B | 614416 | 8918 | 1.451460% |
| C | 614410 | 29683 | 4.831139% |
| D | 614410 | 31822 | 5.179278% |
Noise dominated data is calculated using 1-second bins in cleaned event files. If a bin has >2000 counts, and if more than 50% of those come from <1% of pixels, then it is considered to be noise-dominated and hence unusable.
| Quadrant | # 1 sec bins | Bins with >0 counts | Bins with >2000 counts | High rate bins dominated by noise | Noise dominated (total time) | Noise dominated (detector-on time) | Marked lightcurve |
|---|---|---|---|---|---|---|---|
| A | 737957 | 614277 | 0 | 0 | 0.00% | 0.00% |  |
| B | 737957 | 614318 | 0 | 0 | 0.00% | 0.00% |  |
| C | 737957 | 614230 | 0 | 0 | 0.00% | 0.00% |  |
| D | 737957 | 613746 | 0 | 0 | 0.00% | 0.00% |  |
Top three noisy pixels from each quadrant. If the there are fewer than three noisy pixels in the level2.evt file, extra rows are filled as -1
| Pixel properties | Quadrant properties | ||||||
|---|---|---|---|---|---|---|---|
| Quadrant | DetID | PixID | Counts | Sigma | Mean | Median | Sigma |
| A | 0 | 29 | 31108 | 9.4 | 9678 | 9107 | 2341.7 |
| A | 7 | 110 | 29373 | 8.65 | 9678 | 9107 | 2341.7 |
| A | 9 | 19 | 27616 | 7.9 | 9678 | 9107 | 2341.7 |
| B | 2 | 9 | 29198 | 10.79 | 9622 | 9206 | 1853.5 |
| B | 2 | 8 | 24274 | 8.13 | 9622 | 9206 | 1853.5 |
| B | 5 | 128 | 23723 | 7.83 | 9622 | 9206 | 1853.5 |
| C | 12 | 241 | 24822 | 6.7 | 9469 | 8835 | 2387.0 |
| C | 9 | 209 | 24273 | 6.47 | 9469 | 8835 | 2387.0 |
| C | 3 | 126 | 23993 | 6.35 | 9469 | 8835 | 2387.0 |
| D | 6 | 231 | 22168 | 5.89 | 9019 | 8212 | 2370.4 |
| D | 7 | 3 | 22166 | 5.89 | 9019 | 8212 | 2370.4 |
| D | 6 | 67 | 22044 | 5.84 | 9019 | 8212 | 2370.4 |
Histogram calculated using DETX and DETY for each event in the final _common_clean file
| Quadrant A |  |
 |
Quadrant B |
|---|---|---|---|
| Quadrant D | 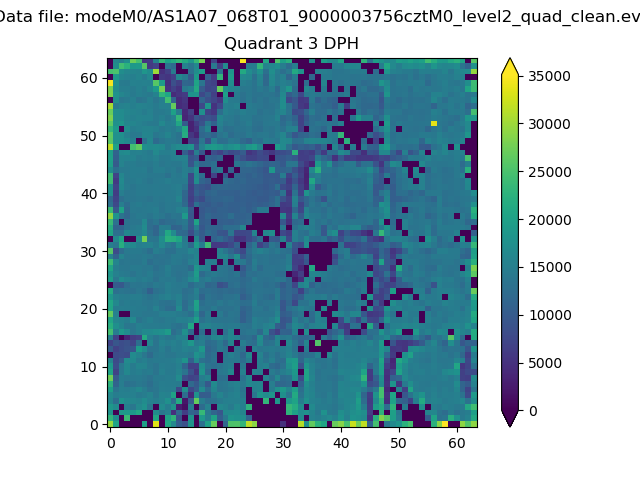 |
 |
Quadrant C |
| Plot type | Count rate plots | Images |
|---|---|---|
| Comparison with Poisson distribution Blue bars denote a histogram of data divided into 1 sec bins. Red curve is a Poisson curve with rate = median count rate of data. |
 |
 |
| Quadrant-wise count rates Data is divided into 100 sec bins |
 |
|
| Module-wise count rates for Quadrant A Data is divided into 100 sec bins |
 |
 |
| Module-wise count rates for Quadrant B Data is divided into 100 sec bins |
 |
 |
| Module-wise count rates for Quadrant C Data is divided into 100 sec bins |
 |
 |
| Module-wise count rates for Quadrant D Data is divided into 100 sec bins |
 |
 |
| Parameter | Plot |
|---|---|
| CZT HV Monitor | 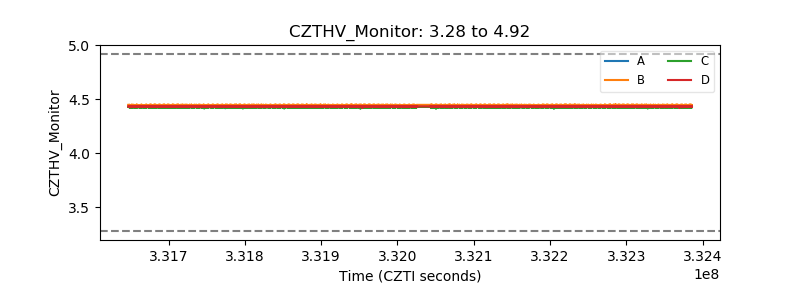 |
| D_VDD |  |
| Temperature 1 |  |
| Veto HV Monitor | 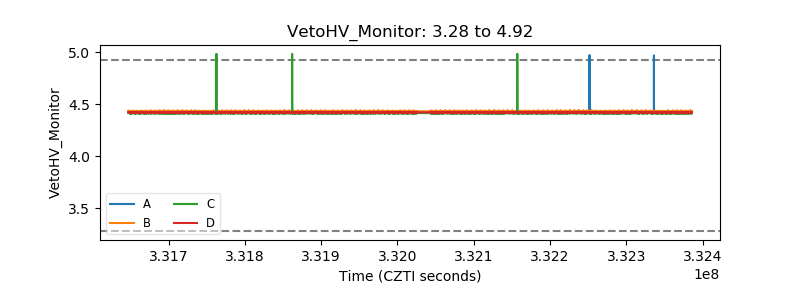 |
| Veto LLD |  |
| Alpha Counter |  |
| _CPM_Rate | 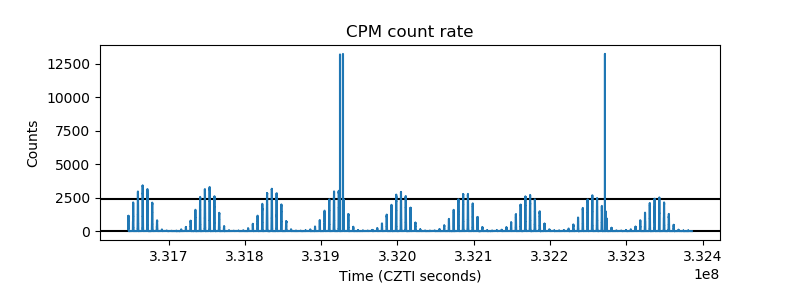 |
| CZT Counter |  |
| +2.5 Volts monitor |  |
| +5 Volts monitor |  |
| _ROLL_ROT |  |
| _Roll_DEC |  |
| _Roll_RA |  |
| Veto Counter |  |