| Param | Original file | Final file |
|---|---|---|
| Filename | modeM0/AS1A07_068T01_9000003756_25789cztM0_level2.evt | modeM0/AS1A07_068T01_9000003756_25789cztM0_level2_quad_clean.evt |
| Size (bytes) | 163,566,720 | 32,760,000 |
| Size | 156.0 MB | 31.2 MB |
| Events in quadrant A | 1,935,840 | 206,805 |
| Events in quadrant B | 850,723 | 235,698 |
| Events in quadrant C | 867,631 | 218,502 |
| Events in quadrant D | 1,193,543 | 217,756 |
| Mode M0 | |||
|---|---|---|---|
| Quadrant | BADHDUFLAG | Total packets | Discarded packets |
| A | 0 | 6877 | 0 |
| B | 0 | 3472 | 0 |
| C | 0 | 3520 | 0 |
| D | 0 | 4531 | 0 |
| Mode M9 | |||
|---|---|---|---|
| Quadrant | BADHDUFLAG | Total packets | Discarded packets |
| A | 0 | 9 | 0 |
| B | 0 | 9 | 0 |
| C | 0 | 9 | 0 |
| D | 0 | 9 | 0 |
| Quadrant | Total seconds | Saturated seconds | Saturation percentage |
|---|---|---|---|
| A | 1525 | 517 | 33.901639% |
| B | 1525 | 9 | 0.590164% |
| C | 1525 | 33 | 2.163934% |
| D | 1524 | 39 | 2.559055% |
Noise dominated data is calculated using 1-second bins in cleaned event files. If a bin has >2000 counts, and if more than 50% of those come from <1% of pixels, then it is considered to be noise-dominated and hence unusable.
| Quadrant | # 1 sec bins | Bins with >0 counts | Bins with >2000 counts | High rate bins dominated by noise | Noise dominated (total time) | Noise dominated (detector-on time) | Marked lightcurve |
|---|---|---|---|---|---|---|---|
| A | 1525 | 1525 | 383 | 383 | 25.11% | 25.11% | 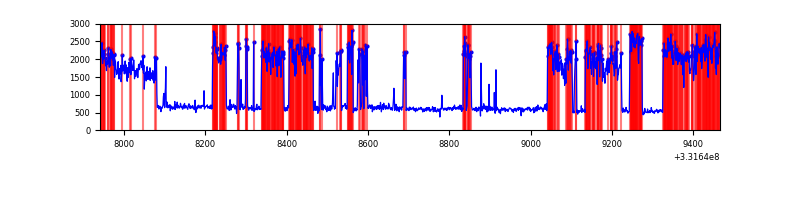 |
| B | 1525 | 1525 | 0 | 0 | 0.00% | 0.00% | 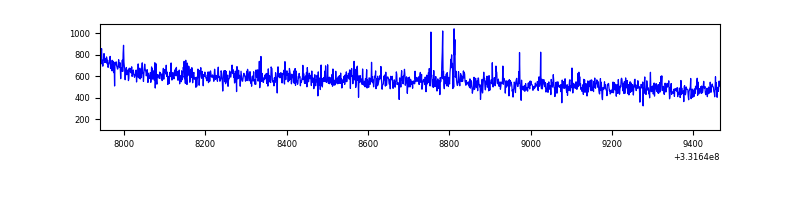 |
| C | 1525 | 1525 | 2 | 2 | 0.13% | 0.13% | 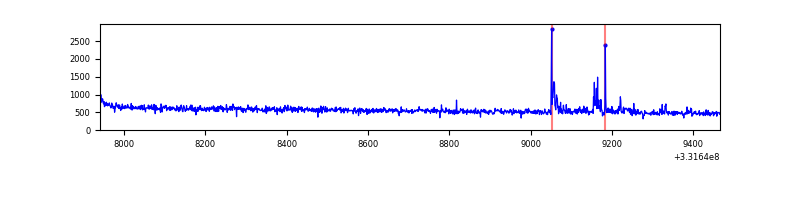 |
| D | 1524 | 1524 | 24 | 24 | 1.57% | 1.57% | 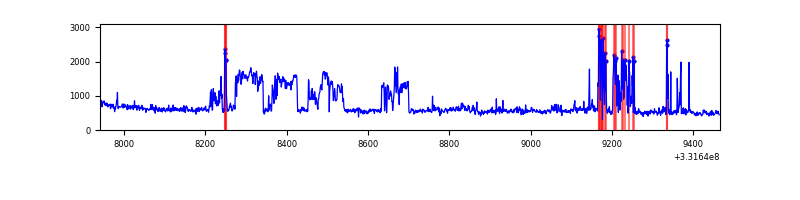 |
Top three noisy pixels from each quadrant. If the there are fewer than three noisy pixels in the level2.evt file, extra rows are filled as -1
| Pixel properties | Quadrant properties | ||||||
|---|---|---|---|---|---|---|---|
| Quadrant | DetID | PixID | Counts | Sigma | Mean | Median | Sigma |
| A | 0 | 13 | 1152782 | 27205.75 | 202 | 198 | 42.4 |
| A | 13 | 254 | 2282 | 49.19 | 202 | 198 | 42.4 |
| A | 3 | 137 | 1824 | 38.38 | 202 | 198 | 42.4 |
| B | 0 | 190 | 6899 | 157.2 | 213 | 208 | 42.6 |
| B | 4 | 171 | 5924 | 134.29 | 213 | 208 | 42.6 |
| B | 12 | 111 | 4840 | 108.82 | 213 | 208 | 42.6 |
| C | 14 | 238 | 33243 | 669.51 | 205 | 206 | 49.3 |
| C | 0 | 207 | 29916 | 602.09 | 205 | 206 | 49.3 |
| C | 3 | 233 | 4161 | 80.15 | 205 | 206 | 49.3 |
| D | 1 | 52 | 333726 | 6402.1 | 212 | 207 | 52.1 |
| D | 8 | 195 | 41881 | 799.96 | 212 | 207 | 52.1 |
| D | 12 | 233 | 8717 | 163.35 | 212 | 207 | 52.1 |
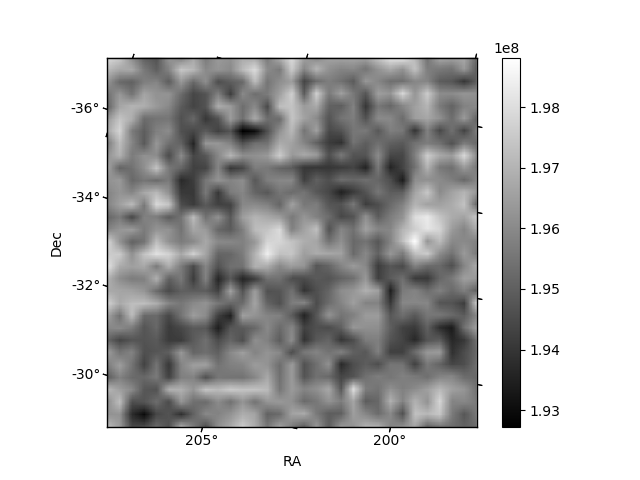
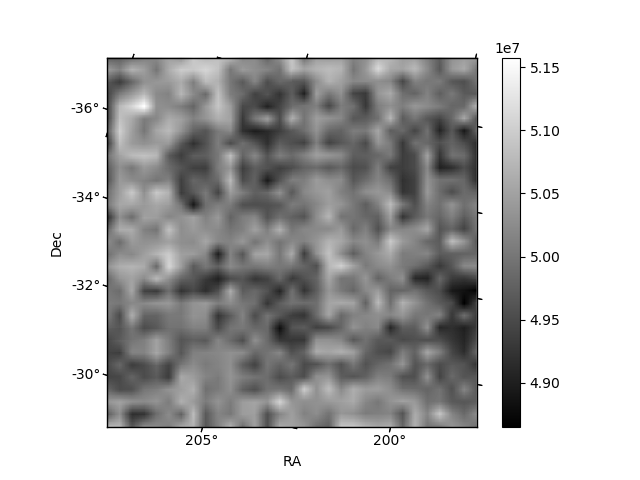
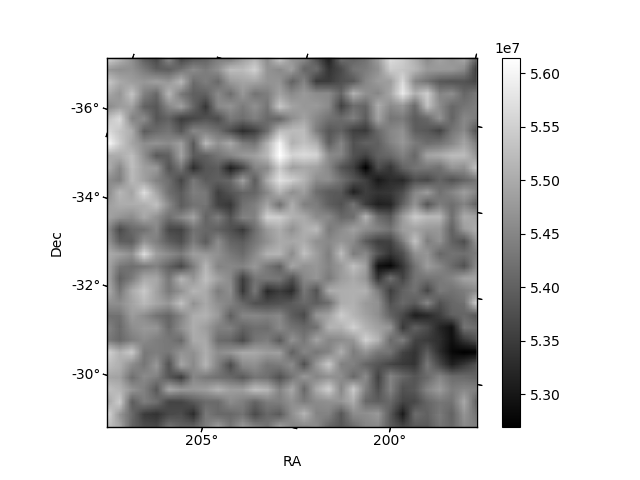
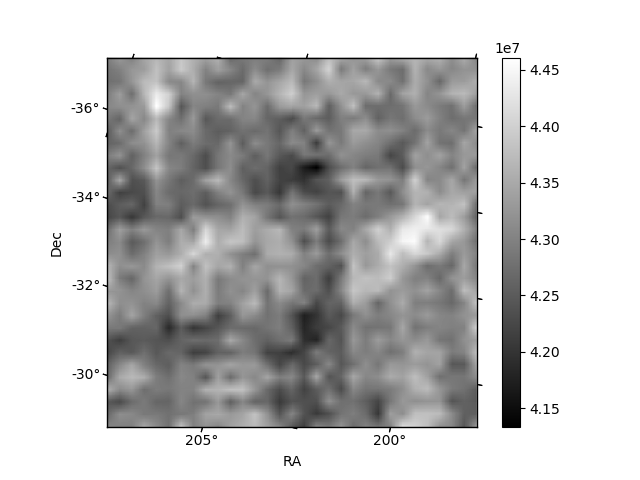
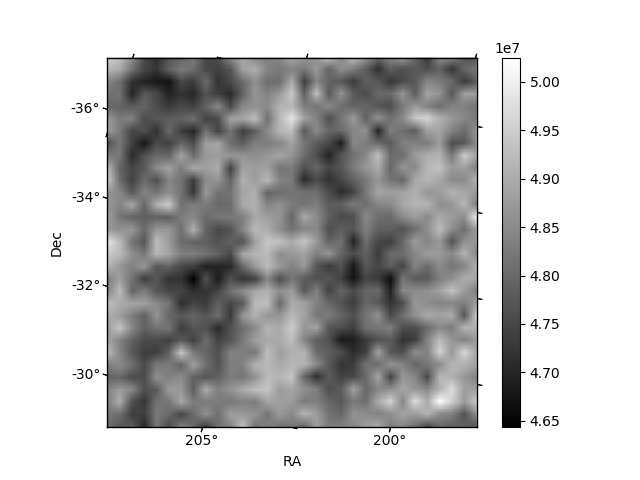
Histogram calculated using DETX and DETY for each event in the final _common_clean file
| Quadrant A | 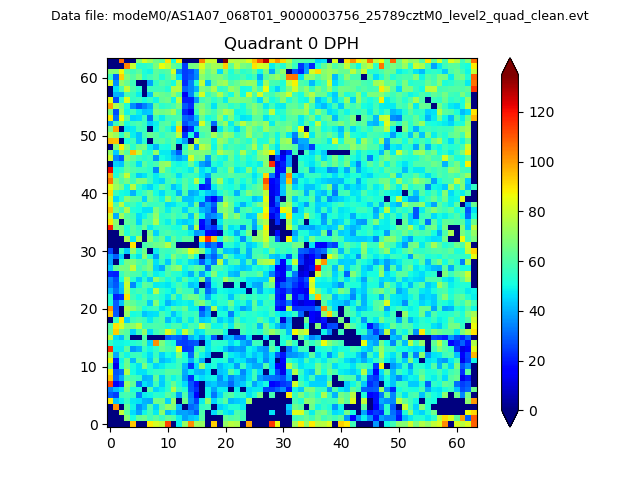 |
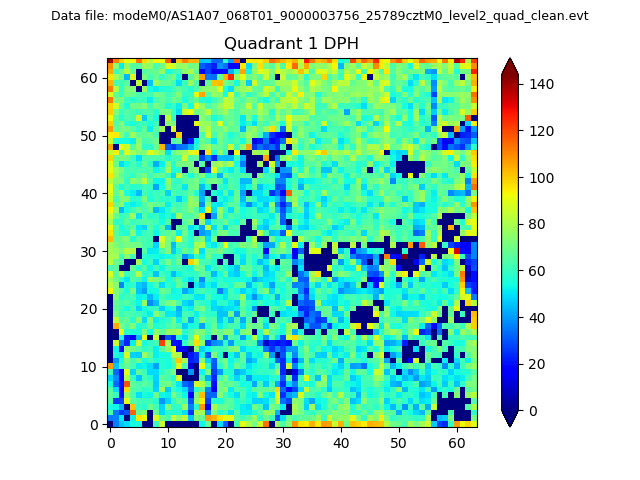 |
Quadrant B |
|---|---|---|---|
| Quadrant D |  |
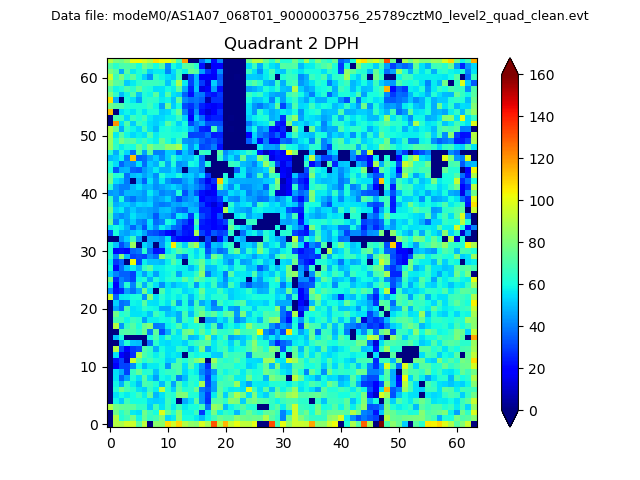 |
Quadrant C |
| Plot type | Count rate plots | Images |
|---|---|---|
| Comparison with Poisson distribution Blue bars denote a histogram of data divided into 1 sec bins. Red curve is a Poisson curve with rate = median count rate of data. |
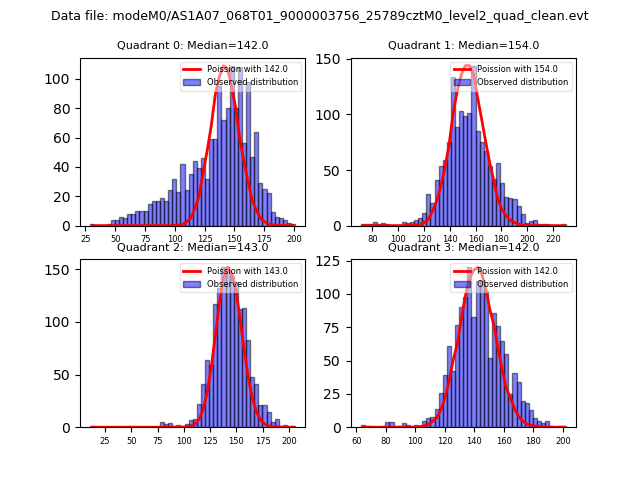 |
 |
| Quadrant-wise count rates Data is divided into 100 sec bins |
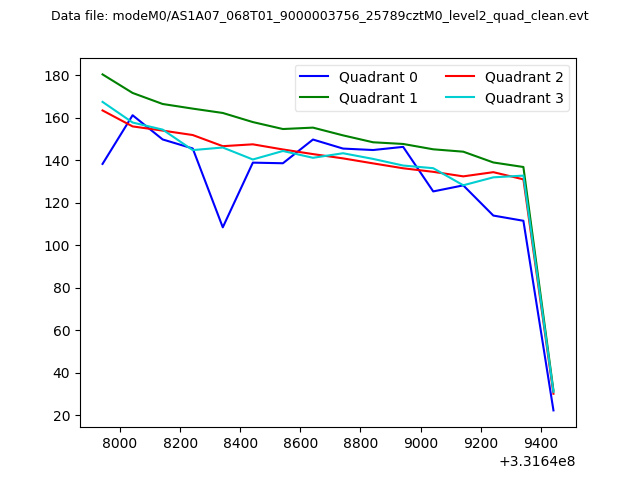 |
|
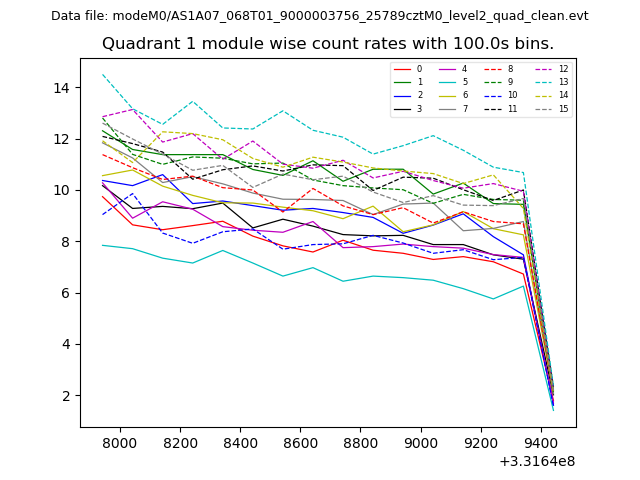
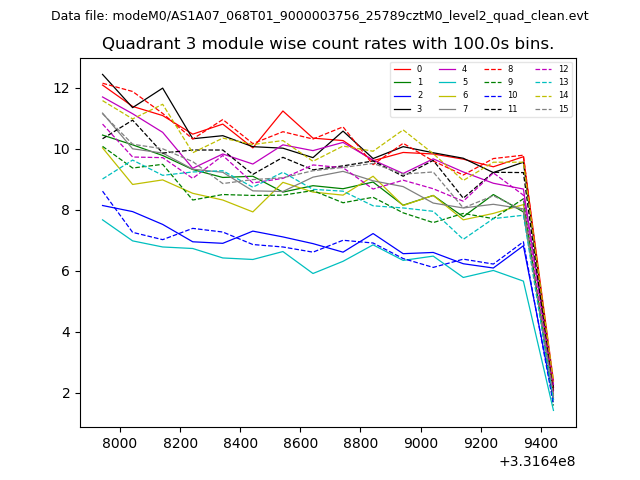
| Module-wise count rates for Quadrant A Data is divided into 100 sec bins |
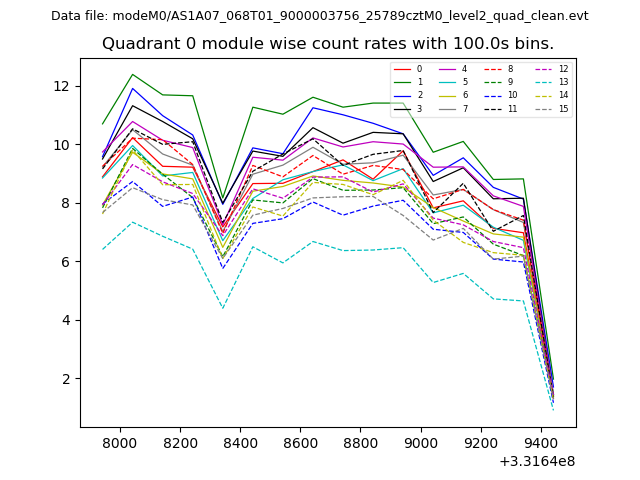 |
 |
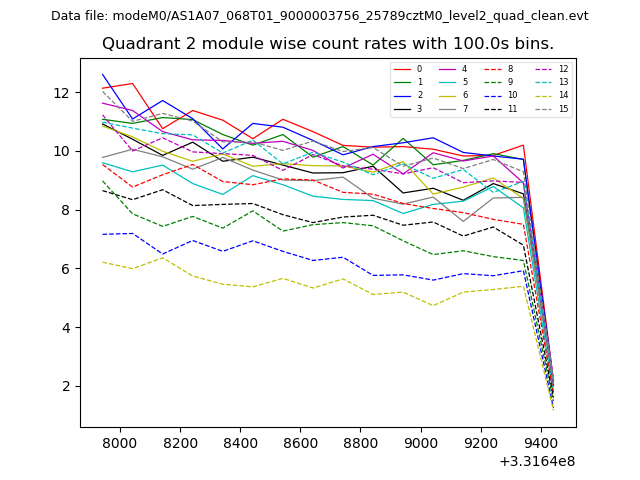
| Module-wise count rates for Quadrant B Data is divided into 100 sec bins |
 |
 |
| Module-wise count rates for Quadrant C Data is divided into 100 sec bins |
 |
 |
| Module-wise count rates for Quadrant D Data is divided into 100 sec bins |
 |
 |
| Parameter | Plot |
|---|---|
| CZT HV Monitor | 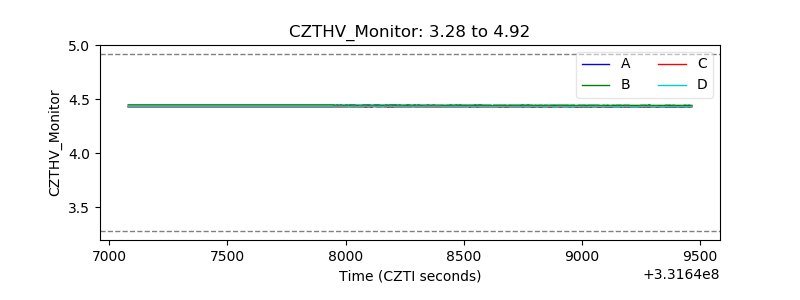 |
| D_VDD | 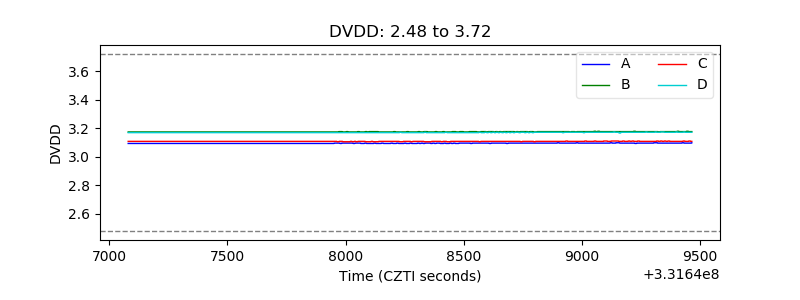 |
| Temperature 1 | 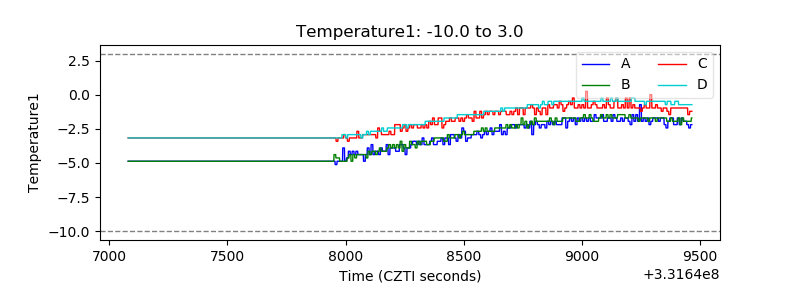 |
| Veto HV Monitor |  |
| Veto LLD | 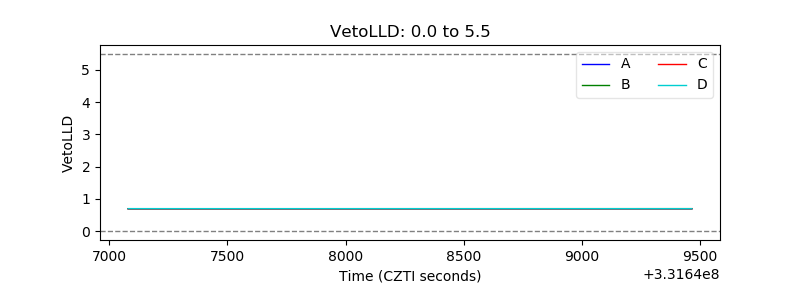 |
| Alpha Counter | 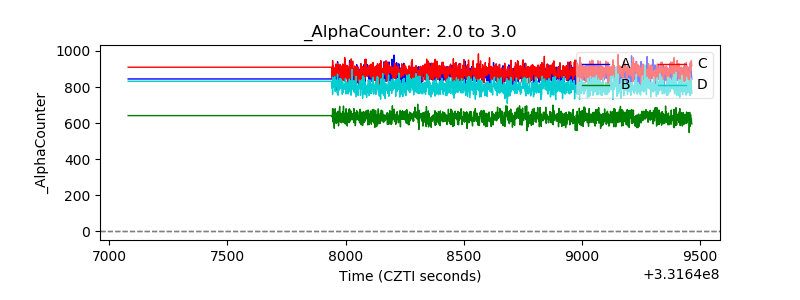 |
| _CPM_Rate |  |
| CZT Counter | 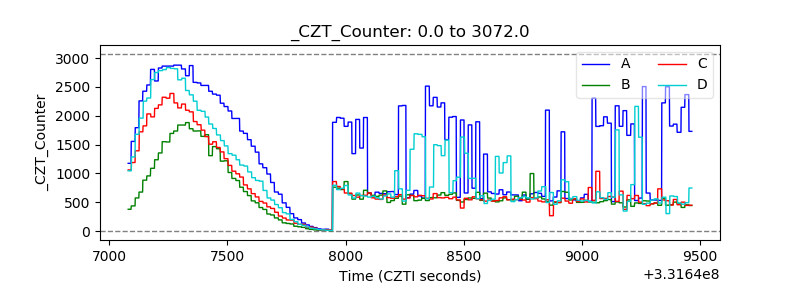 |
| +2.5 Volts monitor |  |
| +5 Volts monitor |  |
| _ROLL_ROT | 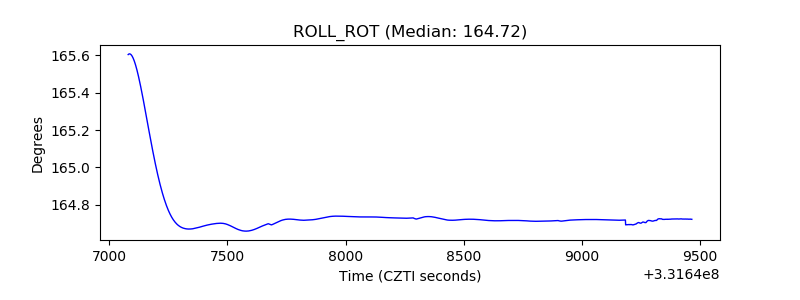 |
| _Roll_DEC | 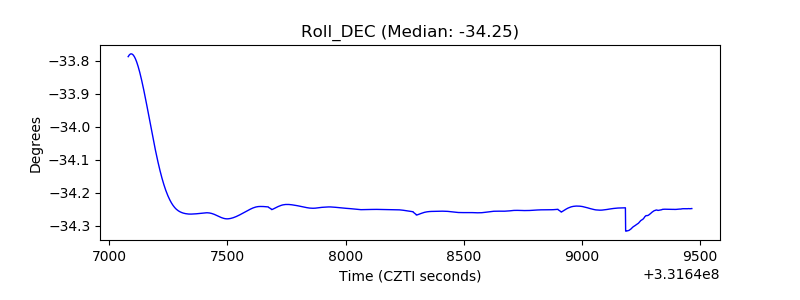 |
| _Roll_RA | 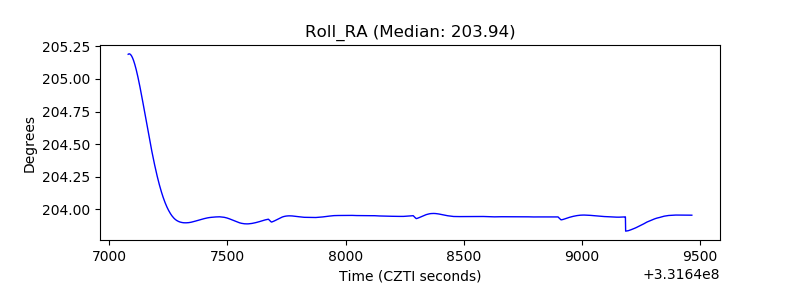 |
| Veto Counter | 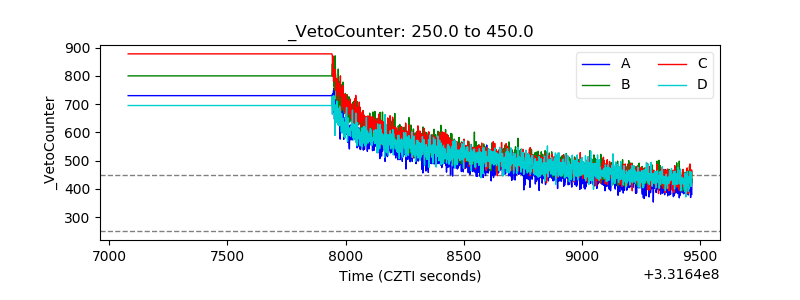 |