| Param | Original file | Final file |
|---|---|---|
| Filename | modeM0/AS1A07_068T01_9000003756_25791cztM0_level2.evt | modeM0/AS1A07_068T01_9000003756_25791cztM0_level2_quad_clean.evt |
| Size (bytes) | 620,536,320 | 103,374,720 |
| Size | 591.8 MB | 98.6 MB |
| Events in quadrant A | 7,755,675 | 601,088 |
| Events in quadrant B | 3,313,937 | 721,070 |
| Events in quadrant C | 3,293,185 | 675,208 |
| Events in quadrant D | 3,987,577 | 677,247 |
| Mode M0 | |||
|---|---|---|---|
| Quadrant | BADHDUFLAG | Total packets | Discarded packets |
| A | 0 | 27403 | 0 |
| B | 0 | 14038 | 0 |
| C | 0 | 14054 | 0 |
| D | 0 | 16315 | 0 |
| Mode M9 | |||
|---|---|---|---|
| Quadrant | BADHDUFLAG | Total packets | Discarded packets |
| A | 0 | 11 | 0 |
| B | 0 | 11 | 0 |
| C | 0 | 11 | 0 |
| D | 0 | 11 | 0 |
| Quadrant | Total seconds | Saturated seconds | Saturation percentage |
|---|---|---|---|
| A | 6530 | 2092 | 32.036753% |
| B | 6530 | 66 | 1.010720% |
| C | 6531 | 102 | 1.561782% |
| D | 6531 | 104 | 1.592405% |
Noise dominated data is calculated using 1-second bins in cleaned event files. If a bin has >2000 counts, and if more than 50% of those come from <1% of pixels, then it is considered to be noise-dominated and hence unusable.
| Quadrant | # 1 sec bins | Bins with >0 counts | Bins with >2000 counts | High rate bins dominated by noise | Noise dominated (total time) | Noise dominated (detector-on time) | Marked lightcurve |
|---|---|---|---|---|---|---|---|
| A | 7635 | 6530 | 1853 | 1853 | 24.27% | 28.38% | 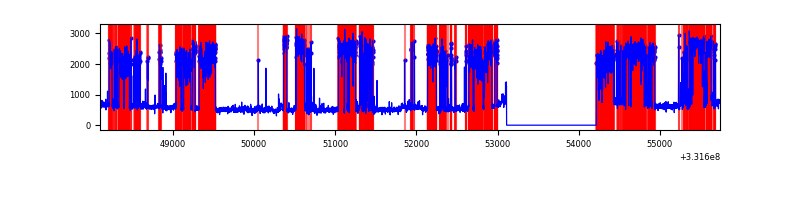 |
| B | 7635 | 6530 | 1 | 1 | 0.01% | 0.02% | 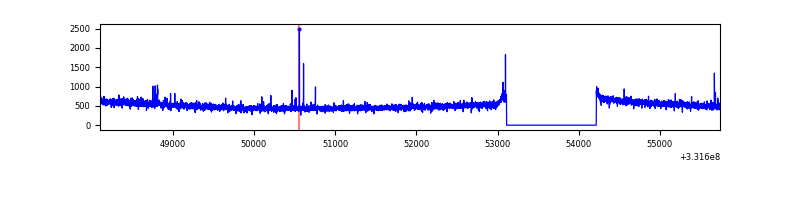 |
| C | 7636 | 6531 | 2 | 2 | 0.03% | 0.03% | 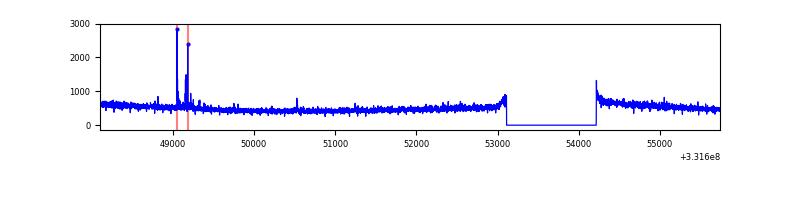 |
| D | 7636 | 6531 | 44 | 44 | 0.58% | 0.67% | 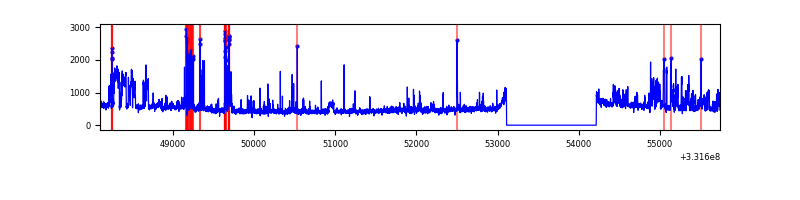 |
Top three noisy pixels from each quadrant. If the there are fewer than three noisy pixels in the level2.evt file, extra rows are filled as -1
| Pixel properties | Quadrant properties | ||||||
|---|---|---|---|---|---|---|---|
| Quadrant | DetID | PixID | Counts | Sigma | Mean | Median | Sigma |
| A | 0 | 13 | 4859476 | 32326.18 | 750 | 737 | 150.3 |
| A | 13 | 254 | 8644 | 52.61 | 750 | 737 | 150.3 |
| A | 3 | 137 | 6639 | 39.27 | 750 | 737 | 150.3 |
| B | 12 | 111 | 18956 | 113.99 | 835 | 816 | 159.1 |
| B | 11 | 111 | 17018 | 101.82 | 835 | 816 | 159.1 |
| B | 14 | 111 | 15102 | 89.77 | 835 | 816 | 159.1 |
| C | 14 | 238 | 127590 | 680.21 | 798 | 802 | 186.4 |
| C | 0 | 207 | 30595 | 159.84 | 798 | 802 | 186.4 |
| C | 3 | 233 | 25615 | 133.12 | 798 | 802 | 186.4 |
| D | 1 | 52 | 762691 | 3882.27 | 818 | 798 | 196.2 |
| D | 8 | 195 | 71288 | 359.19 | 818 | 798 | 196.2 |
| D | 2 | 234 | 27875 | 137.97 | 818 | 798 | 196.2 |
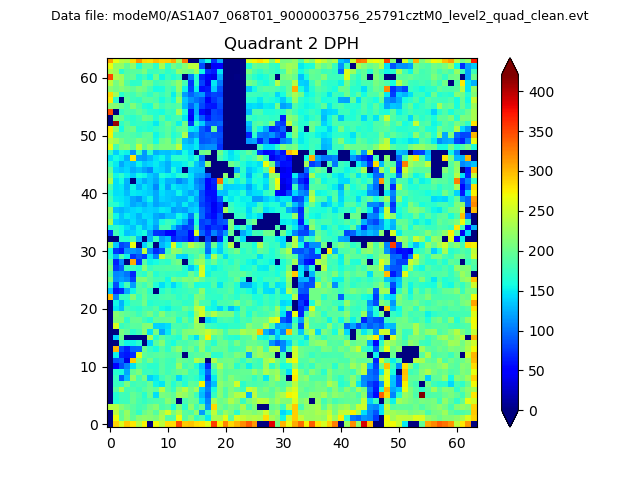
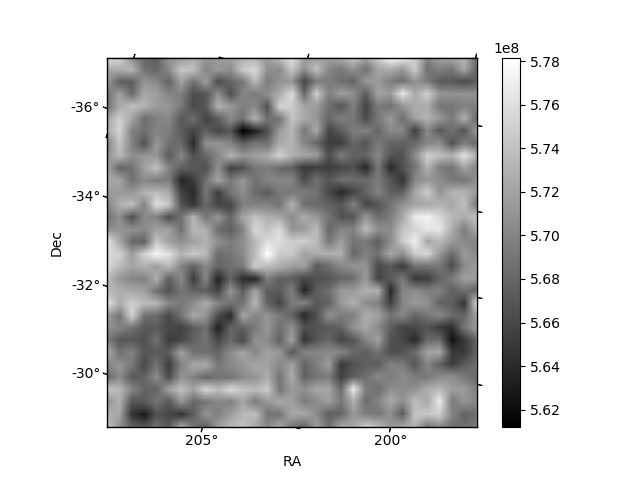
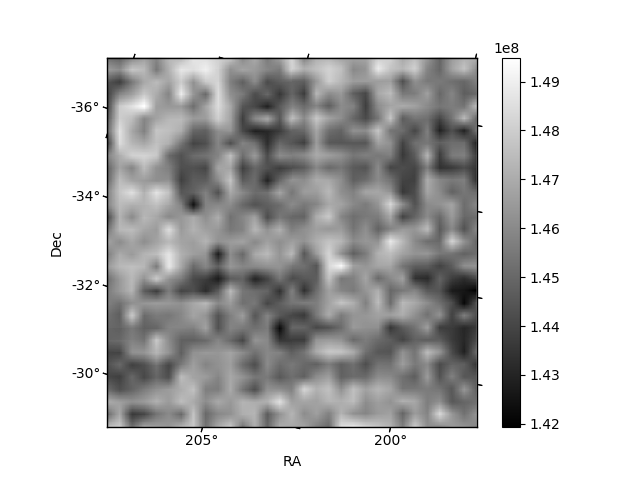
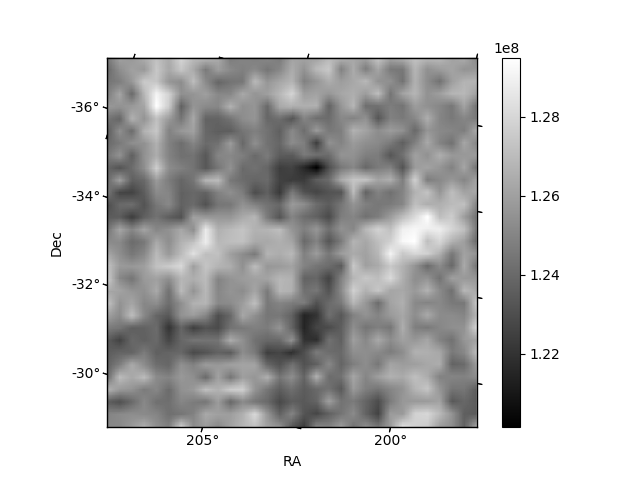
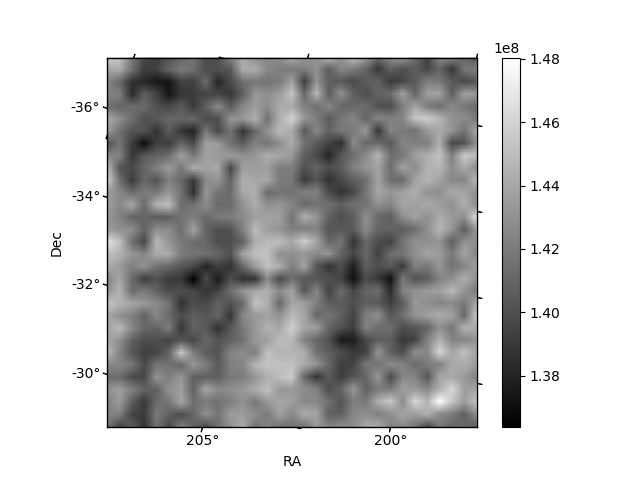
Histogram calculated using DETX and DETY for each event in the final _common_clean file
| Quadrant A | 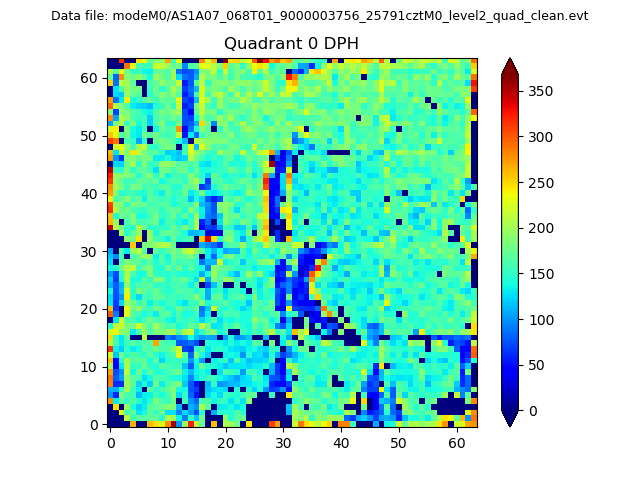 |
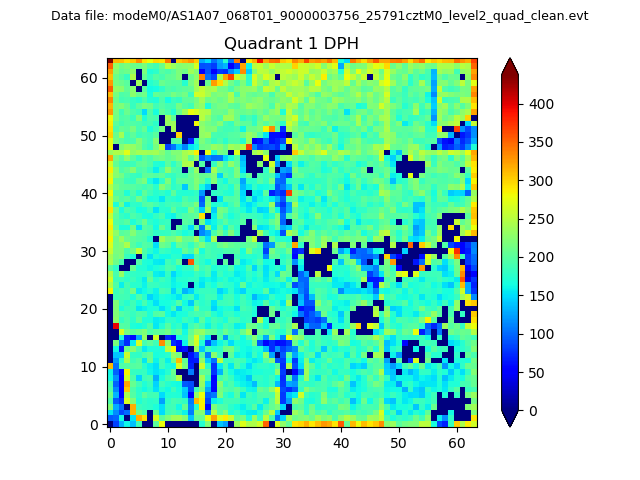 |
Quadrant B |
|---|---|---|---|
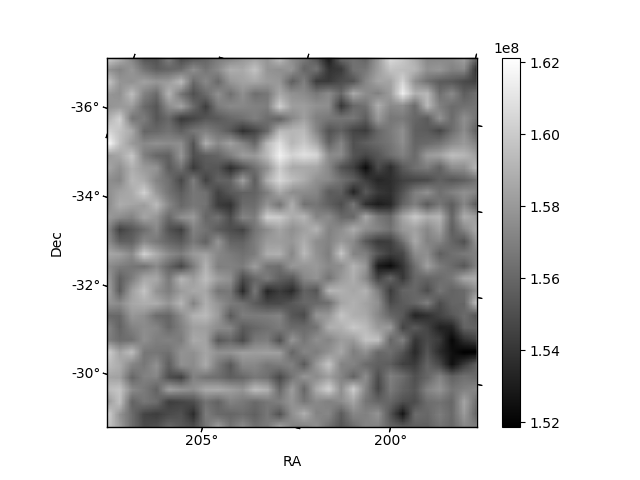
| Quadrant D | 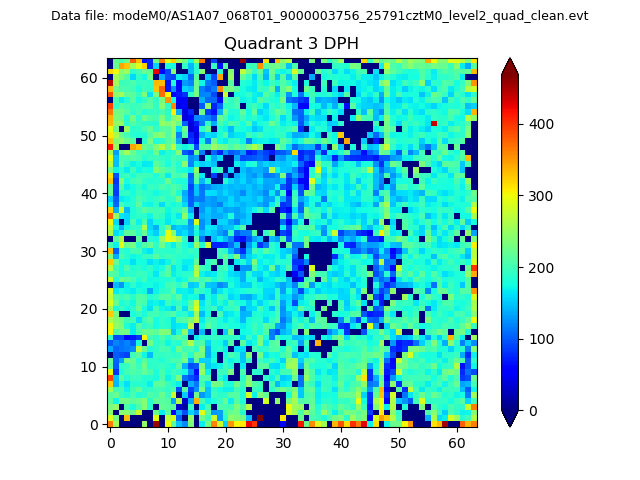 |
 |
Quadrant C |
| Plot type | Count rate plots | Images |
|---|---|---|
| Comparison with Poisson distribution Blue bars denote a histogram of data divided into 1 sec bins. Red curve is a Poisson curve with rate = median count rate of data. |
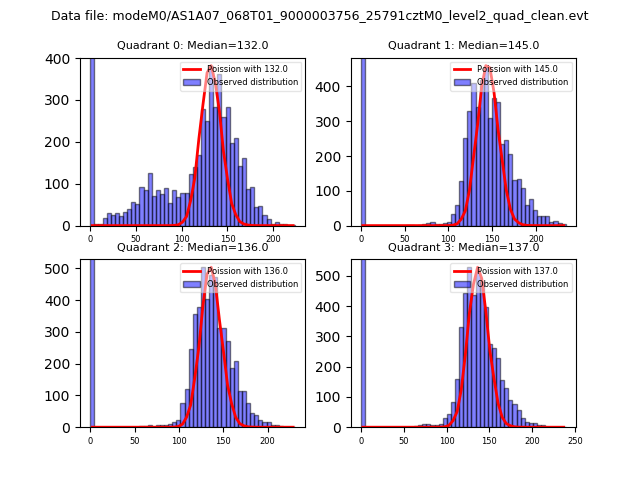 |
 |
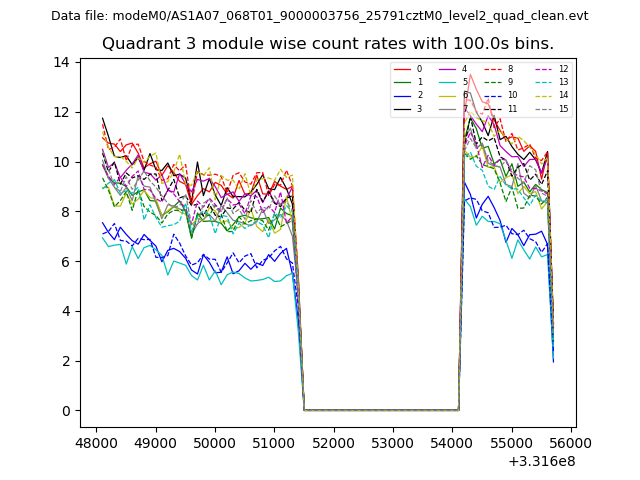
| Quadrant-wise count rates Data is divided into 100 sec bins |
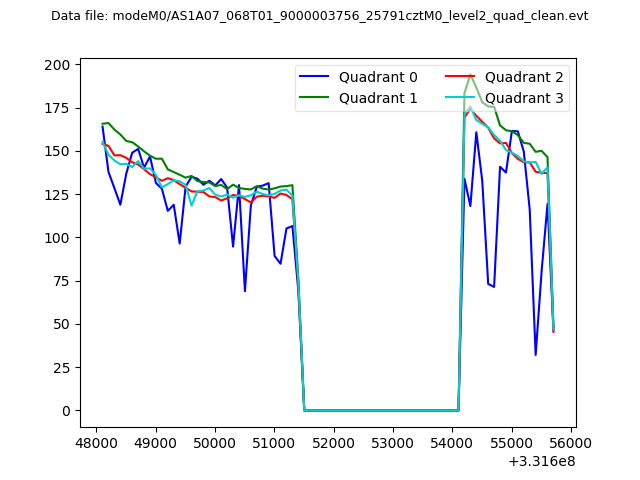 |
|
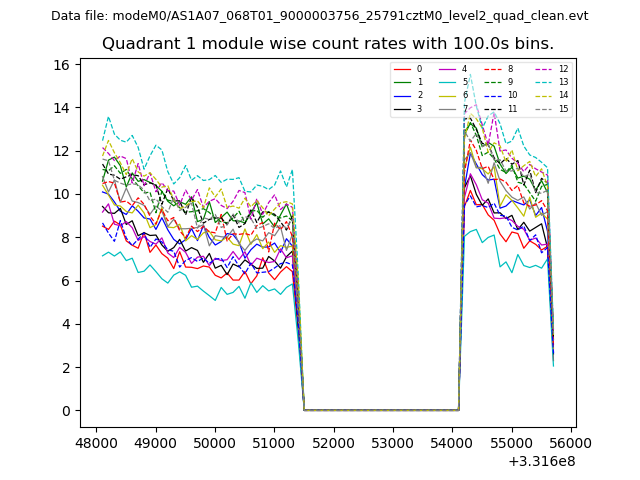
| Module-wise count rates for Quadrant A Data is divided into 100 sec bins |
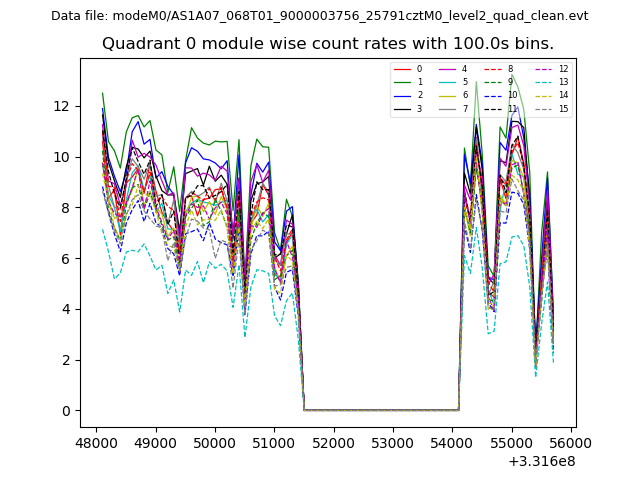 |
 |
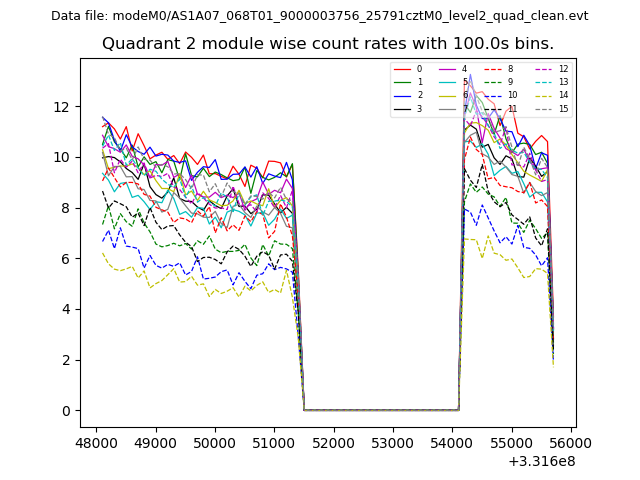
| Module-wise count rates for Quadrant B Data is divided into 100 sec bins |
 |
 |
| Module-wise count rates for Quadrant C Data is divided into 100 sec bins |
 |
 |
| Module-wise count rates for Quadrant D Data is divided into 100 sec bins |
 |
 |
| Parameter | Plot |
|---|---|
| CZT HV Monitor | 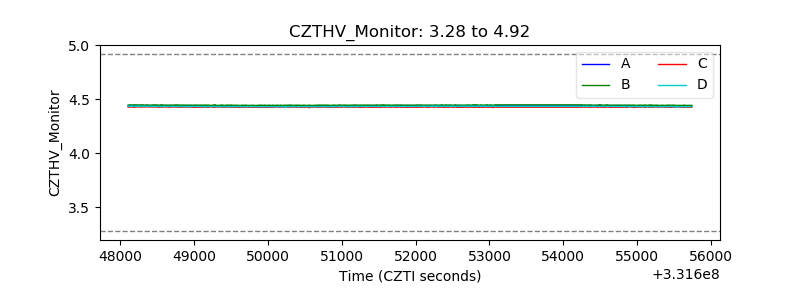 |
| D_VDD | 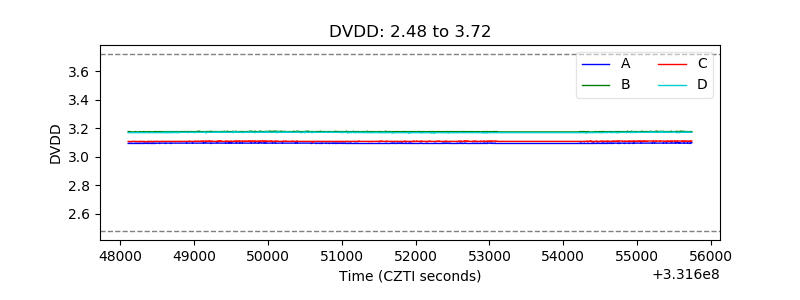 |
| Temperature 1 | 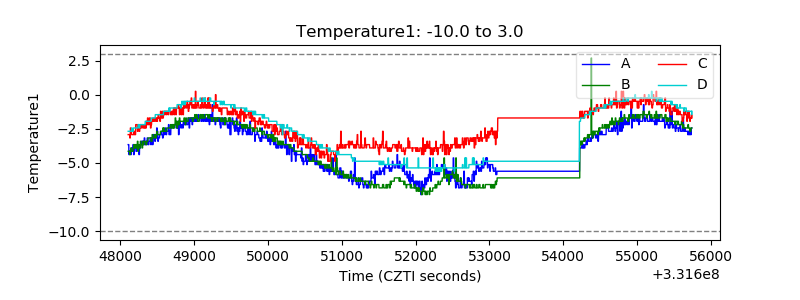 |
| Veto HV Monitor | 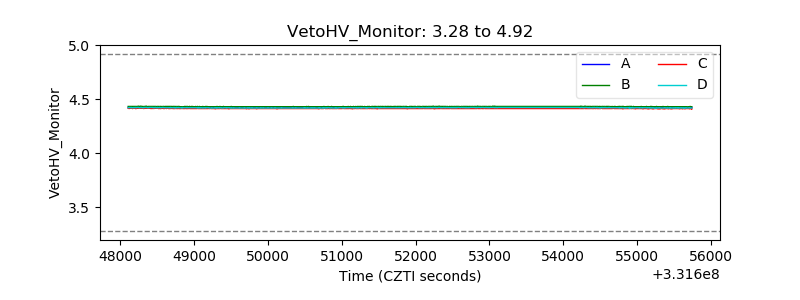 |
| Veto LLD | 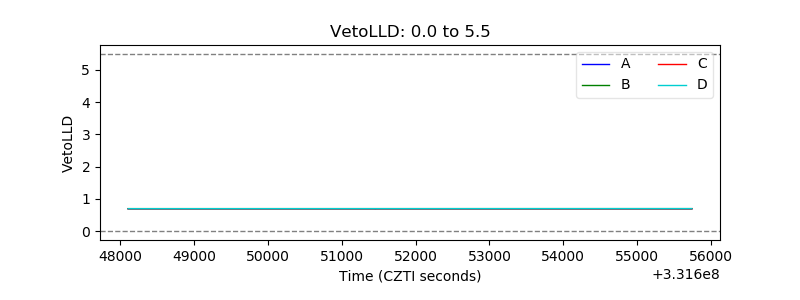 |
| Alpha Counter | 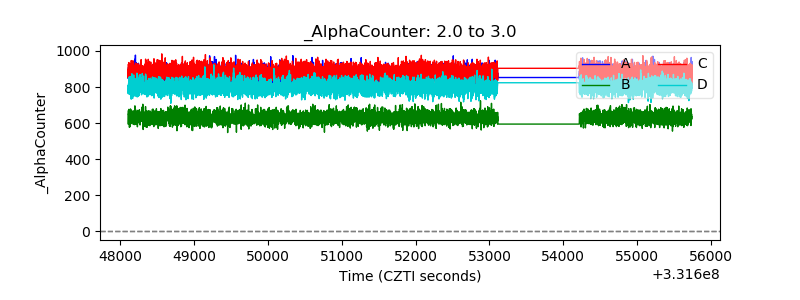 |
| _CPM_Rate | 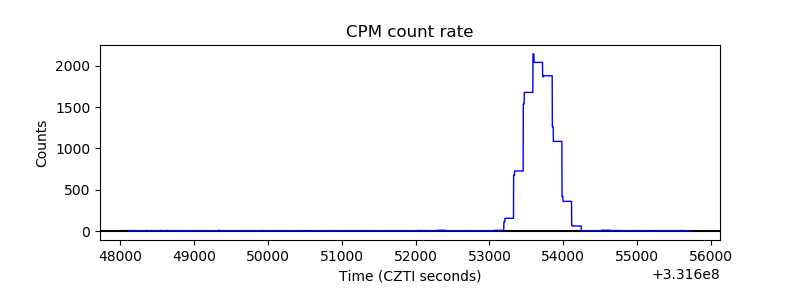 |
| CZT Counter |  |
| +2.5 Volts monitor |  |
| +5 Volts monitor |  |
| _ROLL_ROT | 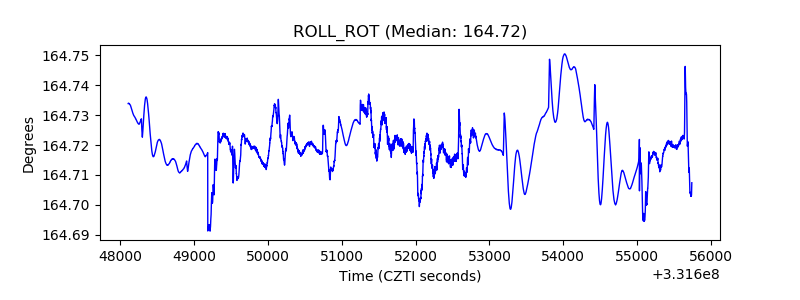 |
| _Roll_DEC | 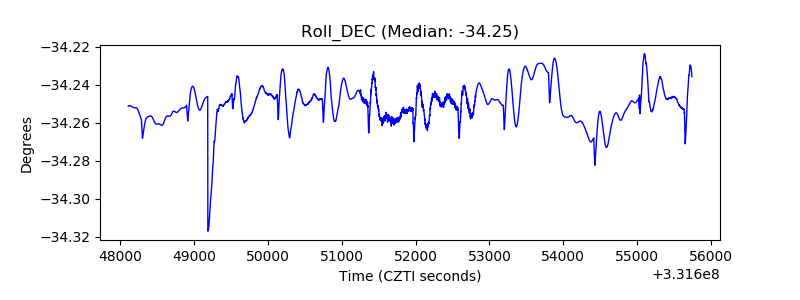 |
| _Roll_RA | 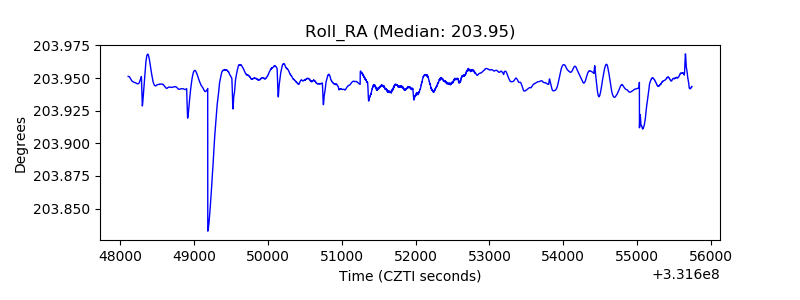 |
| Veto Counter | 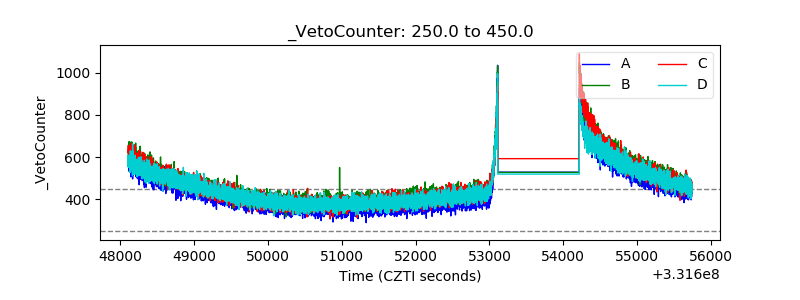 |