| Param | Original file | Final file |
|---|---|---|
| Filename | modeM0/AS1A07_068T01_9000003756_25792cztM0_level2.evt | modeM0/AS1A07_068T01_9000003756_25792cztM0_level2_quad_clean.evt |
| Size (bytes) | 632,062,080 | 96,143,040 |
| Size | 602.8 MB | 91.7 MB |
| Events in quadrant A | 7,687,237 | 548,034 |
| Events in quadrant B | 3,252,486 | 675,438 |
| Events in quadrant C | 3,191,343 | 628,410 |
| Events in quadrant D | 4,590,357 | 625,052 |
| Mode M0 | |||
|---|---|---|---|
| Quadrant | BADHDUFLAG | Total packets | Discarded packets |
| A | 0 | 27123 | 0 |
| B | 0 | 13644 | 0 |
| C | 0 | 13547 | 0 |
| D | 0 | 17884 | 0 |
| Mode M9 | |||
|---|---|---|---|
| Quadrant | BADHDUFLAG | Total packets | Discarded packets |
| A | 0 | 13 | 0 |
| B | 0 | 13 | 0 |
| C | 0 | 13 | 0 |
| D | 0 | 13 | 0 |
| Quadrant | Total seconds | Saturated seconds | Saturation percentage |
|---|---|---|---|
| A | 6220 | 1742 | 28.006431% |
| B | 6220 | 39 | 0.627010% |
| C | 6220 | 59 | 0.948553% |
| D | 6220 | 62 | 0.996785% |
Noise dominated data is calculated using 1-second bins in cleaned event files. If a bin has >2000 counts, and if more than 50% of those come from <1% of pixels, then it is considered to be noise-dominated and hence unusable.
| Quadrant | # 1 sec bins | Bins with >0 counts | Bins with >2000 counts | High rate bins dominated by noise | Noise dominated (total time) | Noise dominated (detector-on time) | Marked lightcurve |
|---|---|---|---|---|---|---|---|
| A | 7470 | 6220 | 1603 | 1603 | 21.46% | 25.77% | 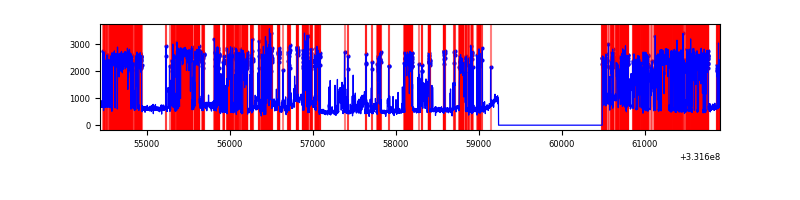 |
| B | 7470 | 6220 | 5 | 5 | 0.07% | 0.08% | 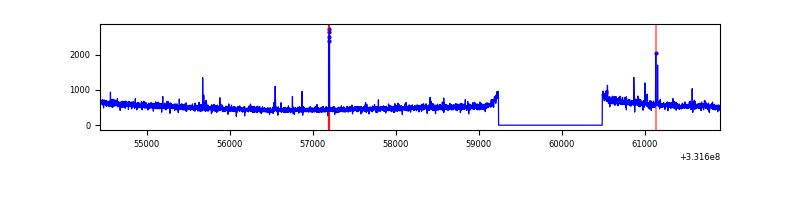 |
| C | 7470 | 6220 | 0 | 0 | 0.00% | 0.00% | 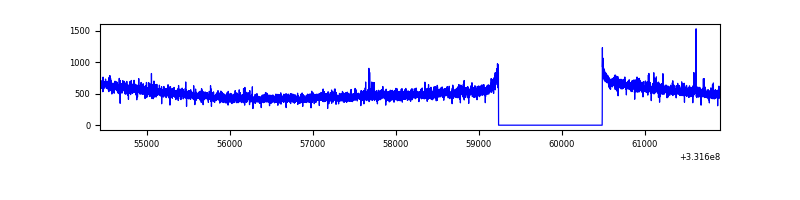 |
| D | 7470 | 6220 | 13 | 13 | 0.17% | 0.21% | 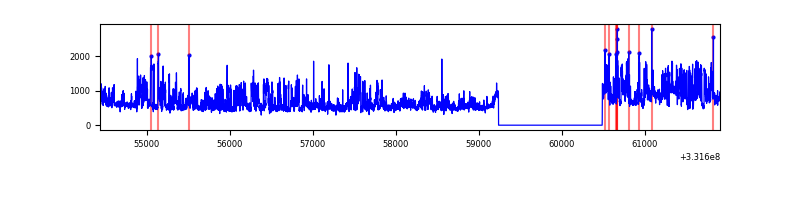 |
Top three noisy pixels from each quadrant. If the there are fewer than three noisy pixels in the level2.evt file, extra rows are filled as -1
| Pixel properties | Quadrant properties | ||||||
|---|---|---|---|---|---|---|---|
| Quadrant | DetID | PixID | Counts | Sigma | Mean | Median | Sigma |
| A | 0 | 13 | 4873554 | 33177.47 | 728 | 716 | 146.9 |
| A | 13 | 254 | 7692 | 47.49 | 728 | 716 | 146.9 |
| A | 6 | 16 | 6985 | 42.68 | 728 | 716 | 146.9 |
| B | 0 | 190 | 23220 | 145.73 | 814 | 796 | 153.9 |
| B | 12 | 111 | 18110 | 112.52 | 814 | 796 | 153.9 |
| B | 11 | 111 | 15962 | 98.56 | 814 | 796 | 153.9 |
| C | 14 | 238 | 126272 | 704.26 | 770 | 778 | 178.2 |
| C | 3 | 233 | 51312 | 283.59 | 770 | 778 | 178.2 |
| C | 1 | 16 | 8165 | 41.46 | 770 | 778 | 178.2 |
| D | 1 | 52 | 1285350 | 6742.01 | 790 | 772 | 190.5 |
| D | 8 | 195 | 183251 | 957.73 | 790 | 772 | 190.5 |
| D | 7 | 80 | 48667 | 251.37 | 790 | 772 | 190.5 |
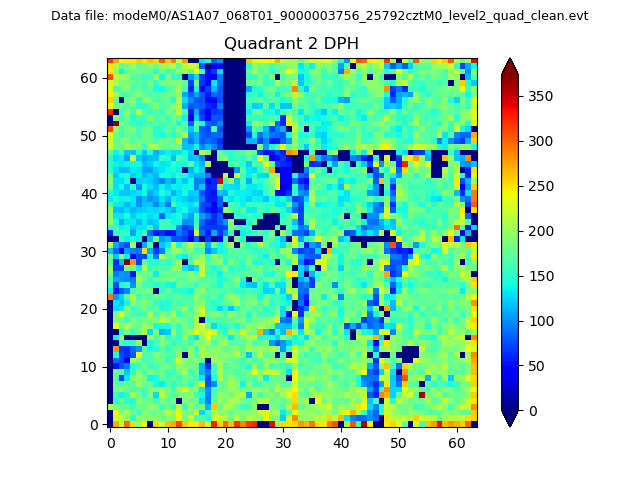
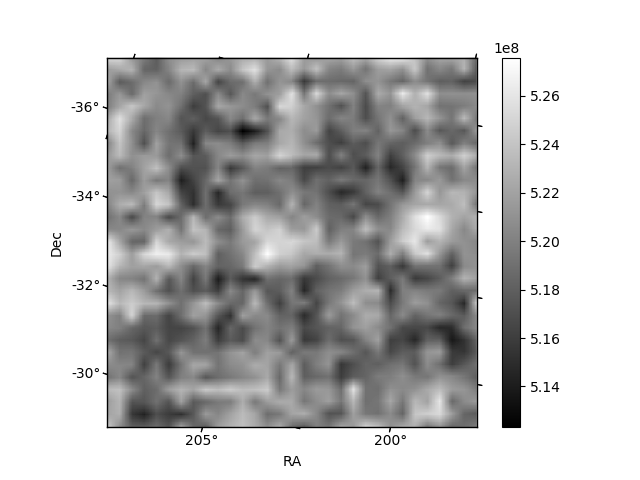
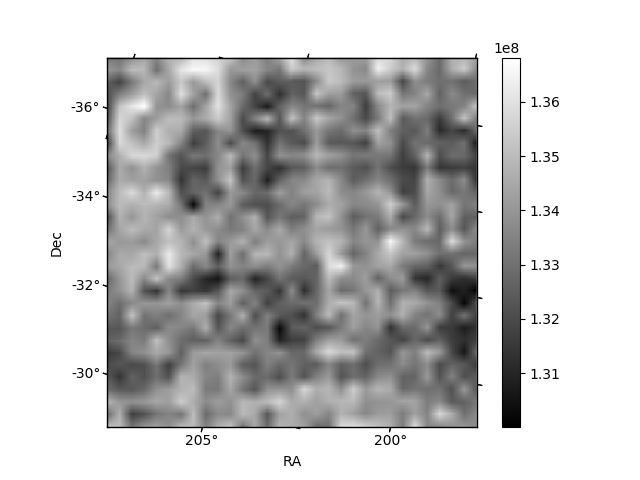
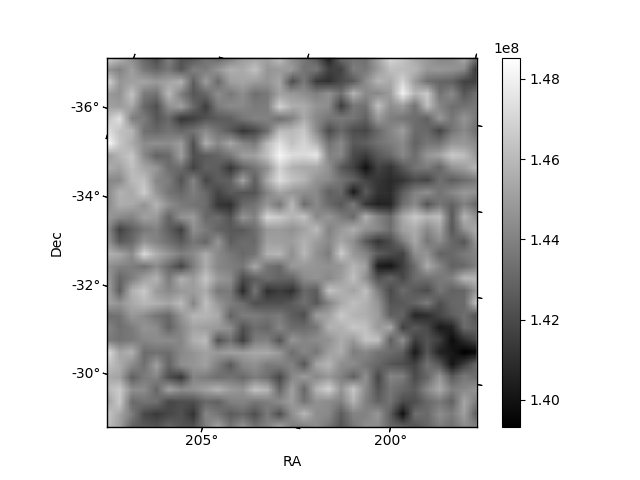
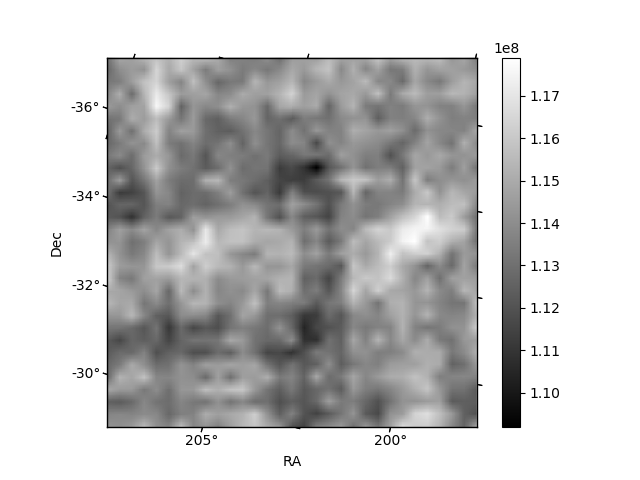
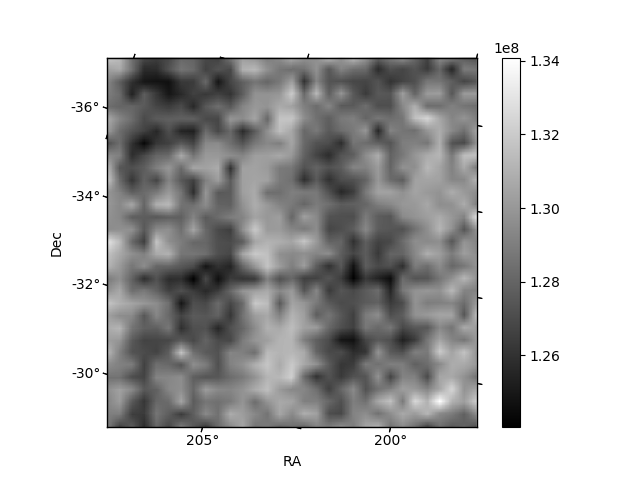
Histogram calculated using DETX and DETY for each event in the final _common_clean file
| Quadrant A | 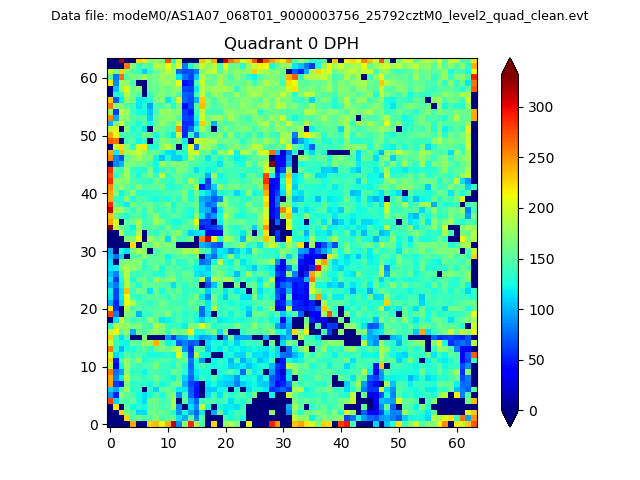 |
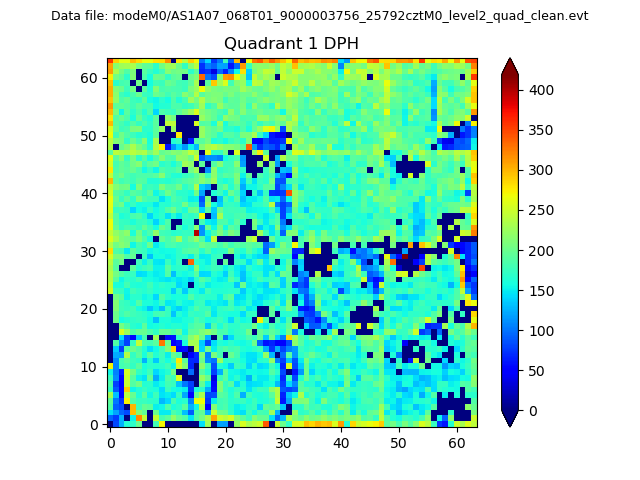 |
Quadrant B |
|---|---|---|---|
| Quadrant D | 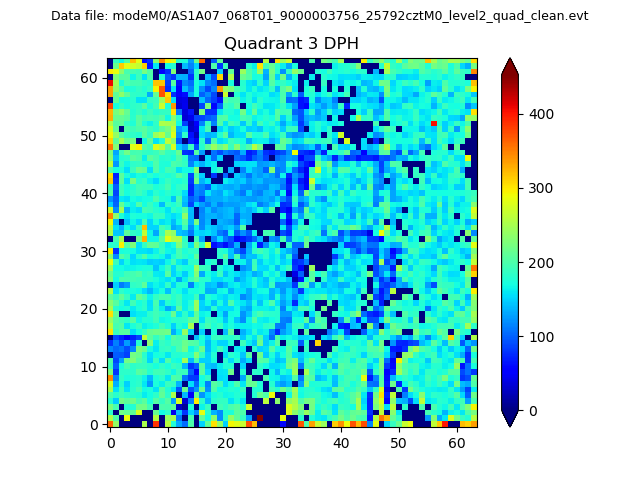 |
 |
Quadrant C |
| Plot type | Count rate plots | Images |
|---|---|---|
| Comparison with Poisson distribution Blue bars denote a histogram of data divided into 1 sec bins. Red curve is a Poisson curve with rate = median count rate of data. |
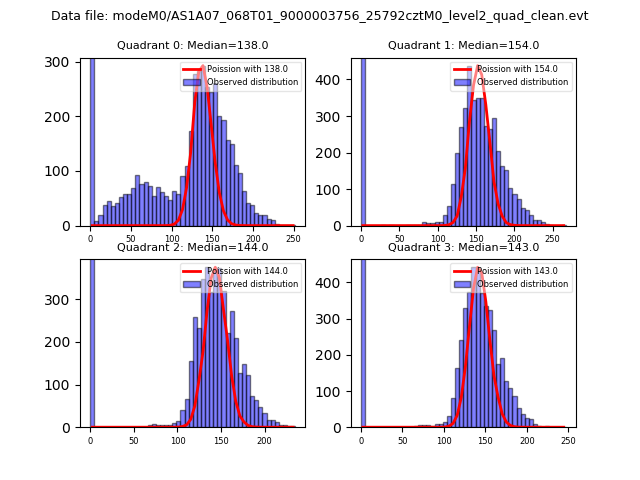 |
 |
| Quadrant-wise count rates Data is divided into 100 sec bins |
 |
|
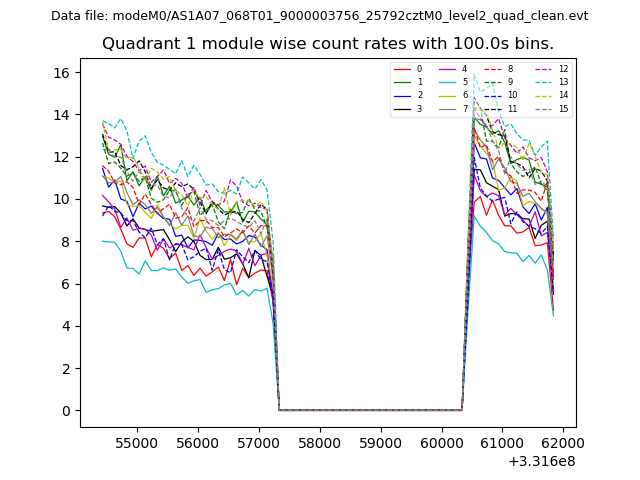
| Module-wise count rates for Quadrant A Data is divided into 100 sec bins |
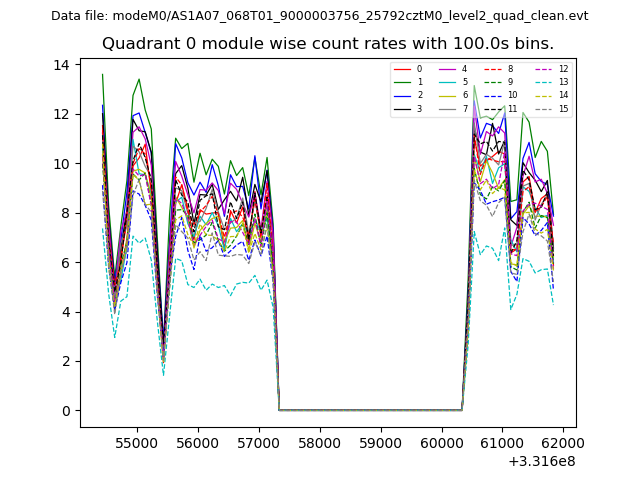 |
 |
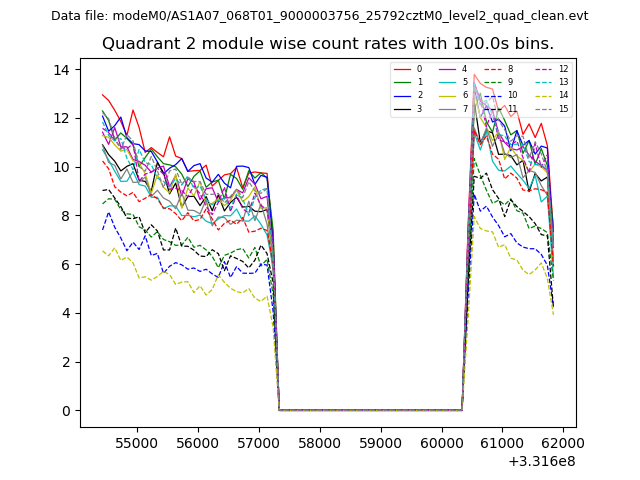
| Module-wise count rates for Quadrant B Data is divided into 100 sec bins |
 |
 |
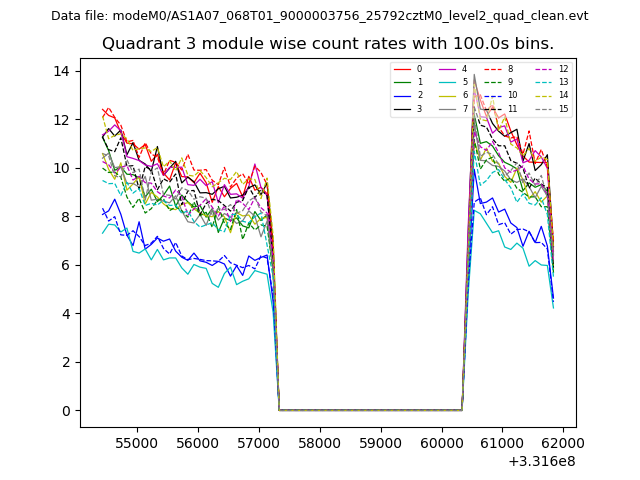
| Module-wise count rates for Quadrant C Data is divided into 100 sec bins |
 |
 |
| Module-wise count rates for Quadrant D Data is divided into 100 sec bins |
 |
 |
| Parameter | Plot |
|---|---|
| CZT HV Monitor | 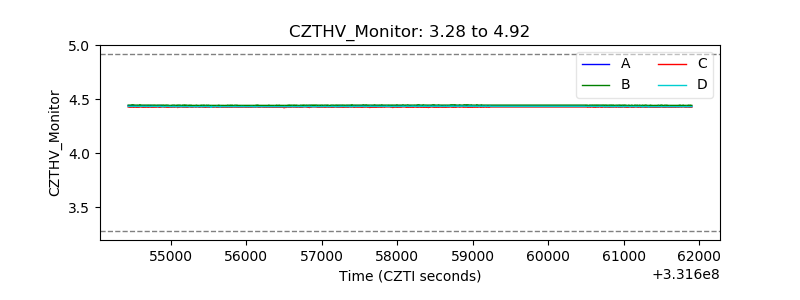 |
| D_VDD | 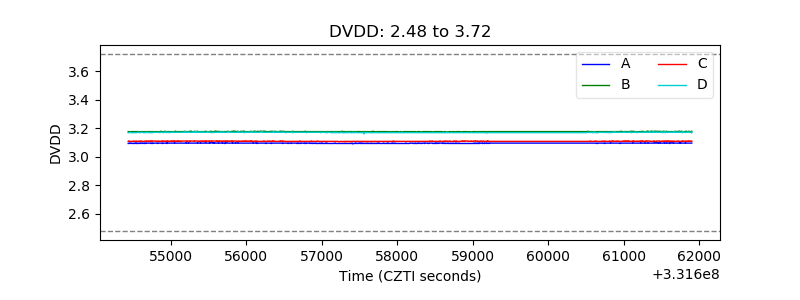 |
| Temperature 1 | 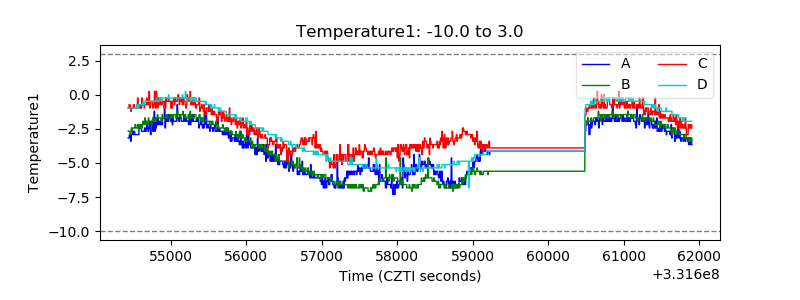 |
| Veto HV Monitor |  |
| Veto LLD | 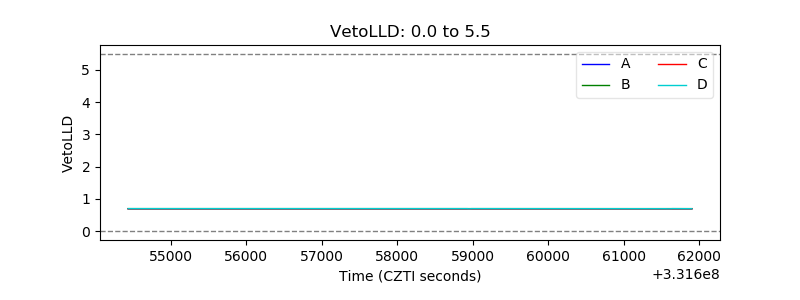 |
| Alpha Counter | 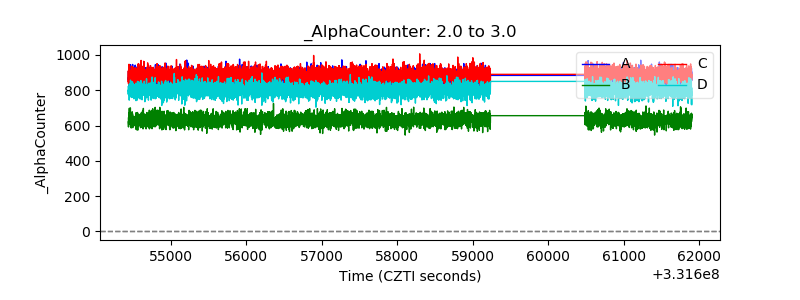 |
| _CPM_Rate | 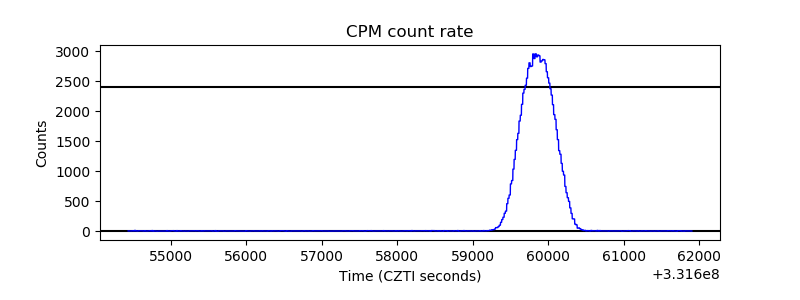 |
| CZT Counter | 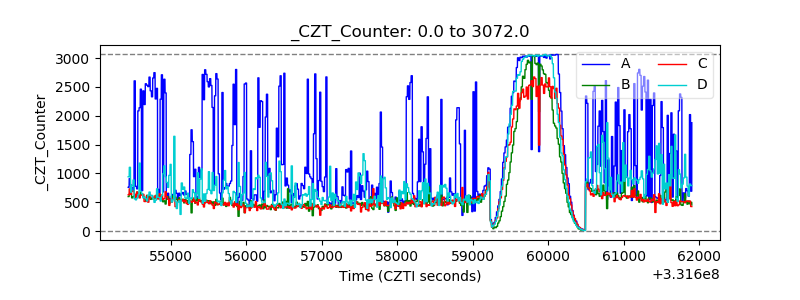 |
| +2.5 Volts monitor |  |
| +5 Volts monitor | 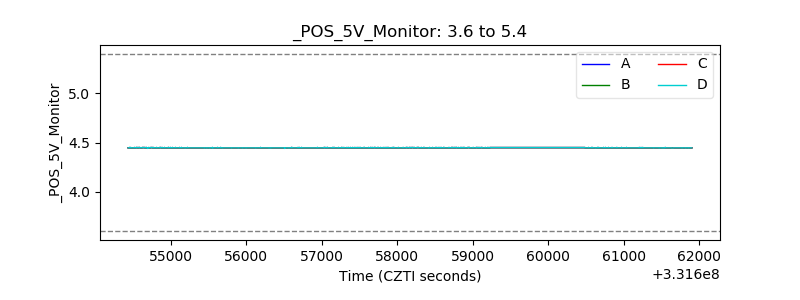 |
| _ROLL_ROT | 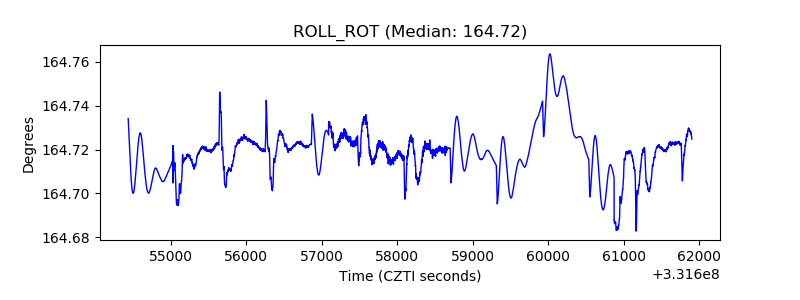 |
| _Roll_DEC | 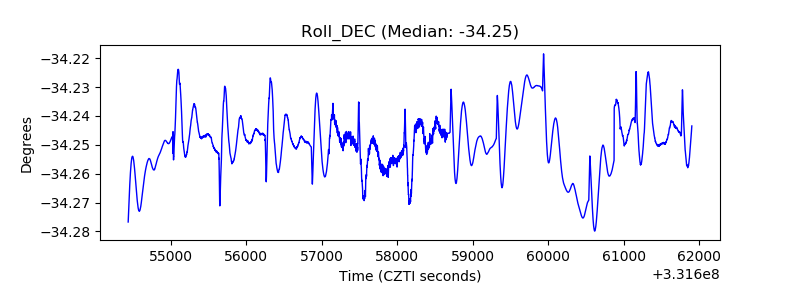 |
| _Roll_RA | 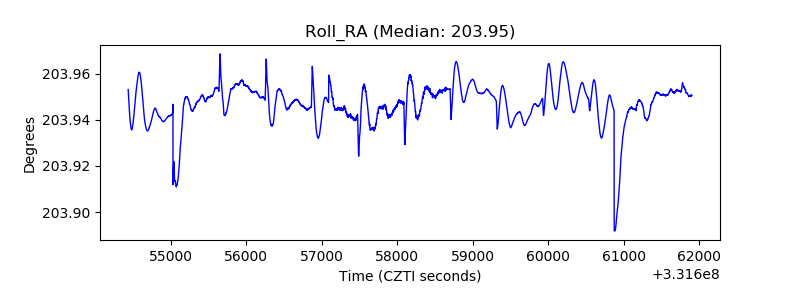 |
| Veto Counter | 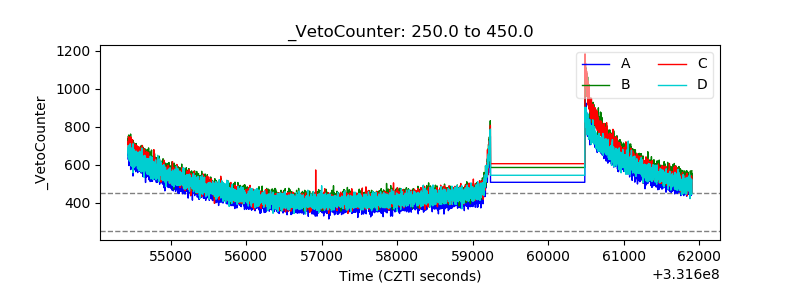 |