| Param | Original file | Final file |
|---|---|---|
| Filename | modeM0/AS1A07_068T01_9000003756_25793cztM0_level2.evt | modeM0/AS1A07_068T01_9000003756_25793cztM0_level2_quad_clean.evt |
| Size (bytes) | 721,238,400 | 91,984,320 |
| Size | 687.8 MB | 87.7 MB |
| Events in quadrant A | 9,179,145 | 532,641 |
| Events in quadrant B | 3,274,154 | 652,507 |
| Events in quadrant C | 3,219,955 | 601,357 |
| Events in quadrant D | 5,757,684 | 572,582 |
| Mode M0 | |||
|---|---|---|---|
| Quadrant | BADHDUFLAG | Total packets | Discarded packets |
| A | 0 | 31330 | 0 |
| B | 0 | 13551 | 0 |
| C | 0 | 13414 | 0 |
| D | 0 | 21401 | 0 |
| Mode M9 | |||
|---|---|---|---|
| Quadrant | BADHDUFLAG | Total packets | Discarded packets |
| A | 0 | 13 | 0 |
| B | 0 | 13 | 0 |
| C | 0 | 13 | 0 |
| D | 0 | 13 | 0 |
| Quadrant | Total seconds | Saturated seconds | Saturation percentage |
|---|---|---|---|
| A | 6091 | 2444 | 40.124774% |
| B | 6091 | 47 | 0.771630% |
| C | 6092 | 78 | 1.280368% |
| D | 6092 | 340 | 5.581090% |
Noise dominated data is calculated using 1-second bins in cleaned event files. If a bin has >2000 counts, and if more than 50% of those come from <1% of pixels, then it is considered to be noise-dominated and hence unusable.
| Quadrant | # 1 sec bins | Bins with >0 counts | Bins with >2000 counts | High rate bins dominated by noise | Noise dominated (total time) | Noise dominated (detector-on time) | Marked lightcurve |
|---|---|---|---|---|---|---|---|
| A | 7431 | 6091 | 2267 | 2267 | 30.51% | 37.22% | 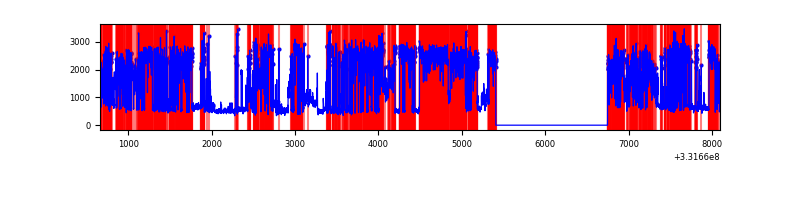 |
| B | 7431 | 6091 | 1 | 1 | 0.01% | 0.02% | 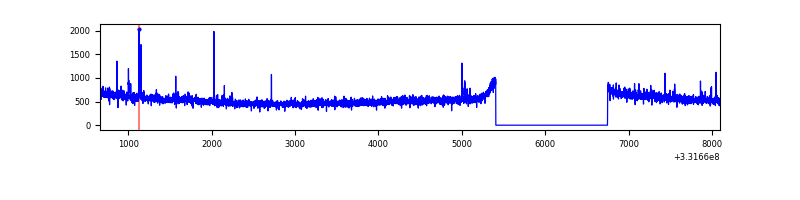 |
| C | 7432 | 6093 | 0 | 0 | 0.00% | 0.00% | 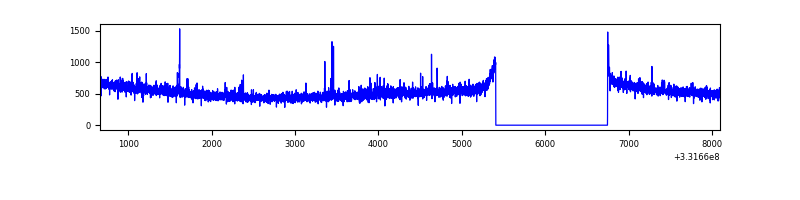 |
| D | 7432 | 6093 | 318 | 318 | 4.28% | 5.22% | 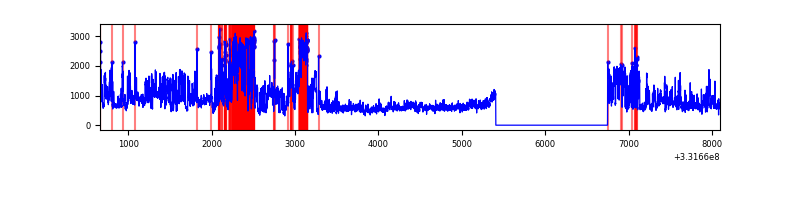 |
Top three noisy pixels from each quadrant. If the there are fewer than three noisy pixels in the level2.evt file, extra rows are filled as -1
| Pixel properties | Quadrant properties | ||||||
|---|---|---|---|---|---|---|---|
| Quadrant | DetID | PixID | Counts | Sigma | Mean | Median | Sigma |
| A | 0 | 13 | 6549257 | 48358.98 | 680 | 670 | 135.4 |
| A | 3 | 1 | 8407 | 57.13 | 680 | 670 | 135.4 |
| A | 13 | 254 | 7464 | 50.17 | 680 | 670 | 135.4 |
| B | 0 | 229 | 27520 | 175.89 | 815 | 798 | 151.9 |
| B | 12 | 111 | 17683 | 111.14 | 815 | 798 | 151.9 |
| B | 0 | 219 | 16671 | 104.48 | 815 | 798 | 151.9 |
| C | 14 | 238 | 126818 | 715.82 | 768 | 775 | 176.1 |
| C | 3 | 233 | 82059 | 461.62 | 768 | 775 | 176.1 |
| C | 1 | 16 | 7587 | 38.69 | 768 | 775 | 176.1 |
| D | 1 | 52 | 1710076 | 9195.98 | 767 | 750 | 185.9 |
| D | 7 | 80 | 727134 | 3907.86 | 767 | 750 | 185.9 |
| D | 8 | 195 | 252629 | 1355.08 | 767 | 750 | 185.9 |
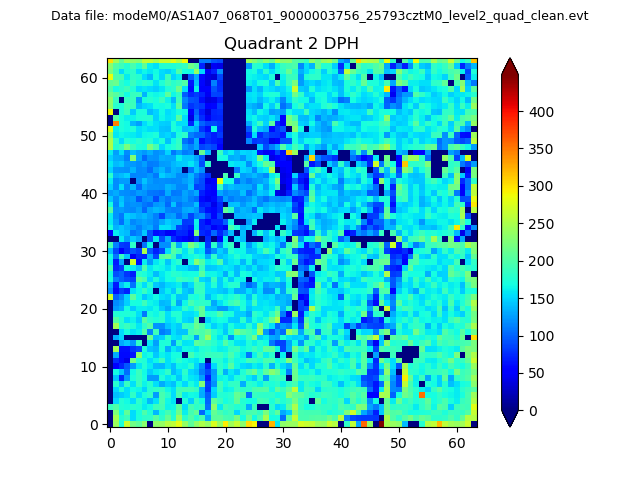
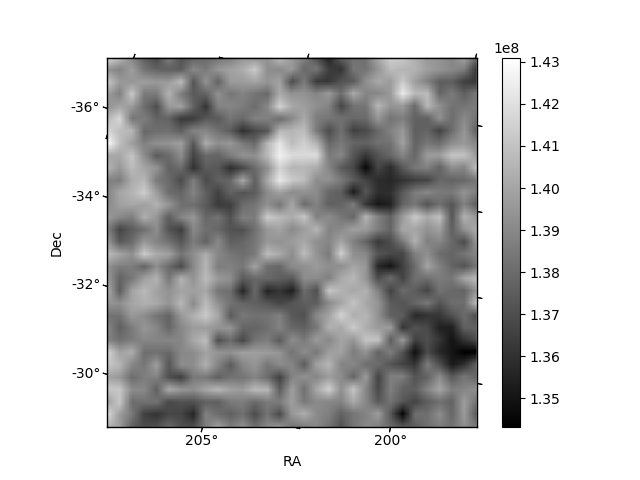
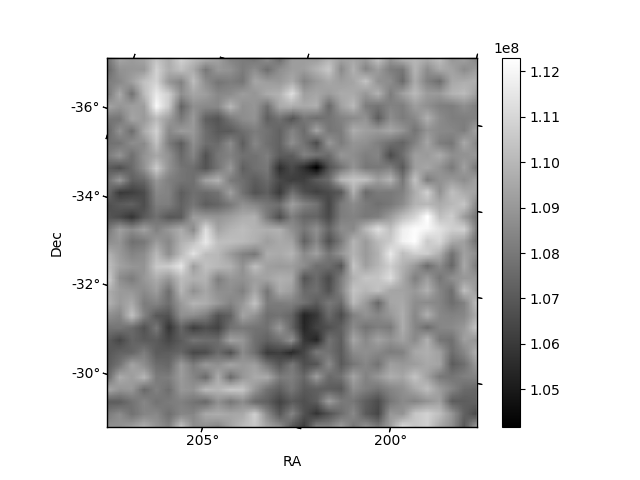
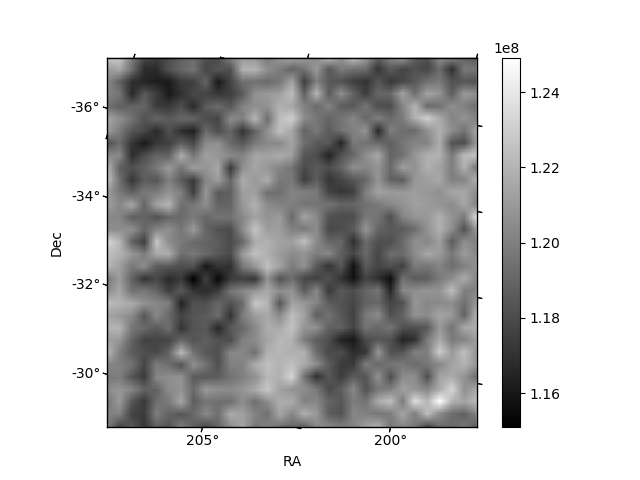
Histogram calculated using DETX and DETY for each event in the final _common_clean file
| Quadrant A | 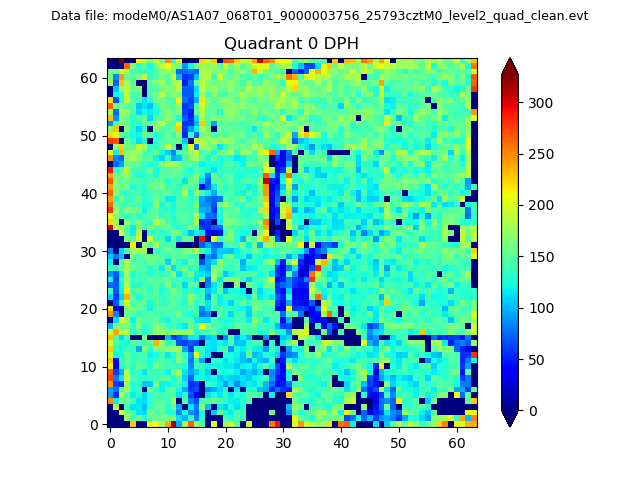 |
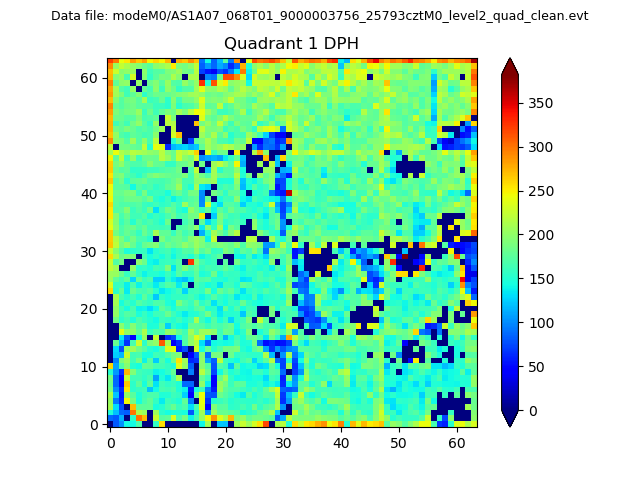 |
Quadrant B |
|---|---|---|---|
| Quadrant D | 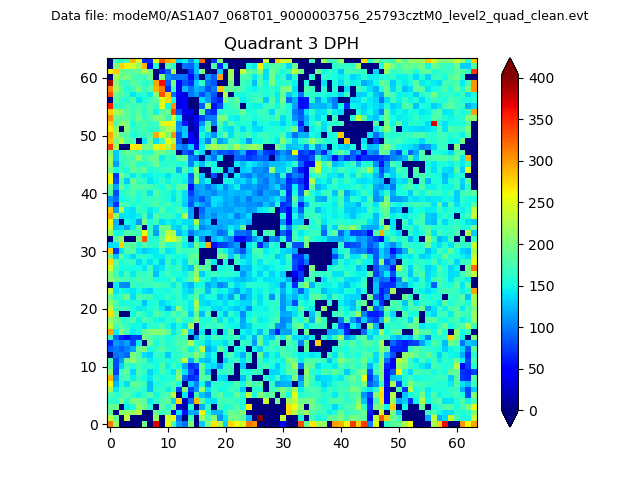 |
 |
Quadrant C |
| Plot type | Count rate plots | Images |
|---|---|---|
| Comparison with Poisson distribution Blue bars denote a histogram of data divided into 1 sec bins. Red curve is a Poisson curve with rate = median count rate of data. |
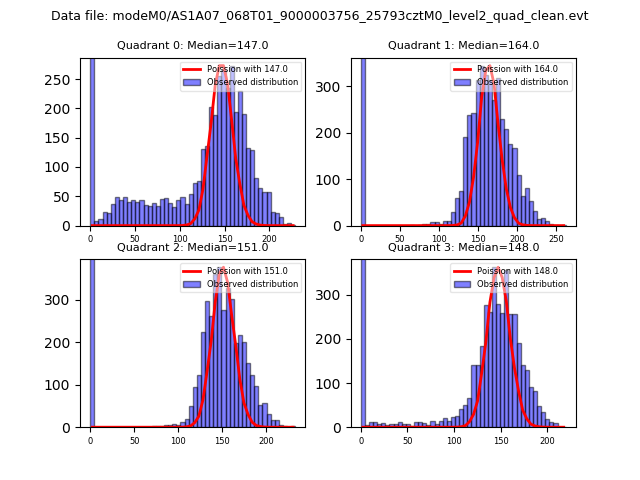 |
 |
| Quadrant-wise count rates Data is divided into 100 sec bins |
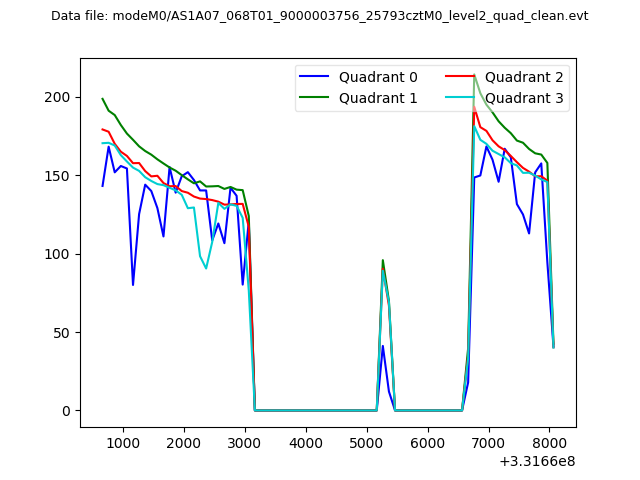 |
|
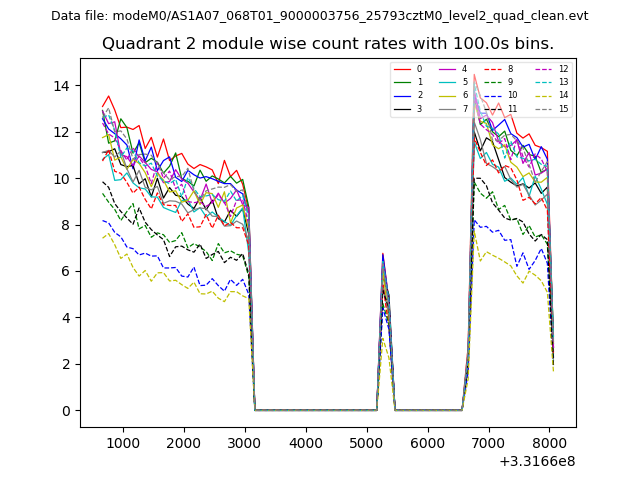
| Module-wise count rates for Quadrant A Data is divided into 100 sec bins |
 |
 |
| Module-wise count rates for Quadrant B Data is divided into 100 sec bins |
 |
 |
| Module-wise count rates for Quadrant C Data is divided into 100 sec bins |
 |
 |
| Module-wise count rates for Quadrant D Data is divided into 100 sec bins |
 |
 |
| Parameter | Plot |
|---|---|
| CZT HV Monitor |  |
| D_VDD | 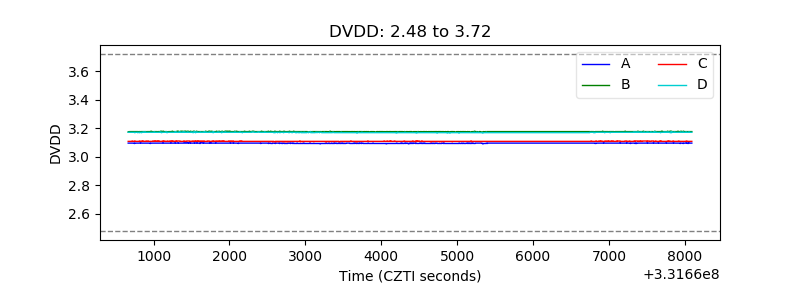 |
| Temperature 1 | 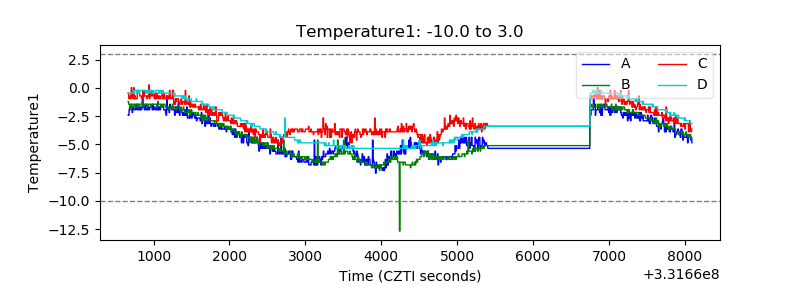 |
| Veto HV Monitor |  |
| Veto LLD | 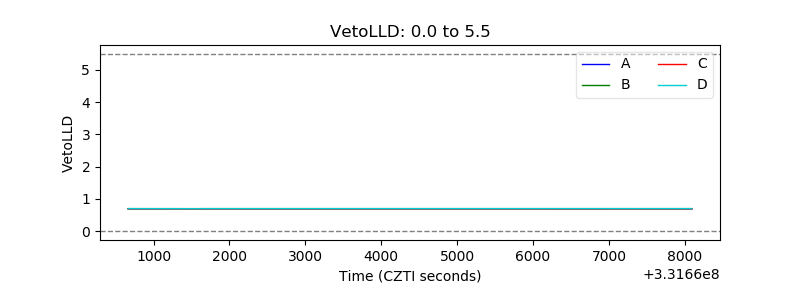 |
| Alpha Counter | 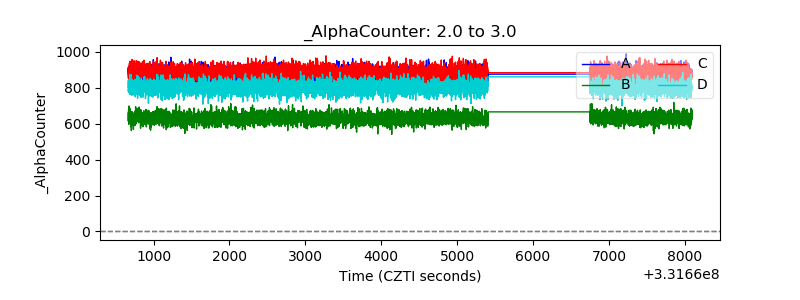 |
| _CPM_Rate | 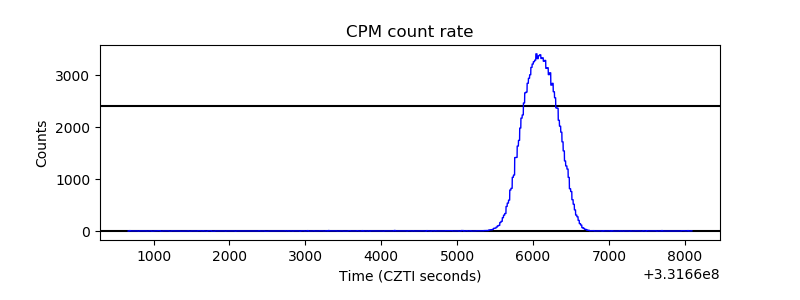 |
| CZT Counter | 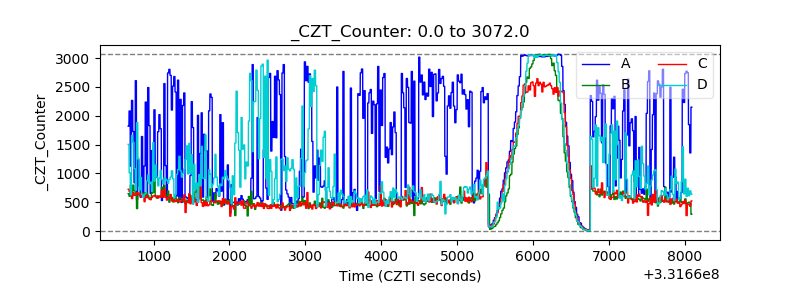 |
| +2.5 Volts monitor | 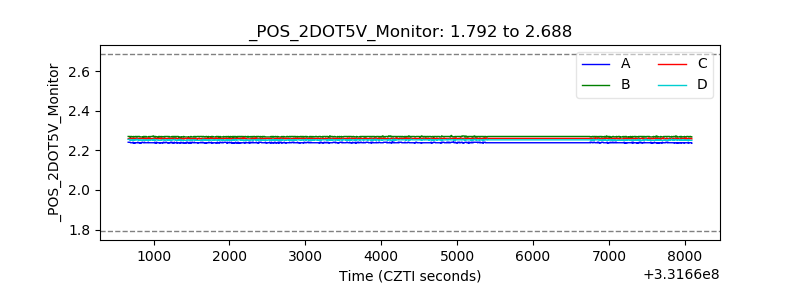 |
| +5 Volts monitor |  |
| _ROLL_ROT | 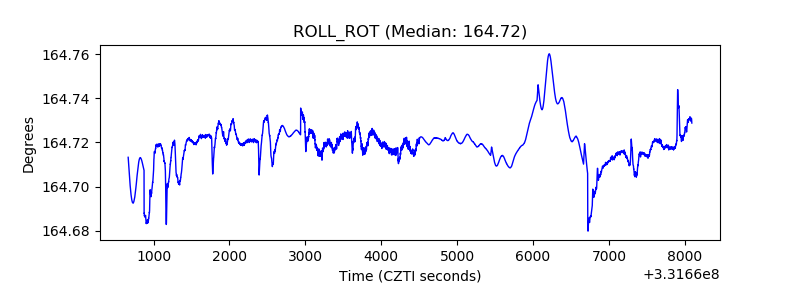 |
| _Roll_DEC | 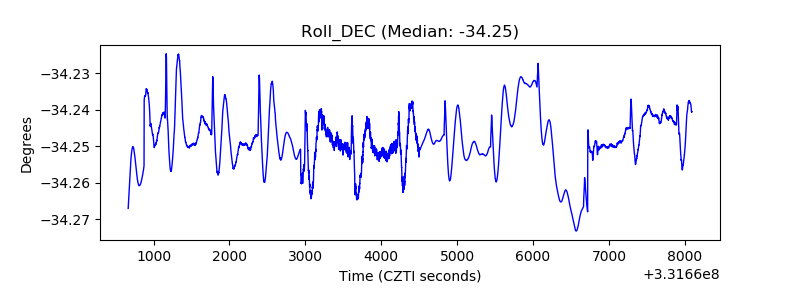 |
| _Roll_RA |  |
| Veto Counter | 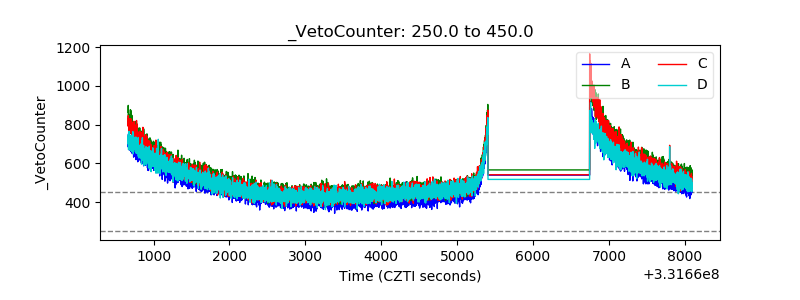 |