| Param | Original file | Final file |
|---|---|---|
| Filename | modeM0/AS1A07_068T01_9000003756_25794cztM0_level2.evt | modeM0/AS1A07_068T01_9000003756_25794cztM0_level2_quad_clean.evt |
| Size (bytes) | 519,626,880 | 96,108,480 |
| Size | 495.6 MB | 91.7 MB |
| Events in quadrant A | 4,616,041 | 611,399 |
| Events in quadrant B | 3,294,041 | 663,663 |
| Events in quadrant C | 3,178,423 | 610,146 |
| Events in quadrant D | 4,235,034 | 599,359 |
| Mode M0 | |||
|---|---|---|---|
| Quadrant | BADHDUFLAG | Total packets | Discarded packets |
| A | 0 | 17623 | 0 |
| B | 0 | 13543 | 0 |
| C | 0 | 13199 | 0 |
| D | 0 | 16743 | 0 |
| Mode M9 | |||
|---|---|---|---|
| Quadrant | BADHDUFLAG | Total packets | Discarded packets |
| A | 0 | 14 | 0 |
| B | 0 | 14 | 0 |
| C | 0 | 14 | 0 |
| D | 0 | 14 | 0 |
| Quadrant | Total seconds | Saturated seconds | Saturation percentage |
|---|---|---|---|
| A | 6104 | 546 | 8.944954% |
| B | 6104 | 55 | 0.901048% |
| C | 6105 | 85 | 1.392301% |
| D | 6105 | 74 | 1.212121% |
Noise dominated data is calculated using 1-second bins in cleaned event files. If a bin has >2000 counts, and if more than 50% of those come from <1% of pixels, then it is considered to be noise-dominated and hence unusable.
| Quadrant | # 1 sec bins | Bins with >0 counts | Bins with >2000 counts | High rate bins dominated by noise | Noise dominated (total time) | Noise dominated (detector-on time) | Marked lightcurve |
|---|---|---|---|---|---|---|---|
| A | 7469 | 6105 | 442 | 442 | 5.92% | 7.24% | 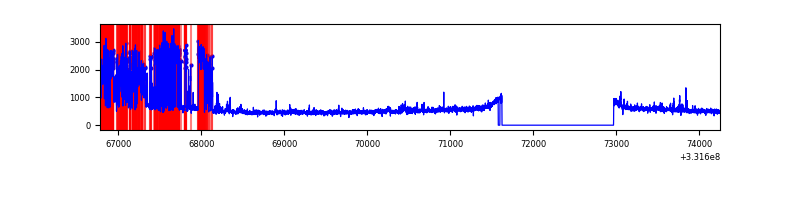 |
| B | 7469 | 6104 | 1 | 1 | 0.01% | 0.02% | 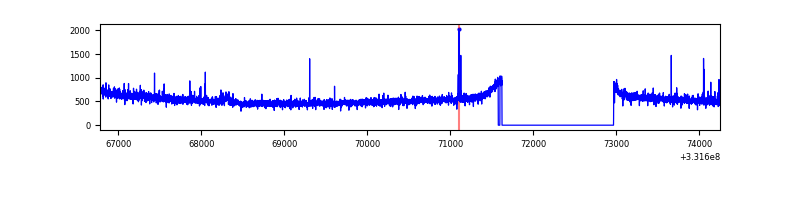 |
| C | 7470 | 6105 | 0 | 0 | 0.00% | 0.00% | 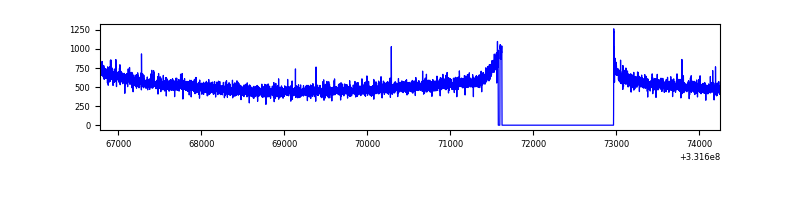 |
| D | 7470 | 6106 | 13 | 13 | 0.17% | 0.21% | 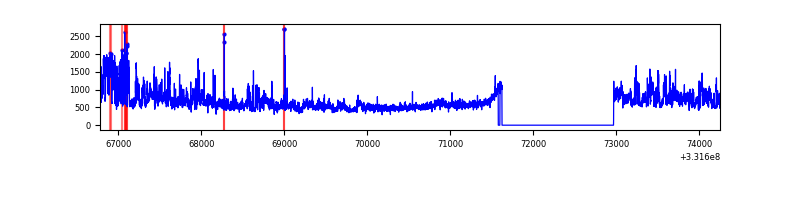 |
Top three noisy pixels from each quadrant. If the there are fewer than three noisy pixels in the level2.evt file, extra rows are filled as -1
| Pixel properties | Quadrant properties | ||||||
|---|---|---|---|---|---|---|---|
| Quadrant | DetID | PixID | Counts | Sigma | Mean | Median | Sigma |
| A | 0 | 13 | 1523276 | 9455.49 | 803 | 789 | 161.0 |
| A | 13 | 254 | 8534 | 48.1 | 803 | 789 | 161.0 |
| A | 0 | 226 | 7076 | 39.05 | 803 | 789 | 161.0 |
| B | 0 | 229 | 29406 | 185.47 | 823 | 806 | 154.2 |
| B | 0 | 219 | 22388 | 139.96 | 823 | 806 | 154.2 |
| B | 12 | 111 | 17870 | 110.66 | 823 | 806 | 154.2 |
| C | 14 | 238 | 127528 | 706.34 | 775 | 781 | 179.4 |
| C | 3 | 233 | 23706 | 127.76 | 775 | 781 | 179.4 |
| C | 1 | 16 | 5271 | 25.02 | 775 | 781 | 179.4 |
| D | 1 | 52 | 991996 | 5162.66 | 784 | 768 | 192.0 |
| D | 7 | 80 | 162833 | 844.09 | 784 | 768 | 192.0 |
| D | 8 | 195 | 90269 | 466.15 | 784 | 768 | 192.0 |
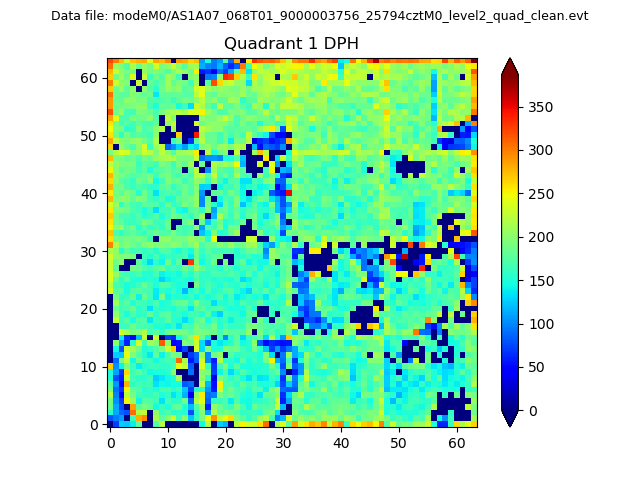
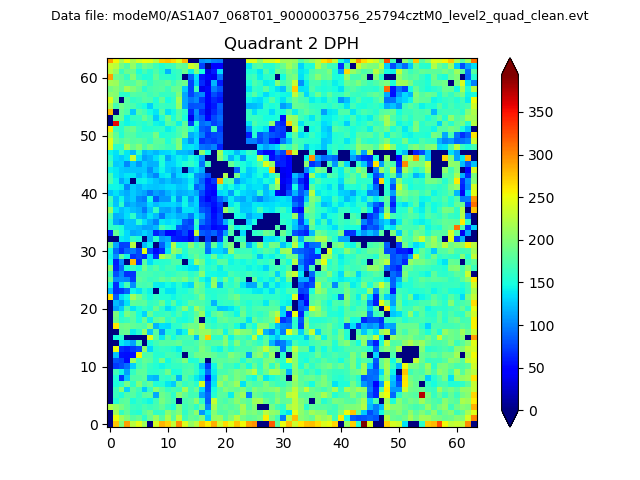
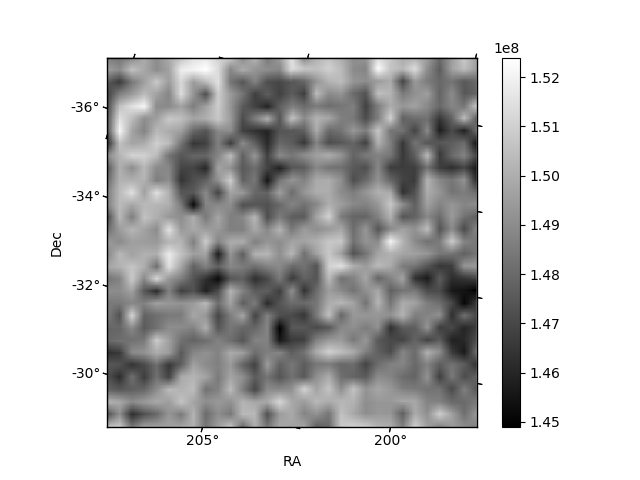
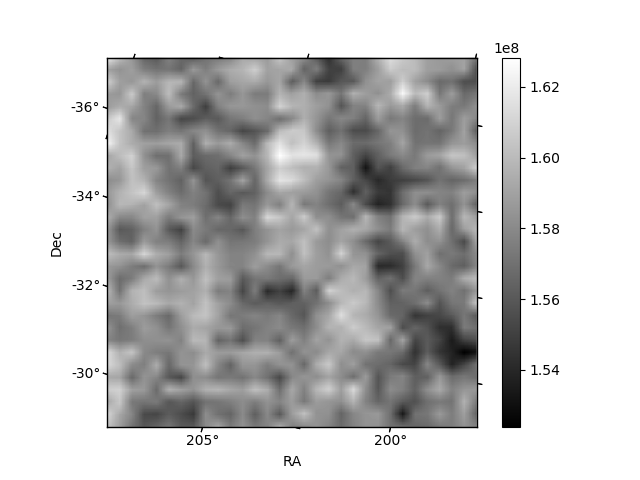
Histogram calculated using DETX and DETY for each event in the final _common_clean file
| Quadrant A |  |
 |
Quadrant B |
|---|---|---|---|
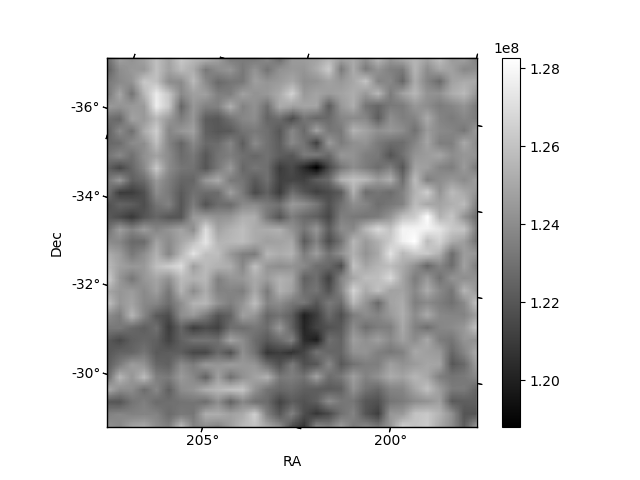
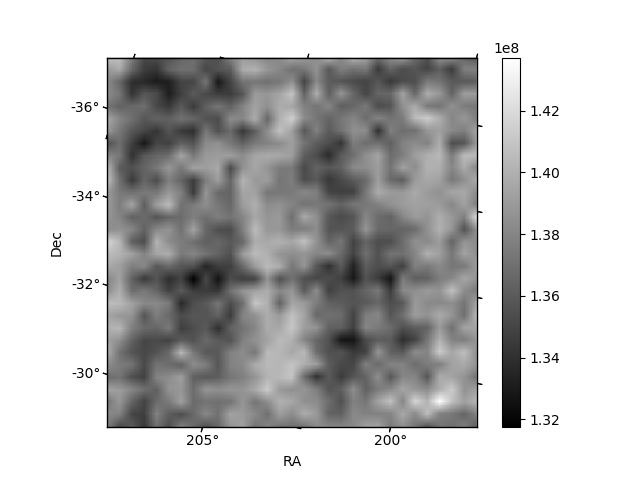
| Quadrant D | 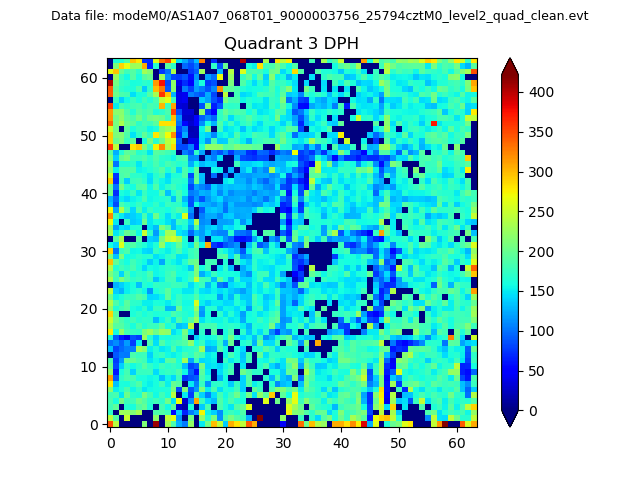 |
 |
Quadrant C |
| Plot type | Count rate plots | Images |
|---|---|---|
| Comparison with Poisson distribution Blue bars denote a histogram of data divided into 1 sec bins. Red curve is a Poisson curve with rate = median count rate of data. |
 |
 |
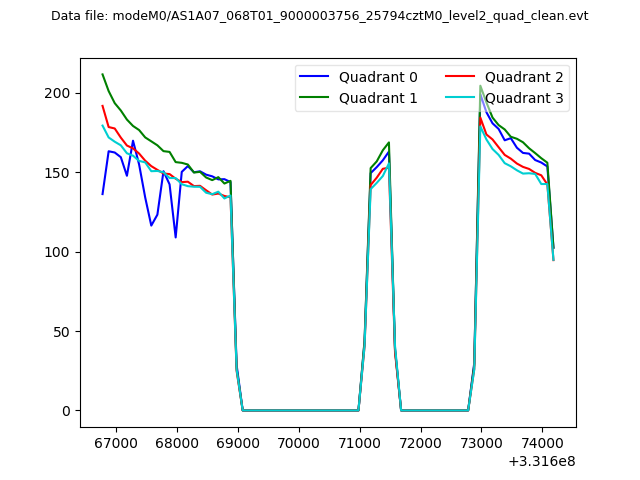
| Quadrant-wise count rates Data is divided into 100 sec bins |
 |
|
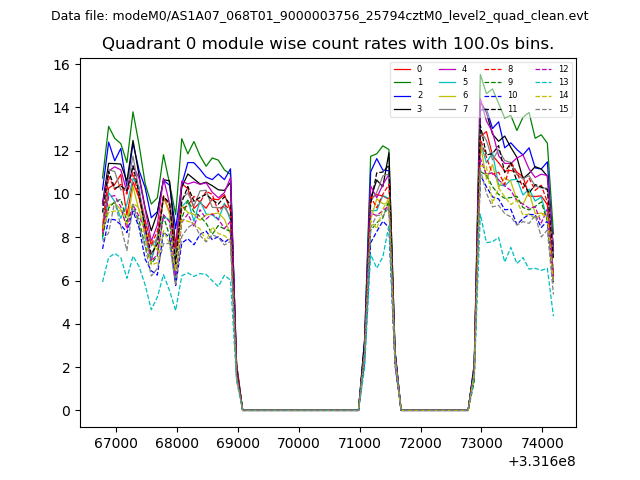
| Module-wise count rates for Quadrant A Data is divided into 100 sec bins |
 |
 |
| Module-wise count rates for Quadrant B Data is divided into 100 sec bins |
 |
 |
| Module-wise count rates for Quadrant C Data is divided into 100 sec bins |
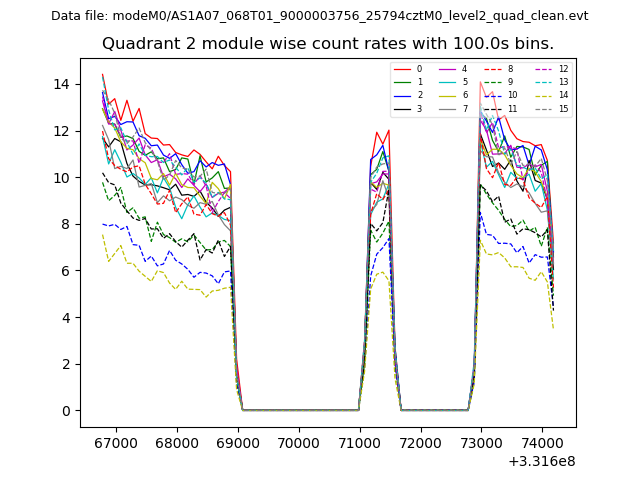 |
 |
| Module-wise count rates for Quadrant D Data is divided into 100 sec bins |
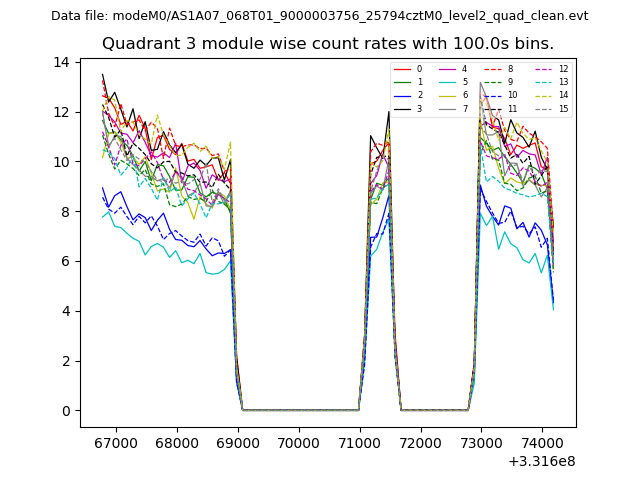 |
 |
| Parameter | Plot |
|---|---|
| CZT HV Monitor | 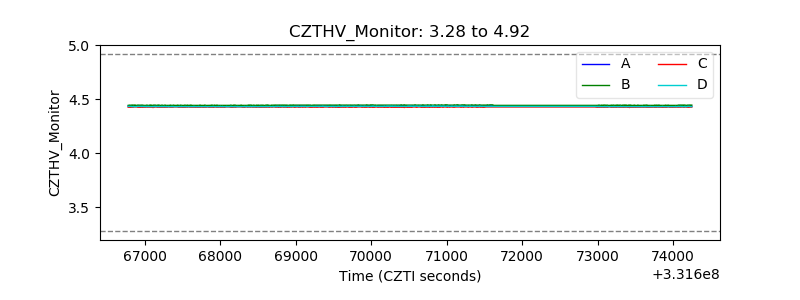 |
| D_VDD | 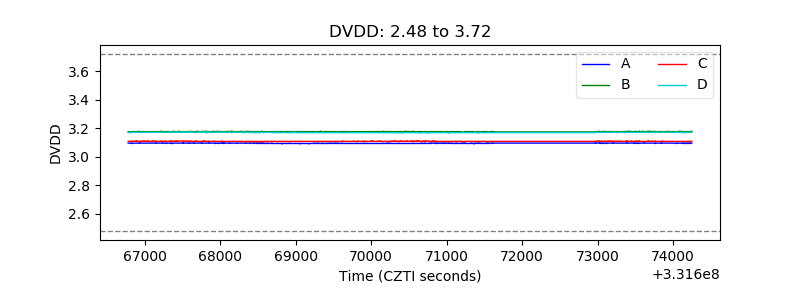 |
| Temperature 1 | 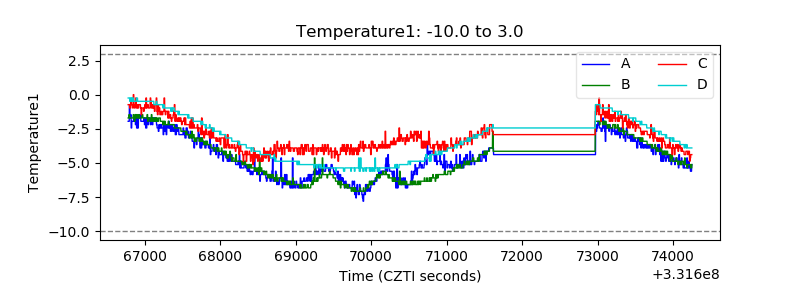 |
| Veto HV Monitor | 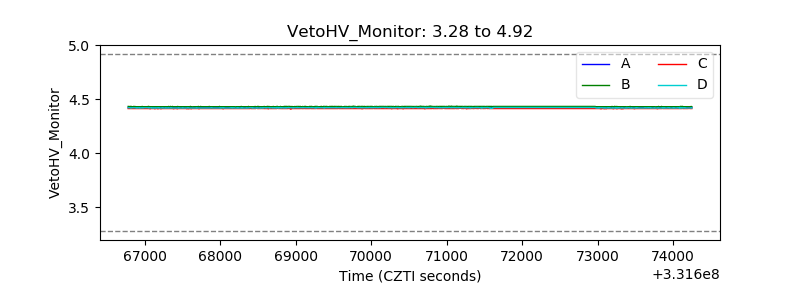 |
| Veto LLD | 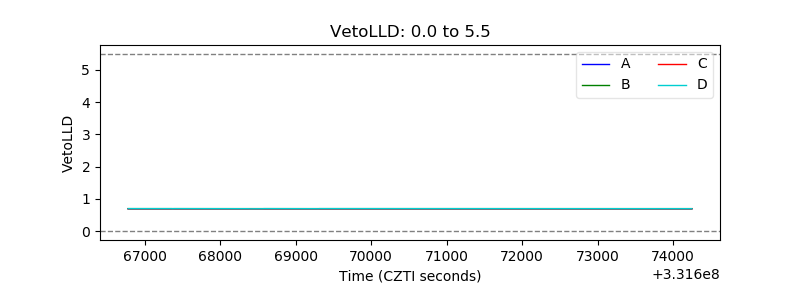 |
| Alpha Counter |  |
| _CPM_Rate | 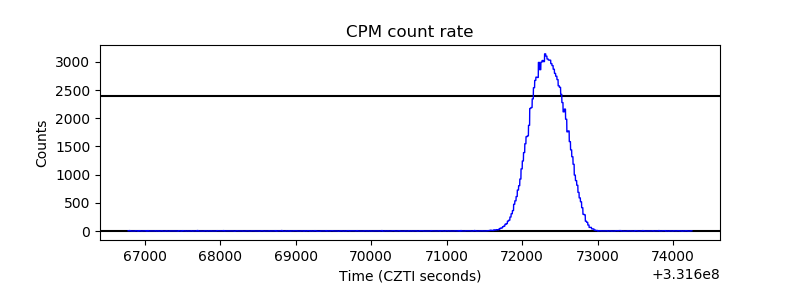 |
| CZT Counter | 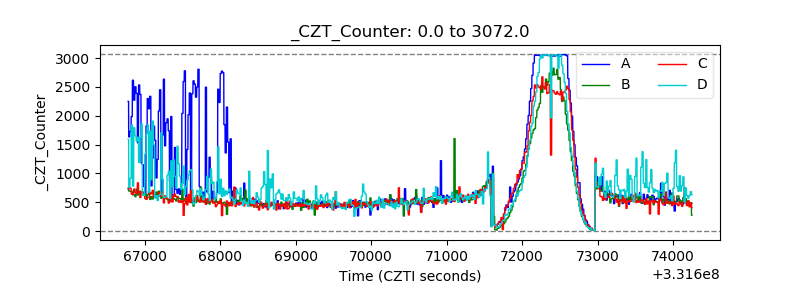 |
| +2.5 Volts monitor |  |
| +5 Volts monitor |  |
| _ROLL_ROT | 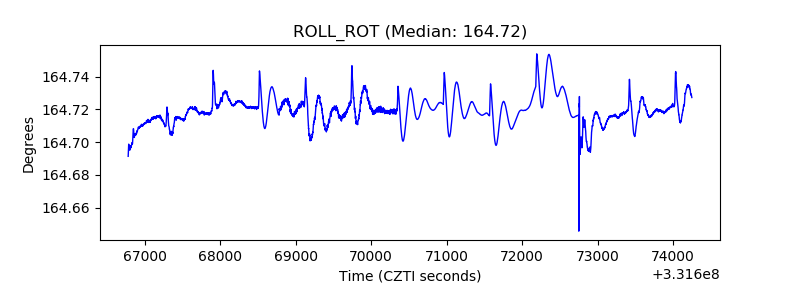 |
| _Roll_DEC | 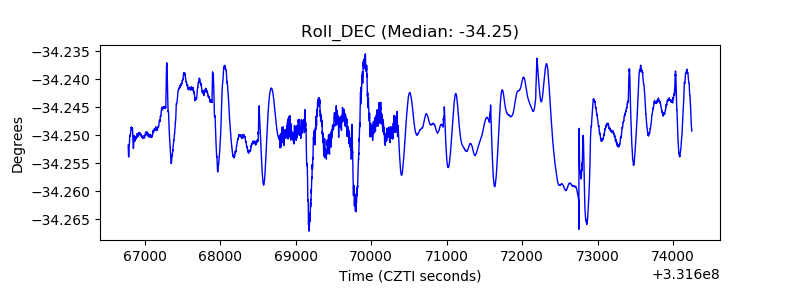 |
| _Roll_RA | 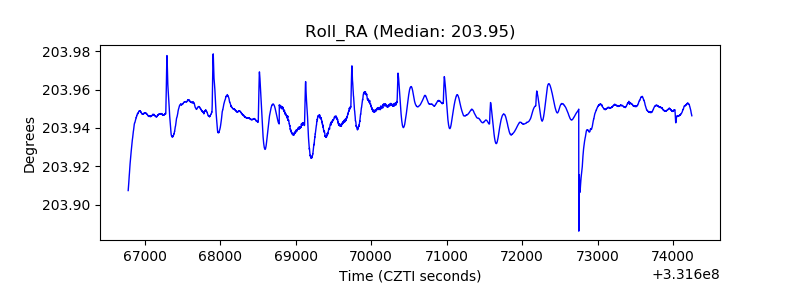 |
| Veto Counter | 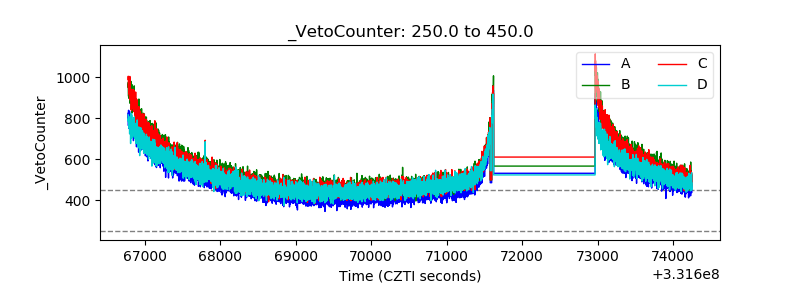 |