| Param | Original file | Final file |
|---|---|---|
| Filename | modeM0/AS1A07_068T01_9000003756_25796cztM0_level2.evt | modeM0/AS1A07_068T01_9000003756_25796cztM0_level2_quad_clean.evt |
| Size (bytes) | 487,321,920 | 90,694,080 |
| Size | 464.7 MB | 86.5 MB |
| Events in quadrant A | 3,525,272 | 584,918 |
| Events in quadrant B | 3,288,410 | 602,566 |
| Events in quadrant C | 3,211,799 | 564,864 |
| Events in quadrant D | 4,293,135 | 541,894 |
| Mode M0 | |||
|---|---|---|---|
| Quadrant | BADHDUFLAG | Total packets | Discarded packets |
| A | 0 | 14545 | 0 |
| B | 0 | 13744 | 0 |
| C | 0 | 13577 | 0 |
| D | 0 | 17093 | 0 |
| Mode M9 | |||
|---|---|---|---|
| Quadrant | BADHDUFLAG | Total packets | Discarded packets |
| A | 0 | 16 | 0 |
| B | 0 | 17 | 0 |
| C | 0 | 17 | 0 |
| D | 0 | 17 | 0 |
| Quadrant | Total seconds | Saturated seconds | Saturation percentage |
|---|---|---|---|
| A | 6479 | 178 | 2.747338% |
| B | 6479 | 40 | 0.617379% |
| C | 6479 | 65 | 1.003241% |
| D | 6479 | 159 | 2.454082% |
Noise dominated data is calculated using 1-second bins in cleaned event files. If a bin has >2000 counts, and if more than 50% of those come from <1% of pixels, then it is considered to be noise-dominated and hence unusable.
| Quadrant | # 1 sec bins | Bins with >0 counts | Bins with >2000 counts | High rate bins dominated by noise | Noise dominated (total time) | Noise dominated (detector-on time) | Marked lightcurve |
|---|---|---|---|---|---|---|---|
| A | 7624 | 6479 | 69 | 69 | 0.91% | 1.06% | 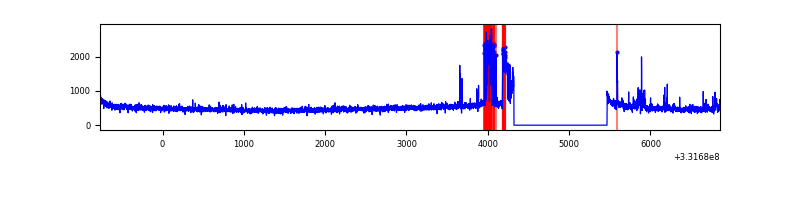 |
| B | 7624 | 6480 | 3 | 3 | 0.04% | 0.05% | 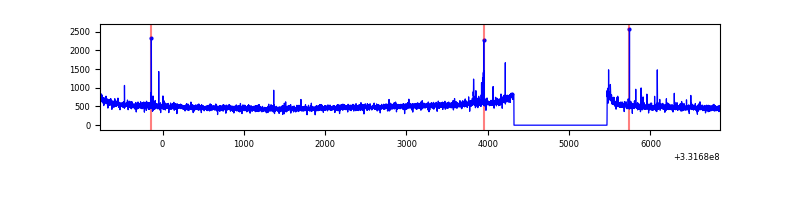 |
| C | 7624 | 6480 | 0 | 0 | 0.00% | 0.00% | 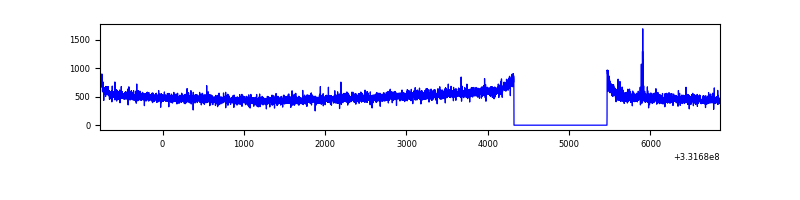 |
| D | 7624 | 6479 | 131 | 131 | 1.72% | 2.02% | 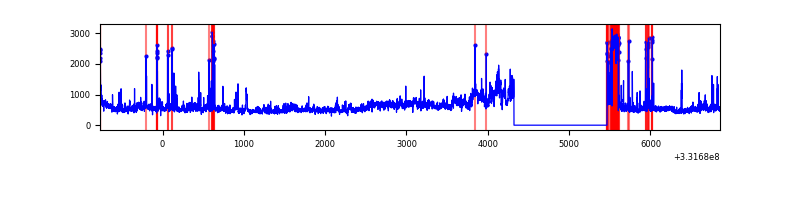 |
Top three noisy pixels from each quadrant. If the there are fewer than three noisy pixels in the level2.evt file, extra rows are filled as -1
| Pixel properties | Quadrant properties | ||||||
|---|---|---|---|---|---|---|---|
| Quadrant | DetID | PixID | Counts | Sigma | Mean | Median | Sigma |
| A | 0 | 13 | 365935 | 2208.99 | 819 | 804 | 165.3 |
| A | 13 | 254 | 9788 | 54.35 | 819 | 804 | 165.3 |
| A | 3 | 137 | 7501 | 40.52 | 819 | 804 | 165.3 |
| B | 0 | 219 | 20875 | 127.93 | 823 | 805 | 156.9 |
| B | 12 | 111 | 18964 | 115.75 | 823 | 805 | 156.9 |
| B | 11 | 111 | 16874 | 102.43 | 823 | 805 | 156.9 |
| C | 14 | 238 | 126723 | 689.63 | 784 | 789 | 182.6 |
| C | 3 | 233 | 28022 | 149.13 | 784 | 789 | 182.6 |
| C | 13 | 61 | 5330 | 24.87 | 784 | 789 | 182.6 |
| D | 1 | 52 | 477857 | 2594.26 | 776 | 757 | 183.9 |
| D | 8 | 195 | 430120 | 2334.69 | 776 | 757 | 183.9 |
| D | 13 | 104 | 385137 | 2090.09 | 776 | 757 | 183.9 |
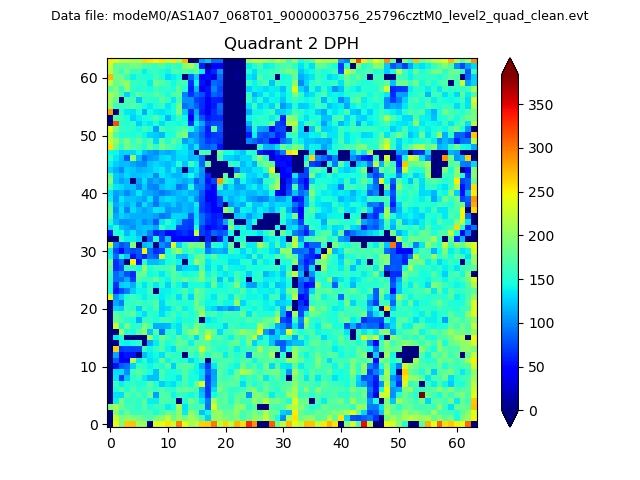
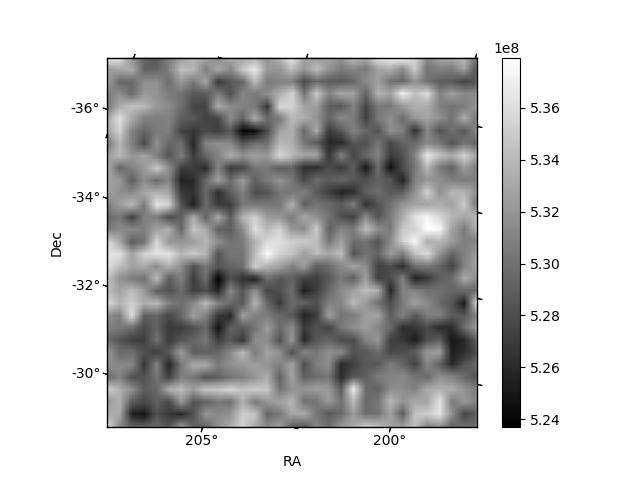
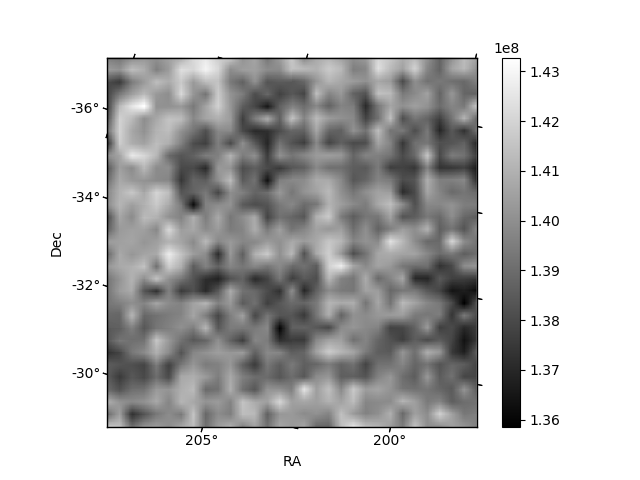
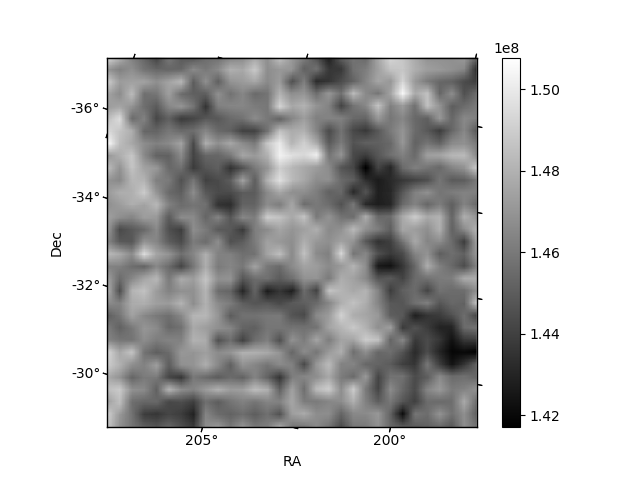
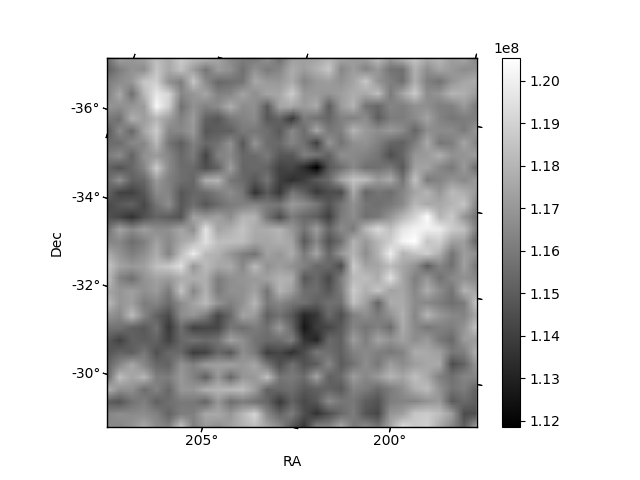
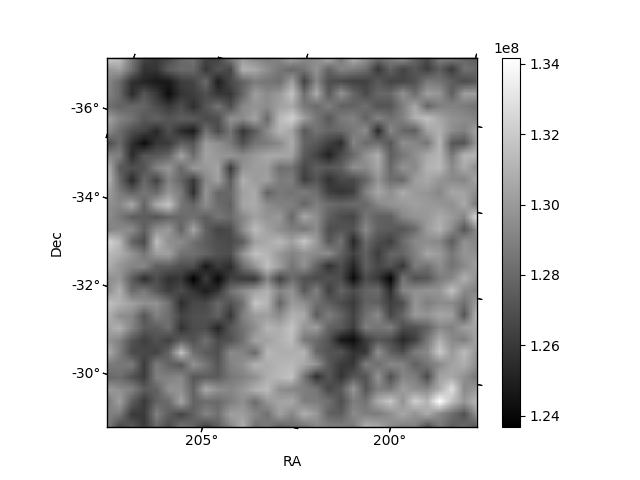
Histogram calculated using DETX and DETY for each event in the final _common_clean file
| Quadrant A | 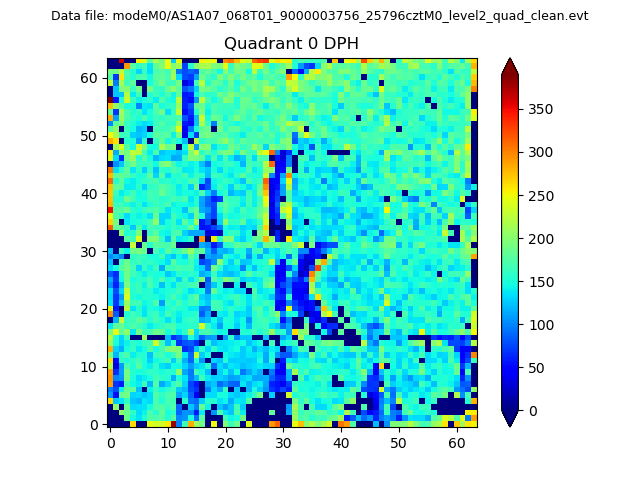 |
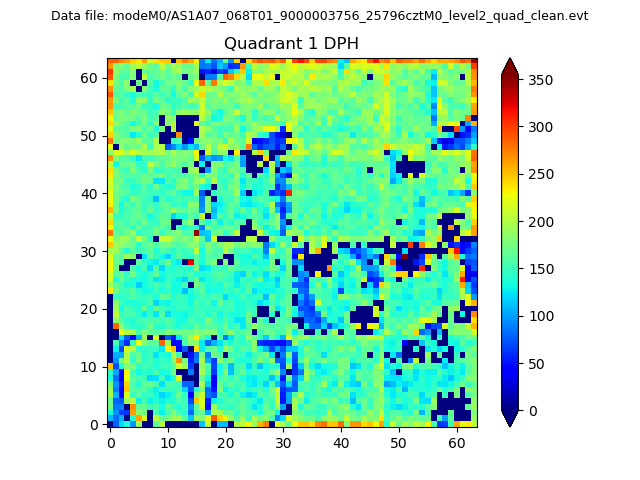 |
Quadrant B |
|---|---|---|---|
| Quadrant D | 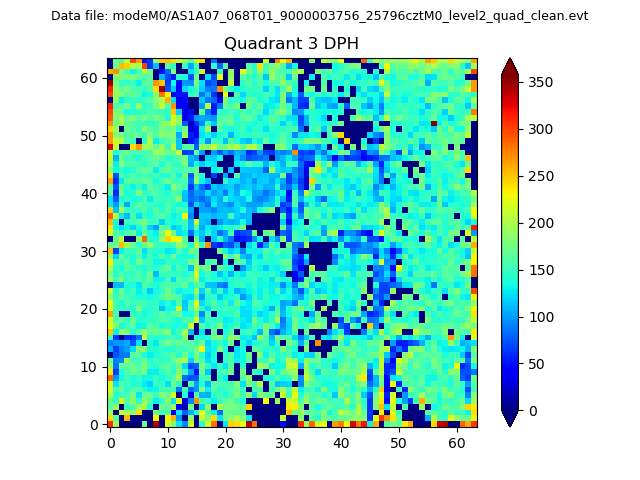 |
 |
Quadrant C |
| Plot type | Count rate plots | Images |
|---|---|---|
| Comparison with Poisson distribution Blue bars denote a histogram of data divided into 1 sec bins. Red curve is a Poisson curve with rate = median count rate of data. |
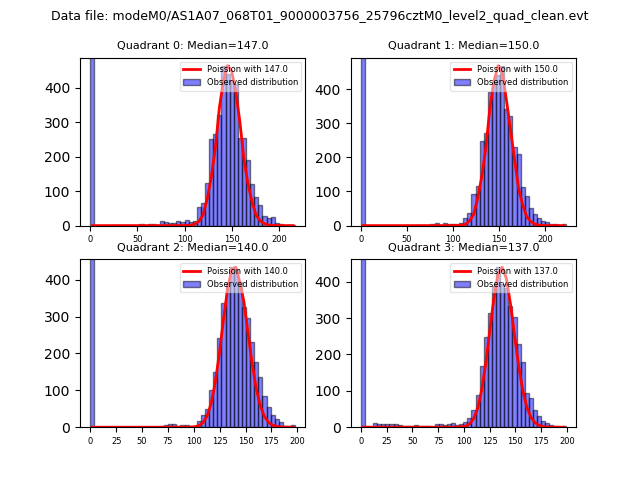 |
 |
| Quadrant-wise count rates Data is divided into 100 sec bins |
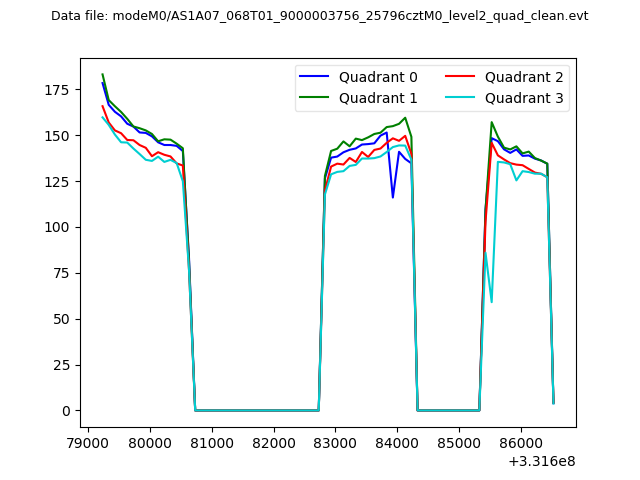 |
|
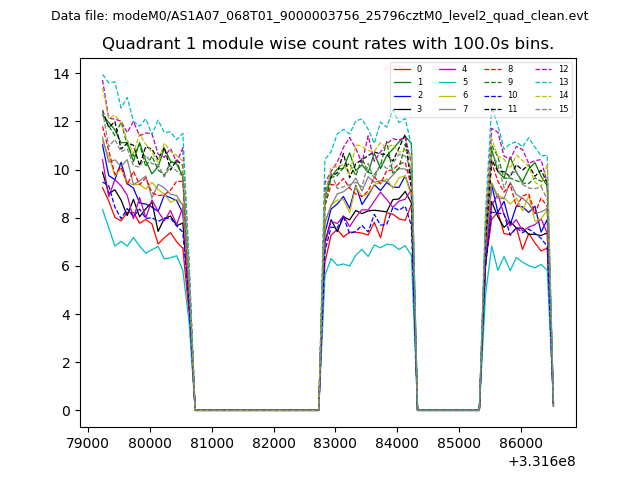
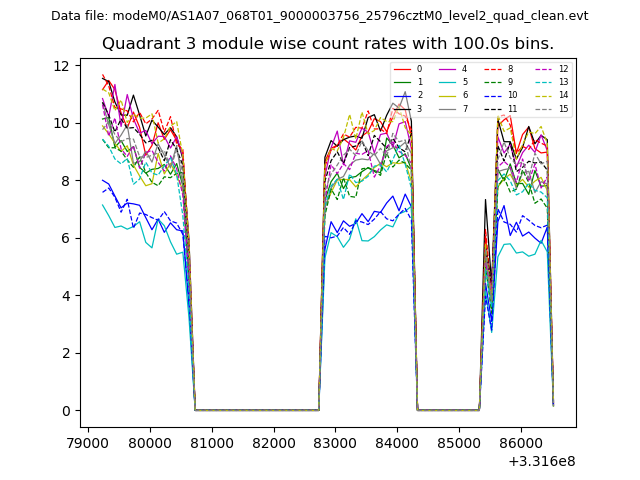
| Module-wise count rates for Quadrant A Data is divided into 100 sec bins |
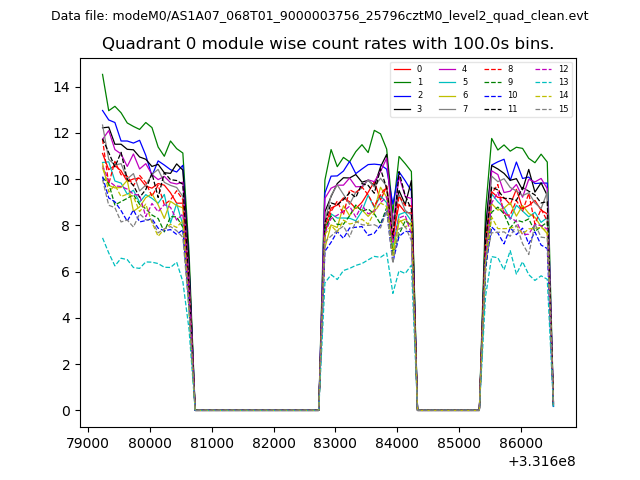 |
 |
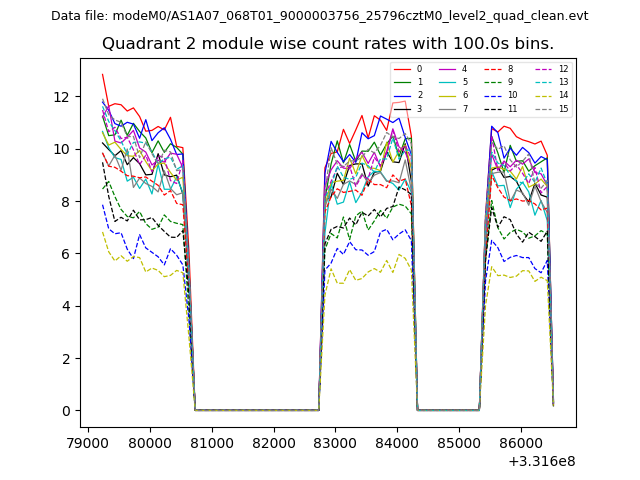
| Module-wise count rates for Quadrant B Data is divided into 100 sec bins |
 |
 |
| Module-wise count rates for Quadrant C Data is divided into 100 sec bins |
 |
 |
| Module-wise count rates for Quadrant D Data is divided into 100 sec bins |
 |
 |
| Parameter | Plot |
|---|---|
| CZT HV Monitor | 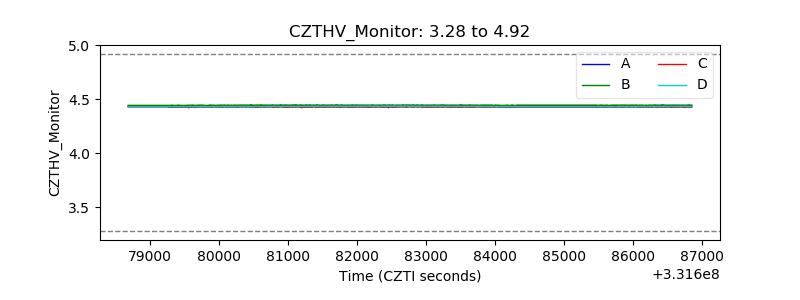 |
| D_VDD | 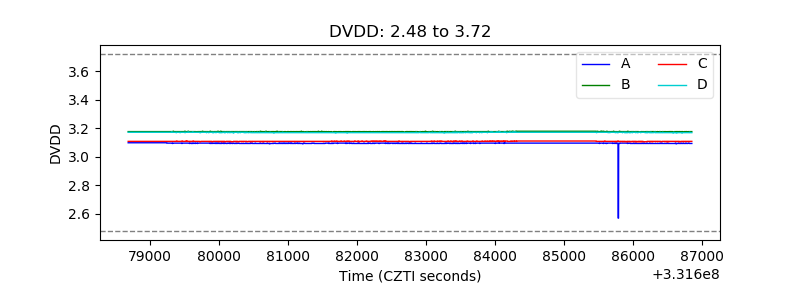 |
| Temperature 1 | 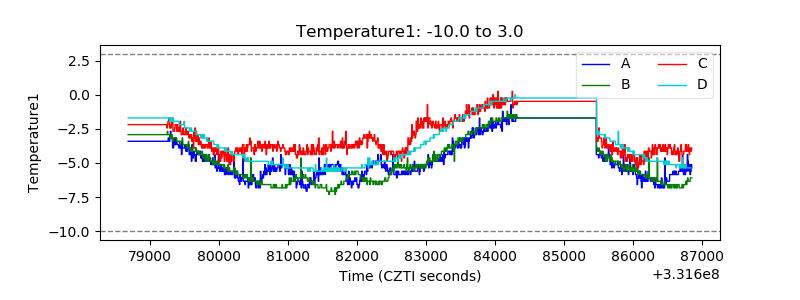 |
| Veto HV Monitor | 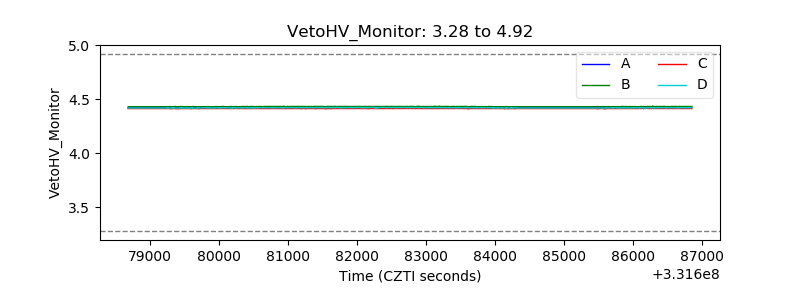 |
| Veto LLD |  |
| Alpha Counter | 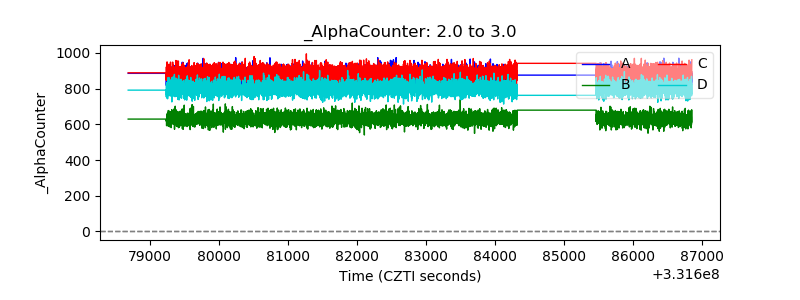 |
| _CPM_Rate | 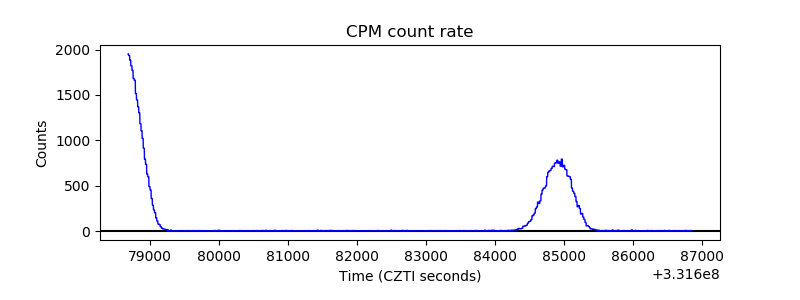 |
| CZT Counter | 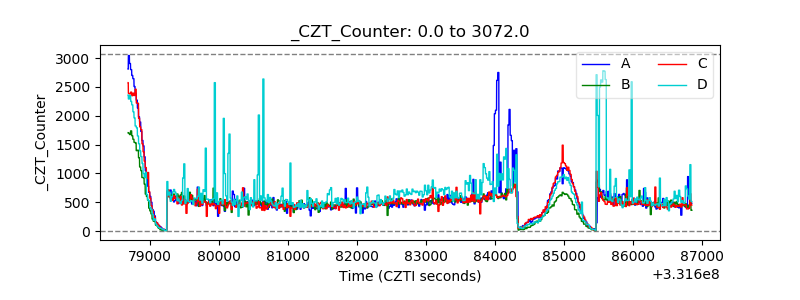 |
| +2.5 Volts monitor | 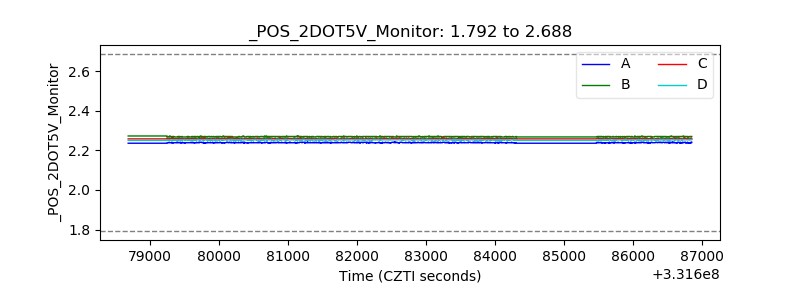 |
| +5 Volts monitor |  |
| _ROLL_ROT | 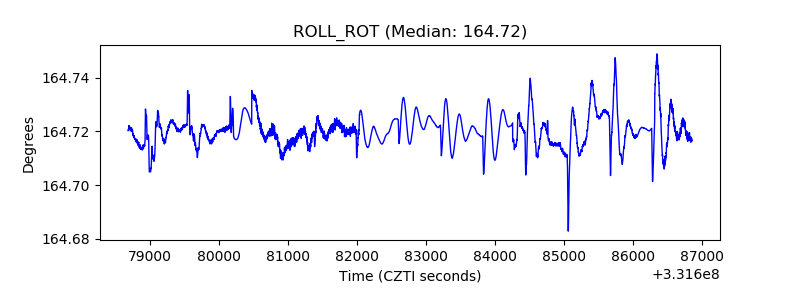 |
| _Roll_DEC | 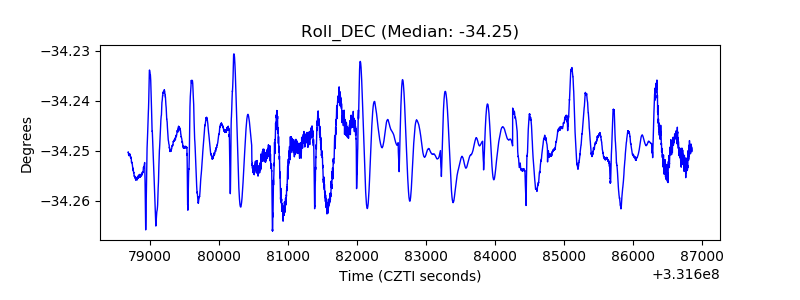 |
| _Roll_RA | 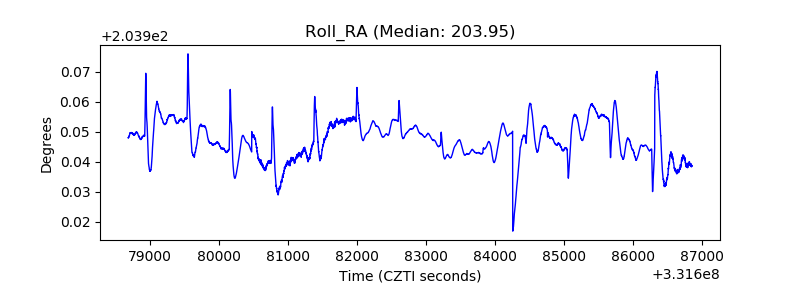 |
| Veto Counter | 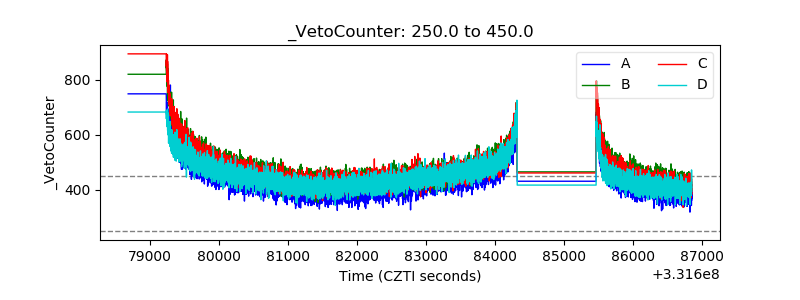 |