| Param | Original file | Final file |
|---|---|---|
| Filename | modeM0/AS1A07_068T01_9000003756_25798cztM0_level2.evt | modeM0/AS1A07_068T01_9000003756_25798cztM0_level2_quad_clean.evt |
| Size (bytes) | 473,711,040 | 74,905,920 |
| Size | 451.8 MB | 71.4 MB |
| Events in quadrant A | 3,524,400 | 460,229 |
| Events in quadrant B | 3,226,032 | 464,668 |
| Events in quadrant C | 3,159,736 | 441,739 |
| Events in quadrant D | 3,981,063 | 434,267 |
| Mode M0 | |||
|---|---|---|---|
| Quadrant | BADHDUFLAG | Total packets | Discarded packets |
| A | 0 | 14520 | 0 |
| B | 0 | 13811 | 0 |
| C | 0 | 13717 | 0 |
| D | 0 | 16197 | 0 |
| Mode M9 | |||
|---|---|---|---|
| Quadrant | BADHDUFLAG | Total packets | Discarded packets |
| A | 0 | 4 | 0 |
| B | 0 | 4 | 0 |
| C | 0 | 4 | 0 |
| D | 0 | 4 | 0 |
| Quadrant | Total seconds | Saturated seconds | Saturation percentage |
|---|---|---|---|
| A | 6703 | 84 | 1.253170% |
| B | 6703 | 59 | 0.880203% |
| C | 6703 | 79 | 1.178577% |
| D | 6703 | 84 | 1.253170% |
Noise dominated data is calculated using 1-second bins in cleaned event files. If a bin has >2000 counts, and if more than 50% of those come from <1% of pixels, then it is considered to be noise-dominated and hence unusable.
| Quadrant | # 1 sec bins | Bins with >0 counts | Bins with >2000 counts | High rate bins dominated by noise | Noise dominated (total time) | Noise dominated (detector-on time) | Marked lightcurve |
|---|---|---|---|---|---|---|---|
| A | 7103 | 6703 | 27 | 27 | 0.38% | 0.40% | 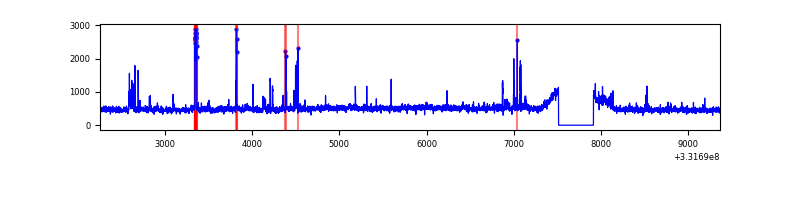 |
| B | 7103 | 6703 | 0 | 0 | 0.00% | 0.00% | 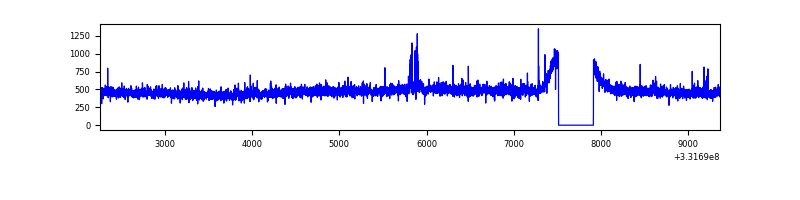 |
| C | 7103 | 6703 | 0 | 0 | 0.00% | 0.00% | 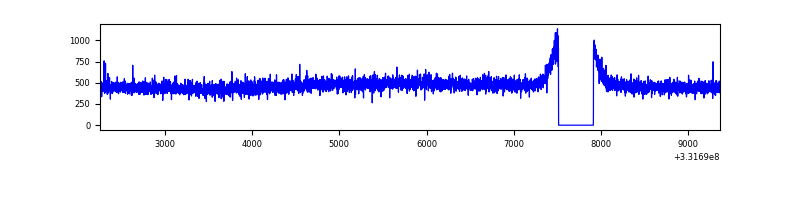 |
| D | 7103 | 6703 | 61 | 61 | 0.86% | 0.91% |  |
Top three noisy pixels from each quadrant. If the there are fewer than three noisy pixels in the level2.evt file, extra rows are filled as -1
| Pixel properties | Quadrant properties | ||||||
|---|---|---|---|---|---|---|---|
| Quadrant | DetID | PixID | Counts | Sigma | Mean | Median | Sigma |
| A | 0 | 13 | 381761 | 2311.04 | 814 | 796 | 164.8 |
| A | 13 | 254 | 9301 | 51.59 | 814 | 796 | 164.8 |
| A | 3 | 137 | 7640 | 41.51 | 814 | 796 | 164.8 |
| B | 0 | 190 | 19613 | 119.26 | 811 | 791 | 157.8 |
| B | 12 | 111 | 19476 | 118.39 | 811 | 791 | 157.8 |
| B | 0 | 219 | 17515 | 105.96 | 811 | 791 | 157.8 |
| C | 14 | 238 | 124528 | 674.25 | 776 | 781 | 183.5 |
| C | 3 | 233 | 10257 | 51.63 | 776 | 781 | 183.5 |
| C | 13 | 61 | 5376 | 25.04 | 776 | 781 | 183.5 |
| D | 8 | 195 | 509219 | 2699.03 | 780 | 760 | 188.4 |
| D | 7 | 80 | 183458 | 969.81 | 780 | 760 | 188.4 |
| D | 13 | 104 | 171227 | 904.88 | 780 | 760 | 188.4 |
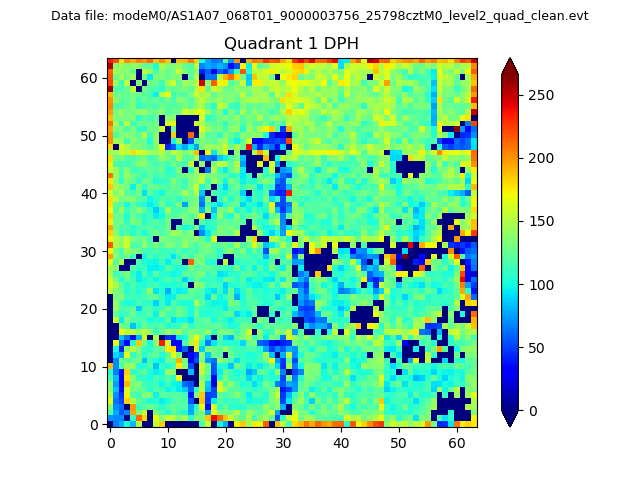
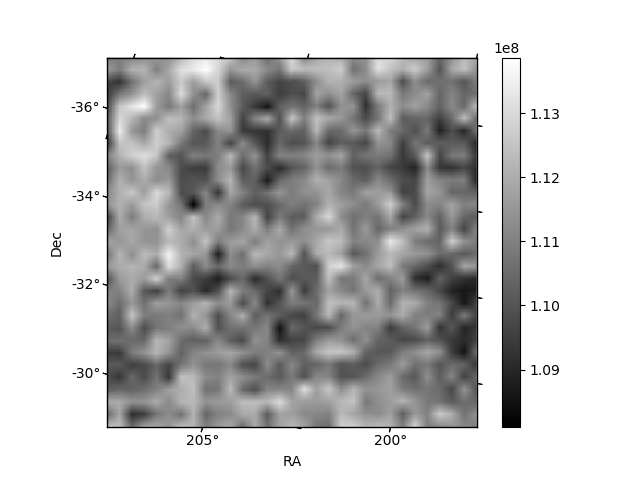
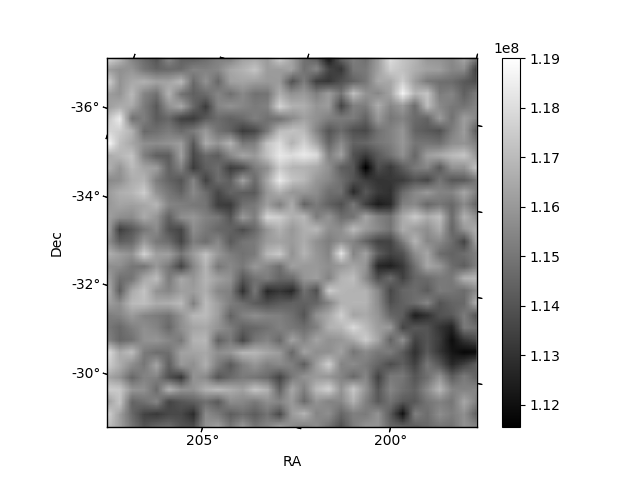
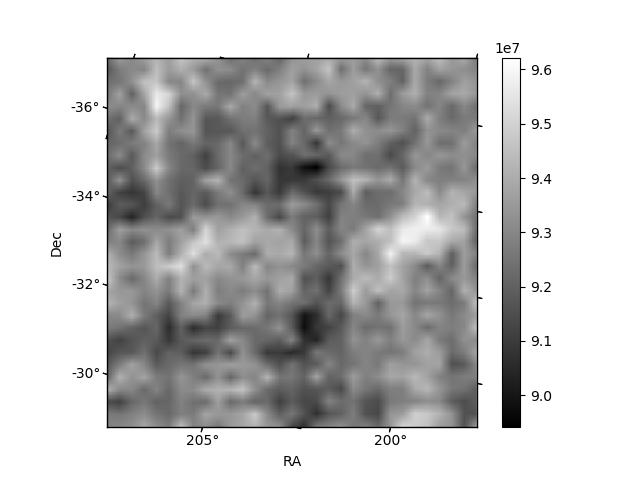
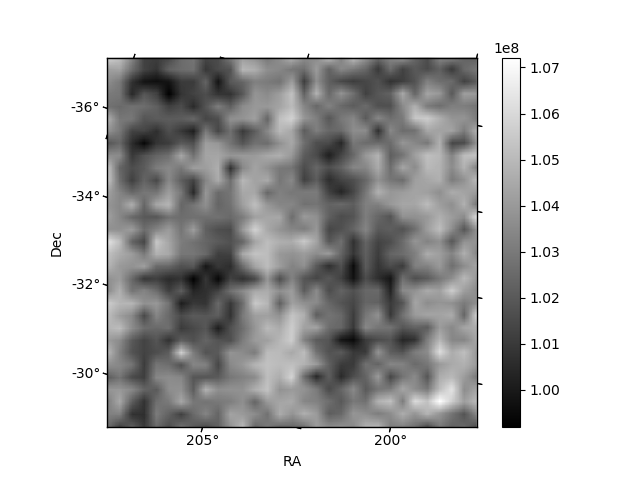
Histogram calculated using DETX and DETY for each event in the final _common_clean file
| Quadrant A | 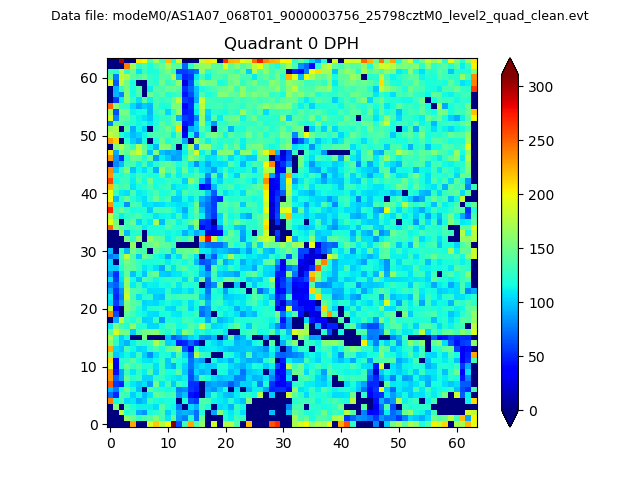 |
 |
Quadrant B |
|---|---|---|---|
| Quadrant D | 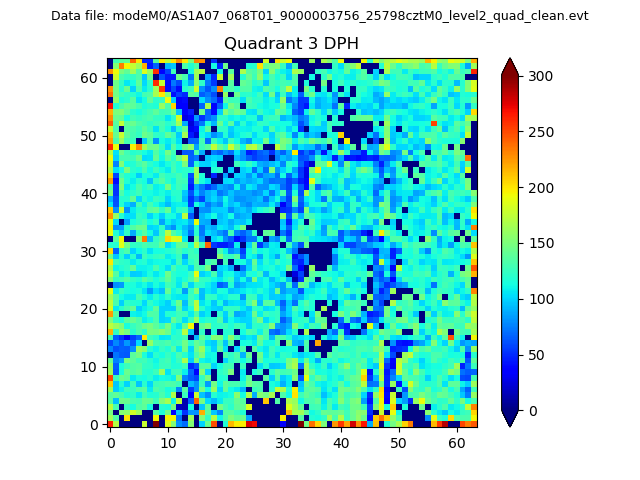 |
 |
Quadrant C |
| Plot type | Count rate plots | Images |
|---|---|---|
| Comparison with Poisson distribution Blue bars denote a histogram of data divided into 1 sec bins. Red curve is a Poisson curve with rate = median count rate of data. |
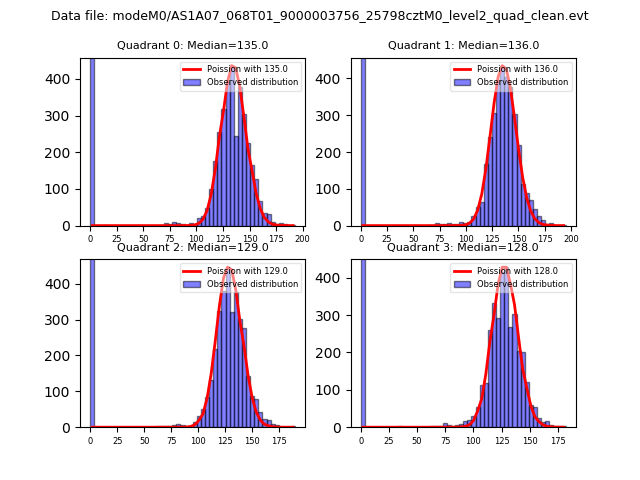 |
 |
| Quadrant-wise count rates Data is divided into 100 sec bins |
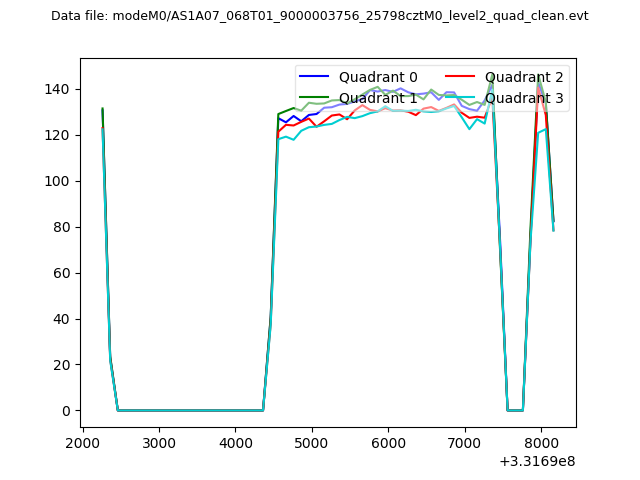 |
|
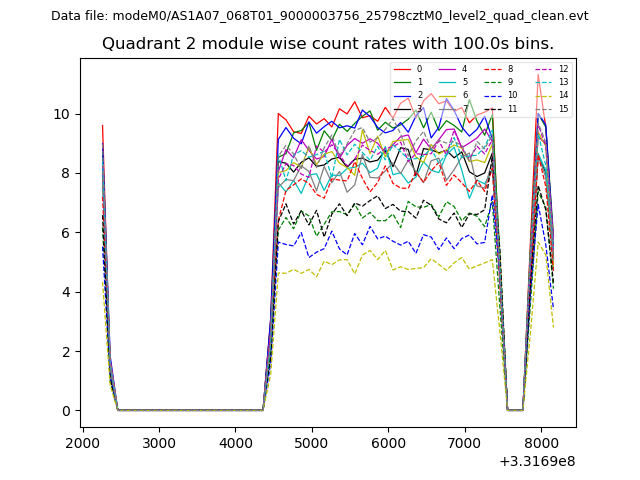
| Module-wise count rates for Quadrant A Data is divided into 100 sec bins |
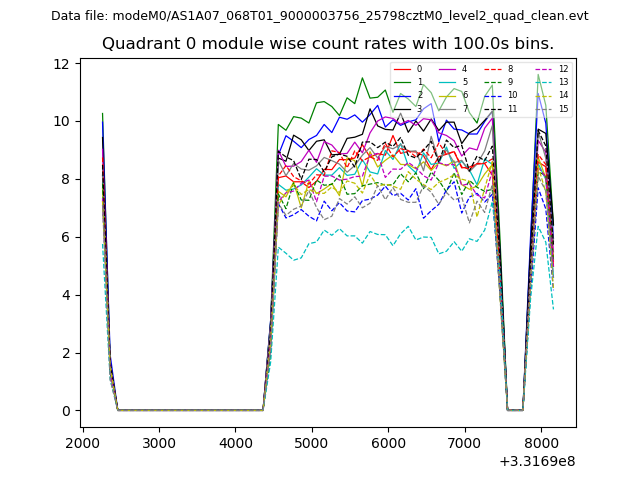 |
 |
| Module-wise count rates for Quadrant B Data is divided into 100 sec bins |
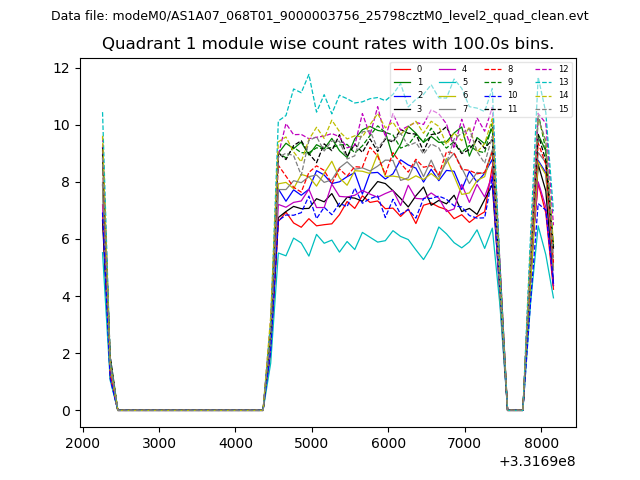 |
 |
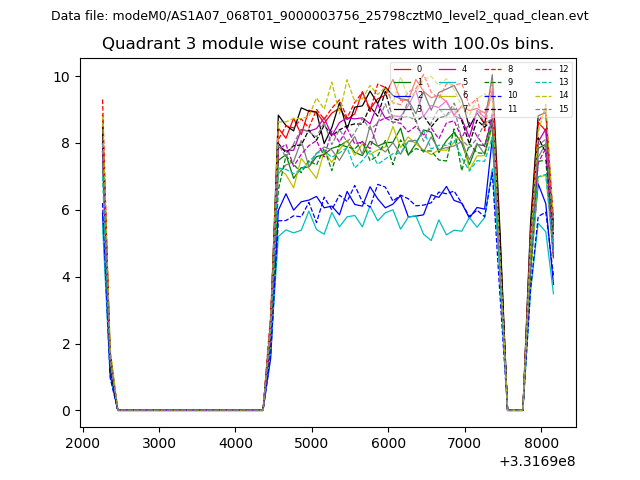
| Module-wise count rates for Quadrant C Data is divided into 100 sec bins |
 |
 |
| Module-wise count rates for Quadrant D Data is divided into 100 sec bins |
 |
 |
| Parameter | Plot |
|---|---|
| CZT HV Monitor | 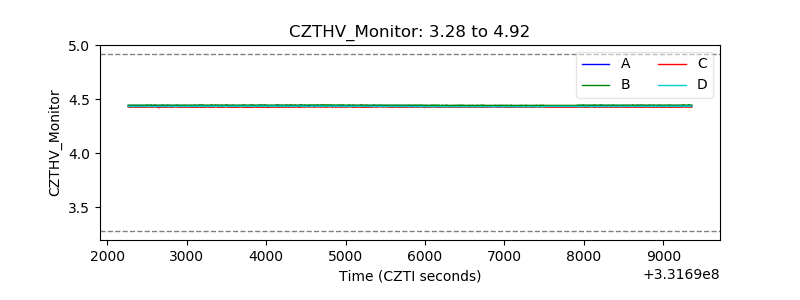 |
| D_VDD | 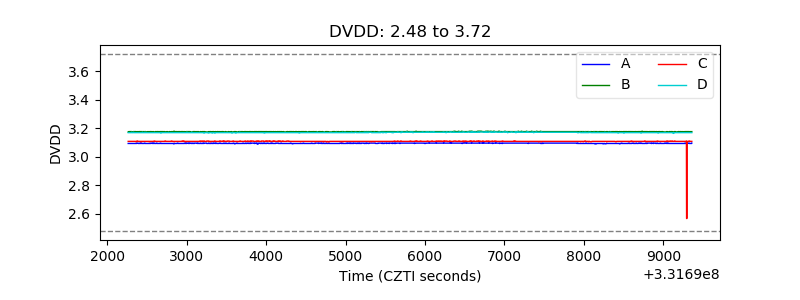 |
| Temperature 1 | 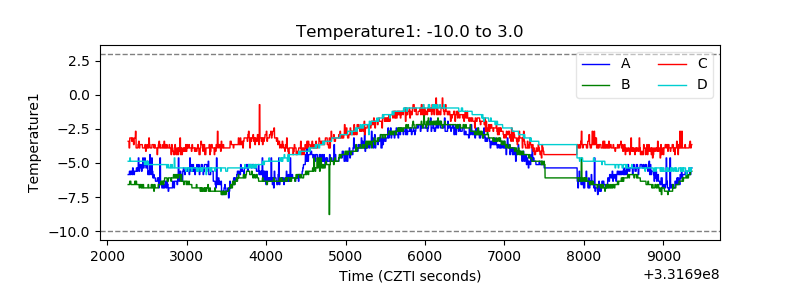 |
| Veto HV Monitor | 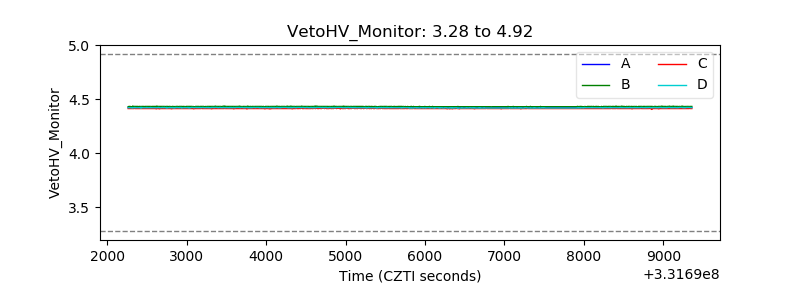 |
| Veto LLD | 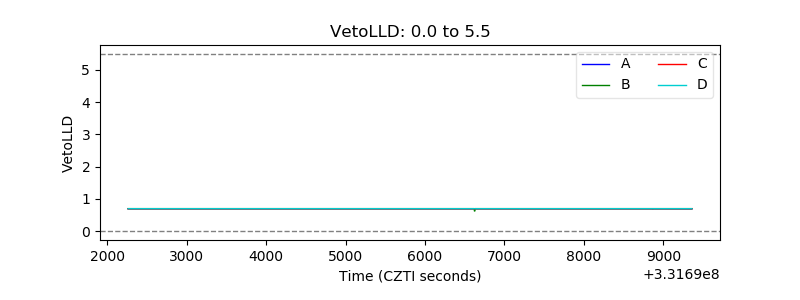 |
| Alpha Counter | 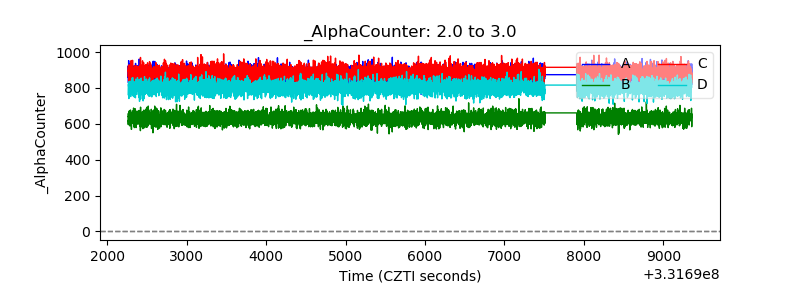 |
| _CPM_Rate | 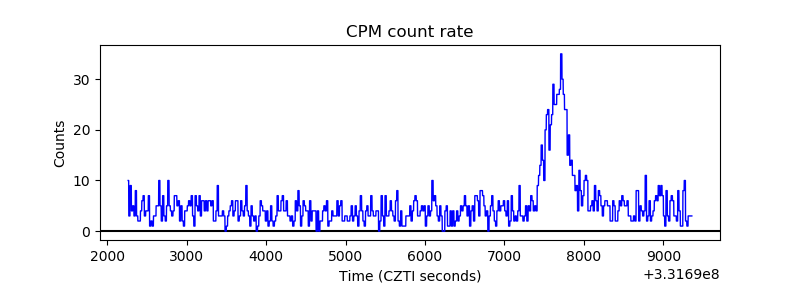 |
| CZT Counter | 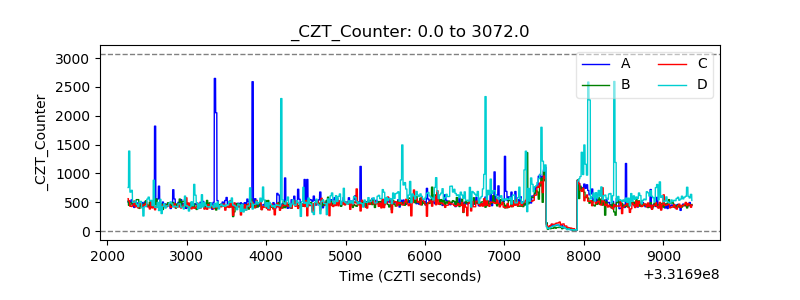 |
| +2.5 Volts monitor | 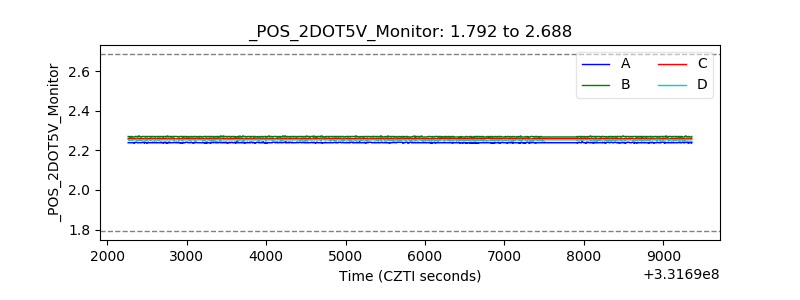 |
| +5 Volts monitor | 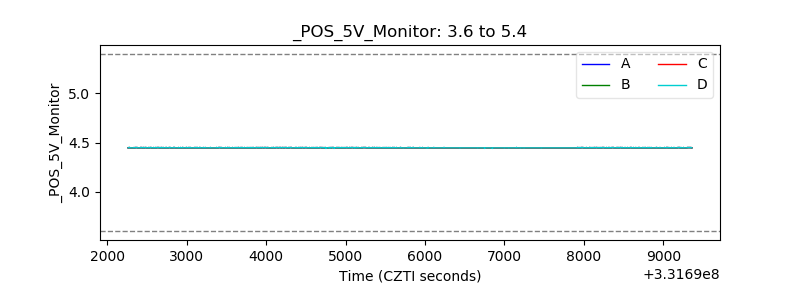 |
| _ROLL_ROT | 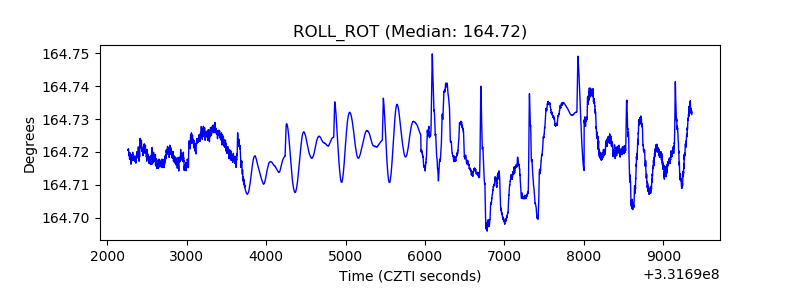 |
| _Roll_DEC |  |
| _Roll_RA | 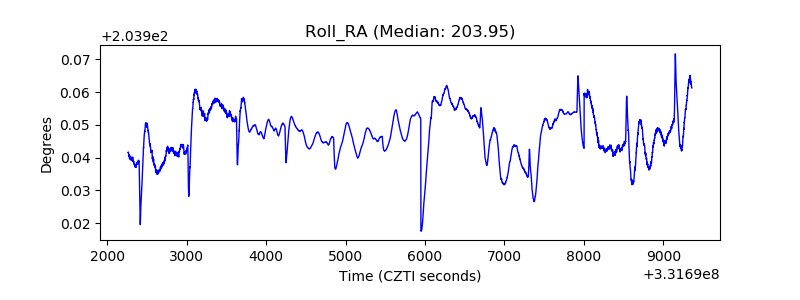 |
| Veto Counter | 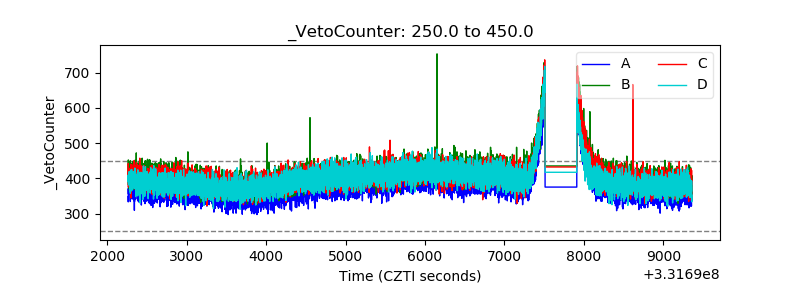 |