| Param | Original file | Final file |
|---|---|---|
| Filename | modeM0/AS1A07_068T01_9000003756_25799cztM0_level2.evt | modeM0/AS1A07_068T01_9000003756_25799cztM0_level2_quad_clean.evt |
| Size (bytes) | 524,736,000 | 76,913,280 |
| Size | 500.4 MB | 73.4 MB |
| Events in quadrant A | 4,604,485 | 461,507 |
| Events in quadrant B | 3,411,196 | 474,485 |
| Events in quadrant C | 3,366,065 | 452,155 |
| Events in quadrant D | 4,032,741 | 451,155 |
| Mode M0 | |||
|---|---|---|---|
| Quadrant | BADHDUFLAG | Total packets | Discarded packets |
| A | 0 | 18218 | 0 |
| B | 0 | 14563 | 0 |
| C | 0 | 14577 | 0 |
| D | 0 | 16437 | 0 |
| Mode M9 | |||
|---|---|---|---|
| Quadrant | BADHDUFLAG | Total packets | Discarded packets |
| A | 0 | 3 | 0 |
| B | 0 | 3 | 0 |
| C | 0 | 3 | 0 |
| D | 0 | 3 | 0 |
| Quadrant | Total seconds | Saturated seconds | Saturation percentage |
|---|---|---|---|
| A | 7030 | 393 | 5.590327% |
| B | 7031 | 140 | 1.991182% |
| C | 7031 | 171 | 2.432086% |
| D | 7031 | 128 | 1.820509% |
Noise dominated data is calculated using 1-second bins in cleaned event files. If a bin has >2000 counts, and if more than 50% of those come from <1% of pixels, then it is considered to be noise-dominated and hence unusable.
| Quadrant | # 1 sec bins | Bins with >0 counts | Bins with >2000 counts | High rate bins dominated by noise | Noise dominated (total time) | Noise dominated (detector-on time) | Marked lightcurve |
|---|---|---|---|---|---|---|---|
| A | 7245 | 7030 | 250 | 250 | 3.45% | 3.56% |  |
| B | 7246 | 7031 | 1 | 1 | 0.01% | 0.01% | 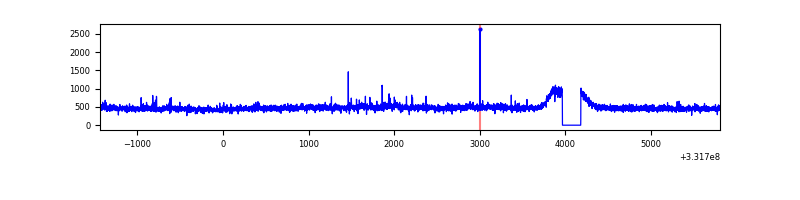 |
| C | 7246 | 7031 | 0 | 0 | 0.00% | 0.00% | 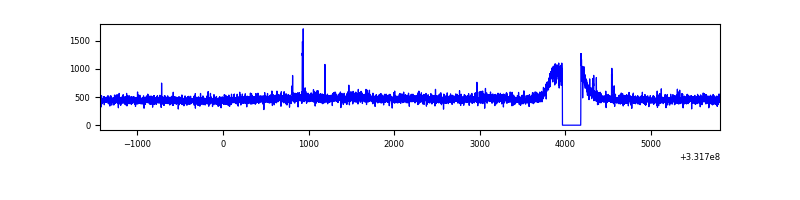 |
| D | 7246 | 7031 | 3 | 3 | 0.04% | 0.04% | 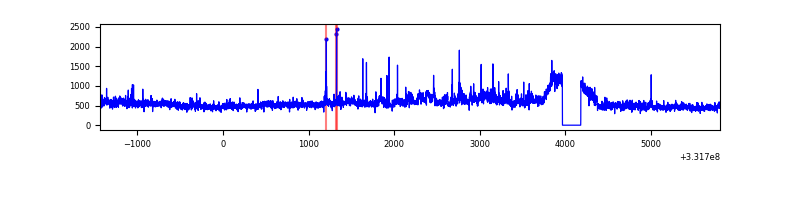 |
Top three noisy pixels from each quadrant. If the there are fewer than three noisy pixels in the level2.evt file, extra rows are filled as -1
| Pixel properties | Quadrant properties | ||||||
|---|---|---|---|---|---|---|---|
| Quadrant | DetID | PixID | Counts | Sigma | Mean | Median | Sigma |
| A | 0 | 13 | 1340618 | 7819.19 | 846 | 829 | 171.3 |
| A | 13 | 254 | 9829 | 52.53 | 846 | 829 | 171.3 |
| A | 3 | 137 | 8149 | 42.72 | 846 | 829 | 171.3 |
| B | 12 | 111 | 20904 | 119.29 | 856 | 834 | 168.2 |
| B | 4 | 171 | 20795 | 118.65 | 856 | 834 | 168.2 |
| B | 11 | 111 | 18456 | 104.74 | 856 | 834 | 168.2 |
| C | 14 | 238 | 128347 | 656.09 | 821 | 825 | 194.4 |
| C | 3 | 233 | 43465 | 219.38 | 821 | 825 | 194.4 |
| C | 13 | 61 | 5606 | 24.6 | 821 | 825 | 194.4 |
| D | 8 | 195 | 363859 | 1815.83 | 829 | 810 | 199.9 |
| D | 7 | 80 | 310179 | 1547.35 | 829 | 810 | 199.9 |
| D | 1 | 52 | 210189 | 1047.23 | 829 | 810 | 199.9 |
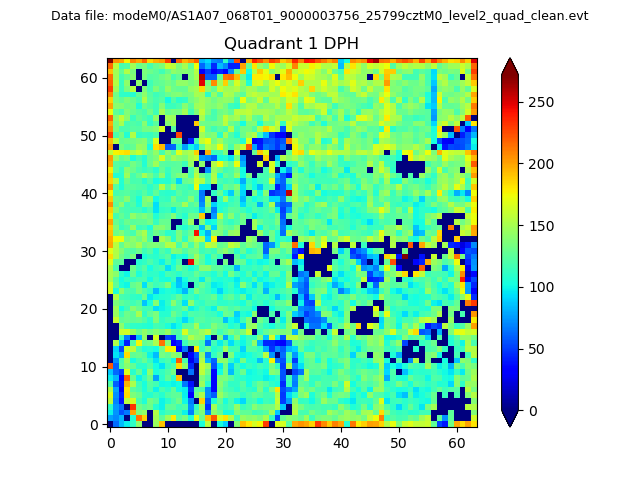
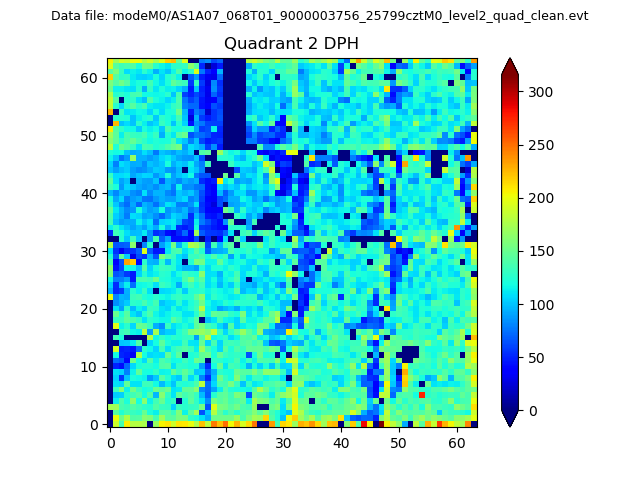
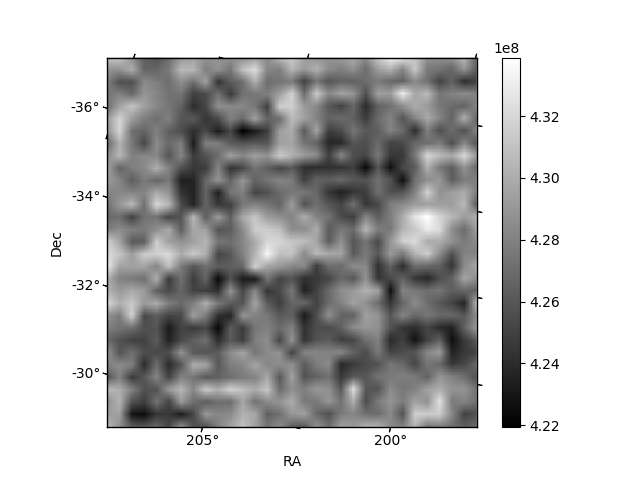
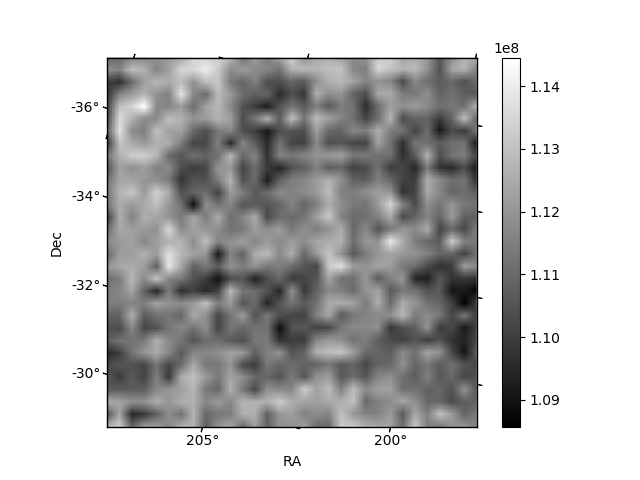
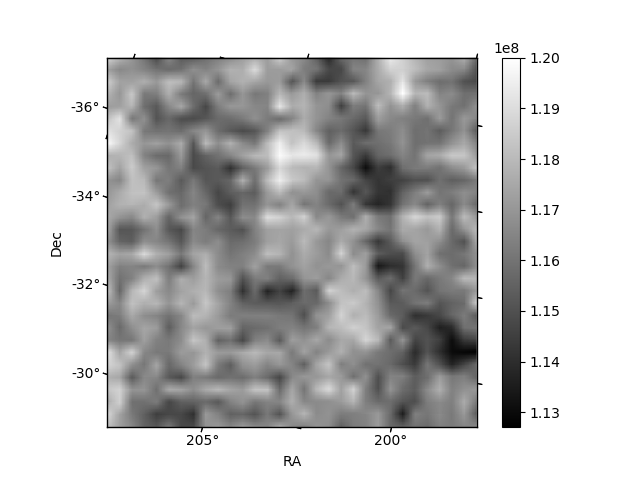
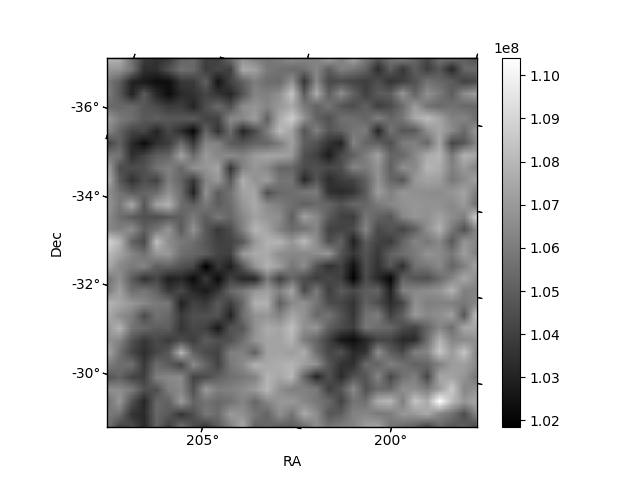
Histogram calculated using DETX and DETY for each event in the final _common_clean file
| Quadrant A | 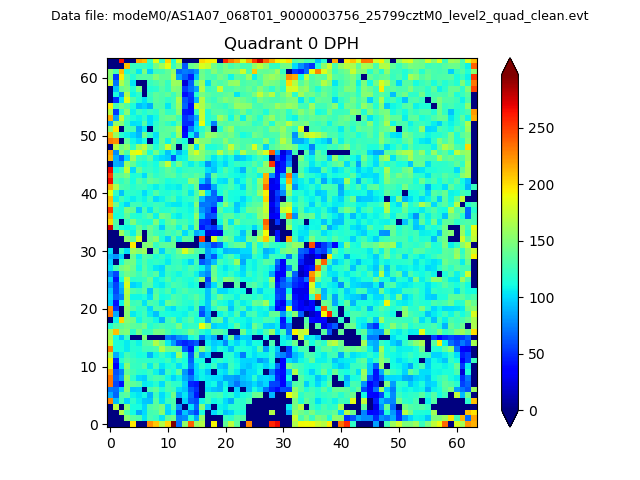 |
 |
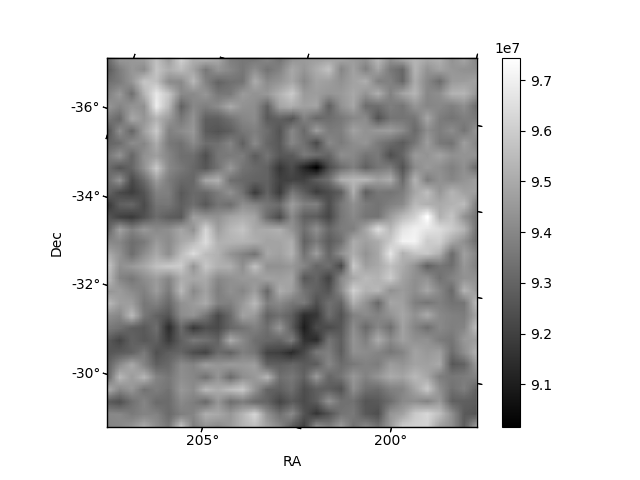
Quadrant B |
|---|---|---|---|
| Quadrant D | 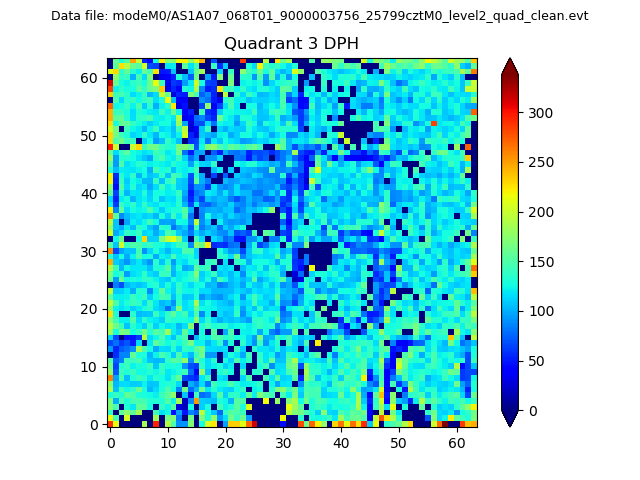 |
 |
Quadrant C |
| Plot type | Count rate plots | Images |
|---|---|---|
| Comparison with Poisson distribution Blue bars denote a histogram of data divided into 1 sec bins. Red curve is a Poisson curve with rate = median count rate of data. |
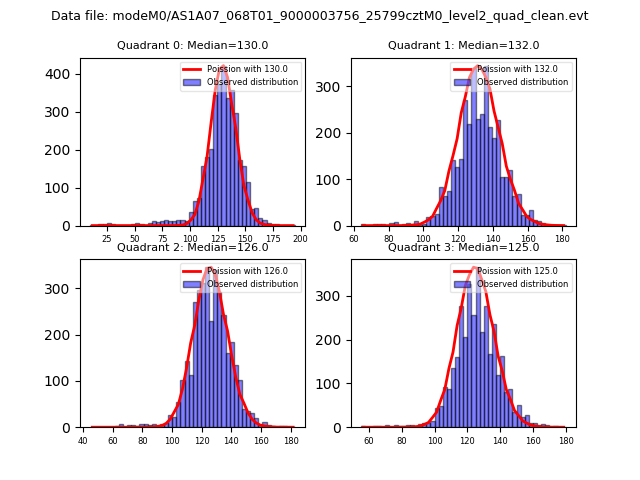 |
 |
| Quadrant-wise count rates Data is divided into 100 sec bins |
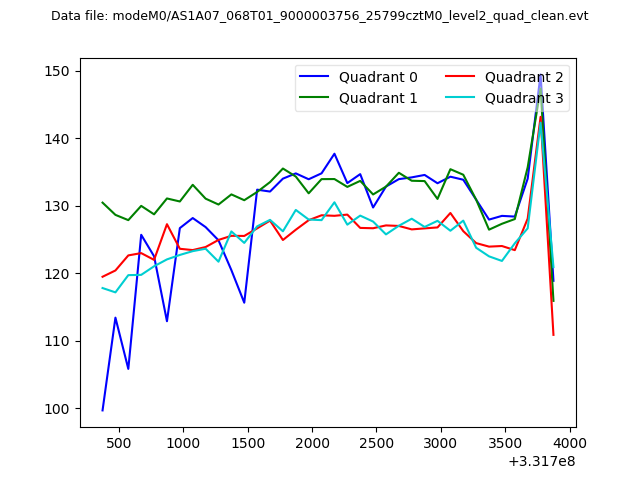 |
|
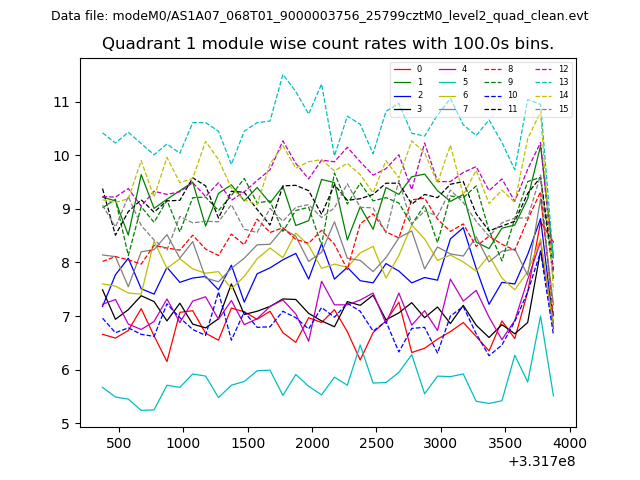
| Module-wise count rates for Quadrant A Data is divided into 100 sec bins |
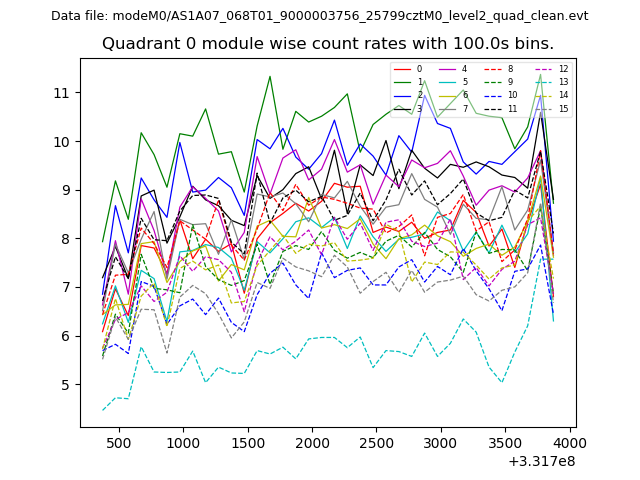 |
 |
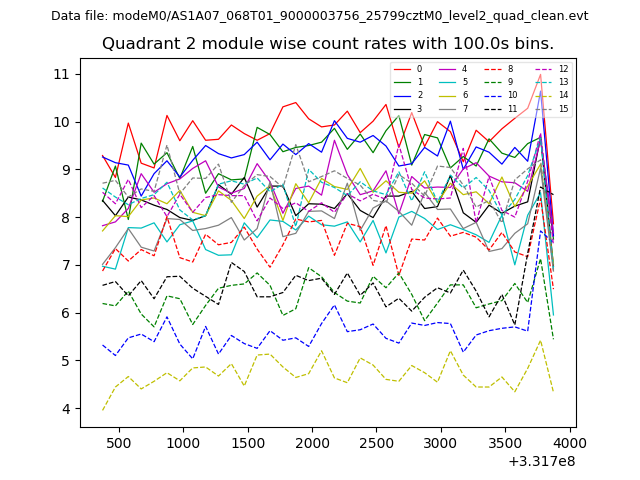
| Module-wise count rates for Quadrant B Data is divided into 100 sec bins |
 |
 |
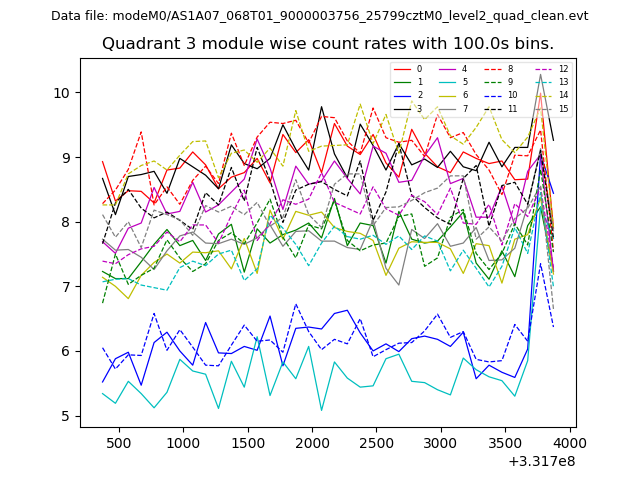
| Module-wise count rates for Quadrant C Data is divided into 100 sec bins |
 |
 |
| Module-wise count rates for Quadrant D Data is divided into 100 sec bins |
 |
 |
| Parameter | Plot |
|---|---|
| CZT HV Monitor | 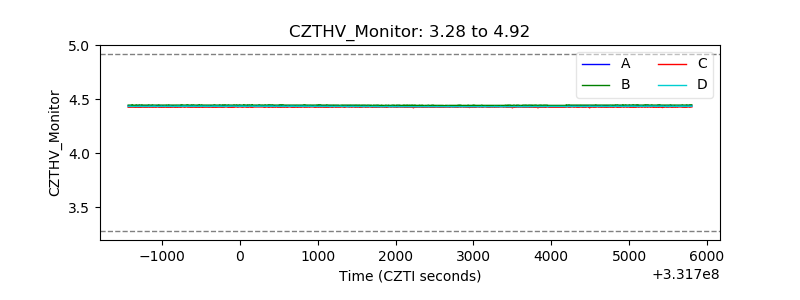 |
| D_VDD | 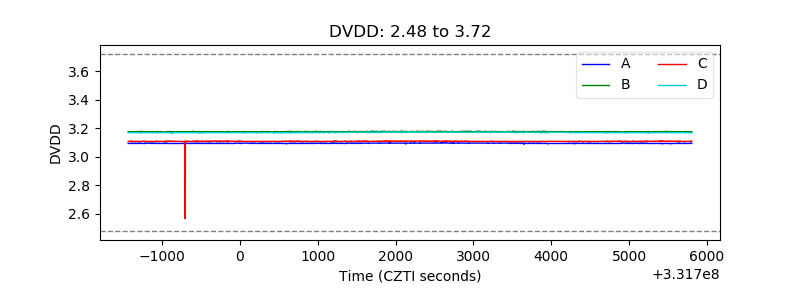 |
| Temperature 1 | 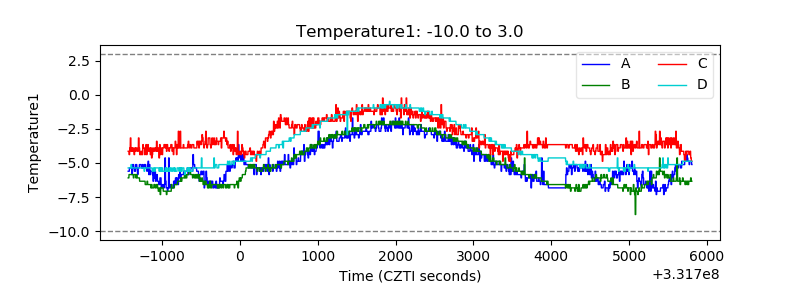 |
| Veto HV Monitor | 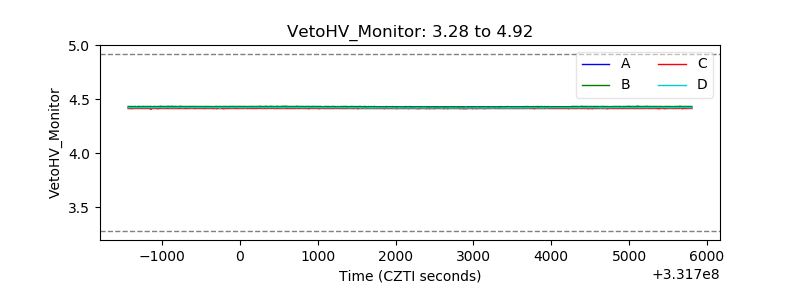 |
| Veto LLD | 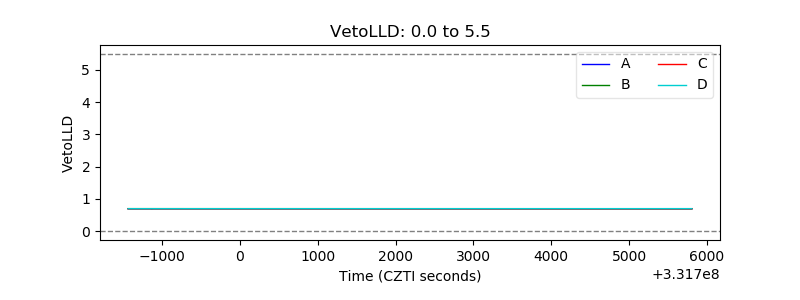 |
| Alpha Counter | 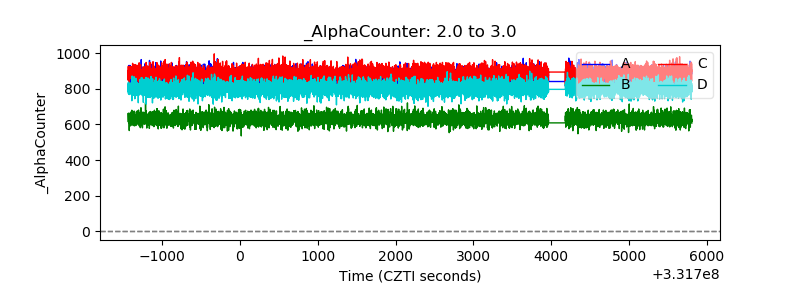 |
| _CPM_Rate | 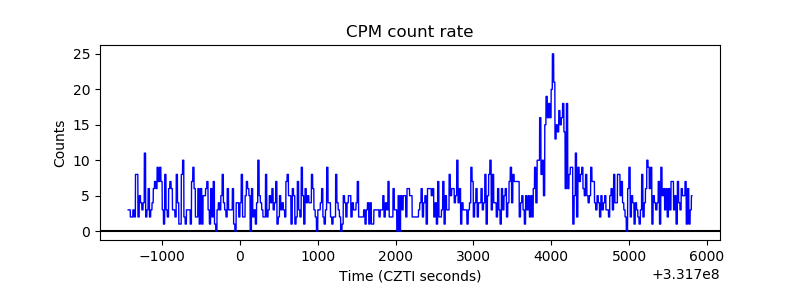 |
| CZT Counter | 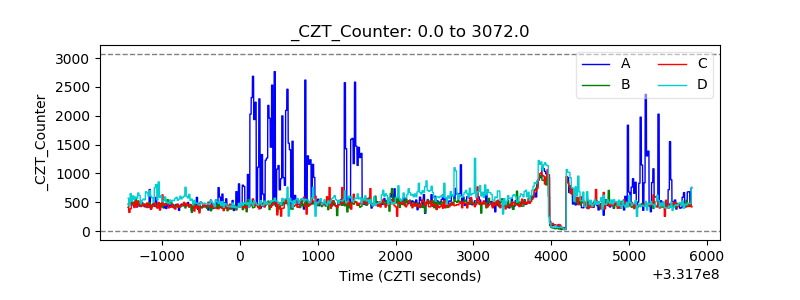 |
| +2.5 Volts monitor |  |
| +5 Volts monitor | 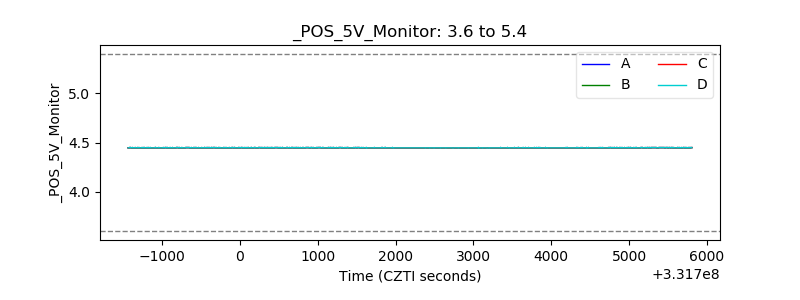 |
| _ROLL_ROT | 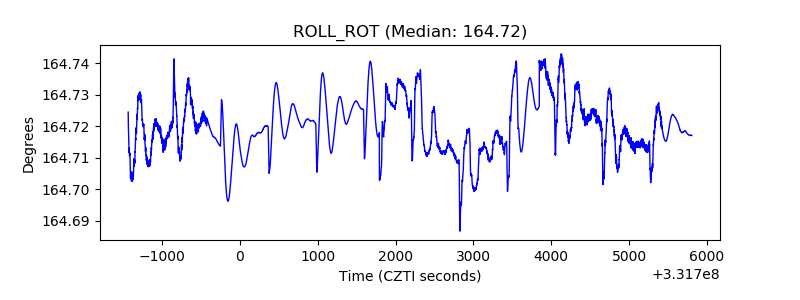 |
| _Roll_DEC | 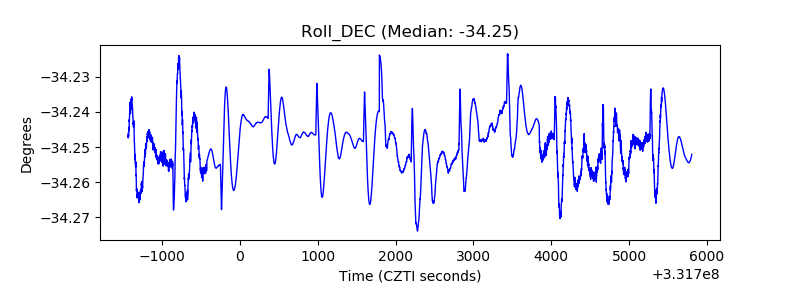 |
| _Roll_RA | 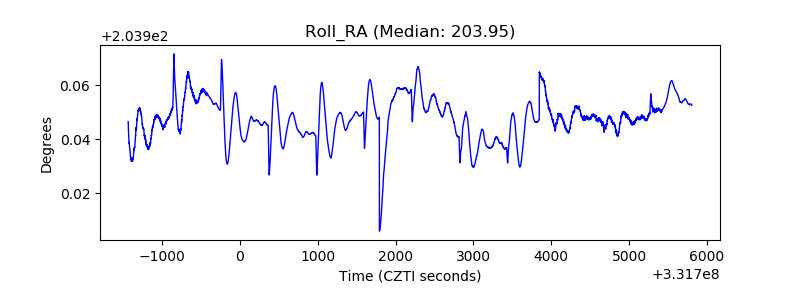 |
| Veto Counter | 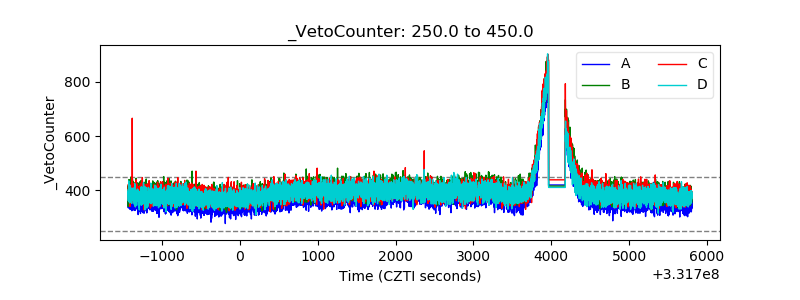 |