| Param | Original file | Final file |
|---|---|---|
| Filename | modeM0/AS1A07_068T01_9000003756_25800cztM0_level2.evt | modeM0/AS1A07_068T01_9000003756_25800cztM0_level2_quad_clean.evt |
| Size (bytes) | 512,251,200 | 78,716,160 |
| Size | 488.5 MB | 75.1 MB |
| Events in quadrant A | 4,815,349 | 469,487 |
| Events in quadrant B | 3,385,679 | 488,810 |
| Events in quadrant C | 3,370,673 | 464,600 |
| Events in quadrant D | 3,459,573 | 465,827 |
| Mode M0 | |||
|---|---|---|---|
| Quadrant | BADHDUFLAG | Total packets | Discarded packets |
| A | 0 | 18925 | 0 |
| B | 0 | 14534 | 0 |
| C | 0 | 14520 | 0 |
| D | 0 | 14897 | 0 |
| Mode M9 | |||
|---|---|---|---|
| Quadrant | BADHDUFLAG | Total packets | Discarded packets |
| A | 0 | 4 | 0 |
| B | 0 | 4 | 0 |
| C | 0 | 4 | 0 |
| D | 0 | 4 | 0 |
| Quadrant | Total seconds | Saturated seconds | Saturation percentage |
|---|---|---|---|
| A | 7105 | 308 | 4.334975% |
| B | 7105 | 52 | 0.731879% |
| C | 7106 | 78 | 1.097664% |
| D | 7106 | 36 | 0.506614% |
Noise dominated data is calculated using 1-second bins in cleaned event files. If a bin has >2000 counts, and if more than 50% of those come from <1% of pixels, then it is considered to be noise-dominated and hence unusable.
| Quadrant | # 1 sec bins | Bins with >0 counts | Bins with >2000 counts | High rate bins dominated by noise | Noise dominated (total time) | Noise dominated (detector-on time) | Marked lightcurve |
|---|---|---|---|---|---|---|---|
| A | 7525 | 7105 | 240 | 240 | 3.19% | 3.38% | 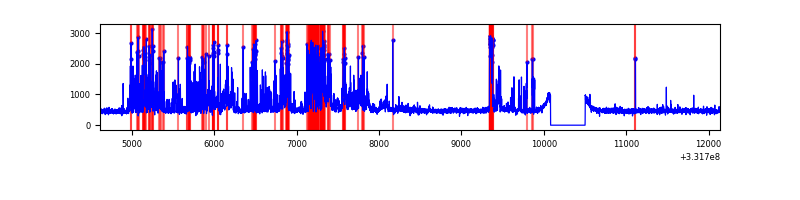 |
| B | 7525 | 7105 | 0 | 0 | 0.00% | 0.00% | 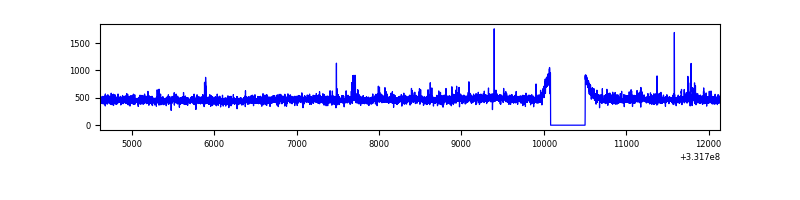 |
| C | 7526 | 7106 | 0 | 0 | 0.00% | 0.00% | 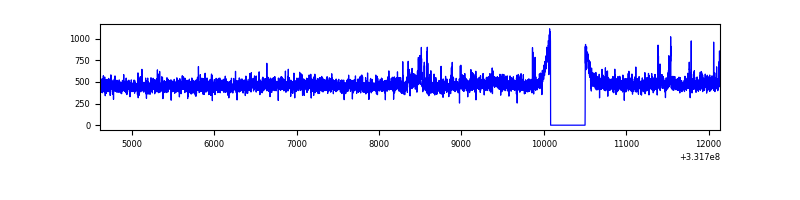 |
| D | 7526 | 7106 | 7 | 7 | 0.09% | 0.10% | 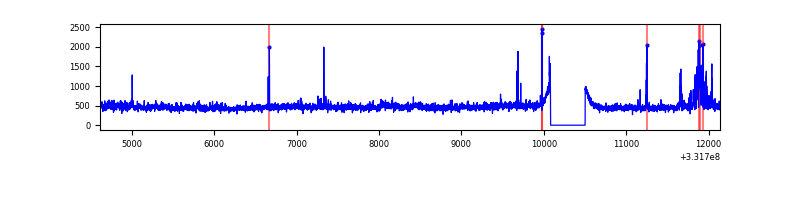 |
Top three noisy pixels from each quadrant. If the there are fewer than three noisy pixels in the level2.evt file, extra rows are filled as -1
| Pixel properties | Quadrant properties | ||||||
|---|---|---|---|---|---|---|---|
| Quadrant | DetID | PixID | Counts | Sigma | Mean | Median | Sigma |
| A | 0 | 13 | 1556447 | 9141.9 | 840 | 822 | 170.2 |
| A | 11 | 29 | 16319 | 91.07 | 840 | 822 | 170.2 |
| A | 13 | 254 | 9223 | 49.37 | 840 | 822 | 170.2 |
| B | 12 | 111 | 20471 | 120.35 | 847 | 827 | 163.2 |
| B | 0 | 190 | 20026 | 117.62 | 847 | 827 | 163.2 |
| B | 11 | 111 | 18380 | 107.54 | 847 | 827 | 163.2 |
| C | 14 | 238 | 131780 | 682.9 | 813 | 817 | 191.8 |
| C | 3 | 233 | 70966 | 365.79 | 813 | 817 | 191.8 |
| C | 13 | 61 | 5570 | 24.78 | 813 | 817 | 191.8 |
| D | 8 | 195 | 126167 | 637.31 | 820 | 800 | 196.7 |
| D | 13 | 104 | 119119 | 601.48 | 820 | 800 | 196.7 |
| D | 1 | 52 | 69117 | 347.29 | 820 | 800 | 196.7 |
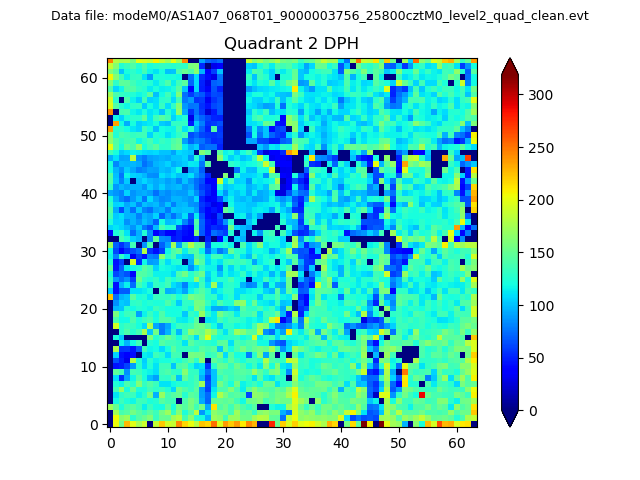
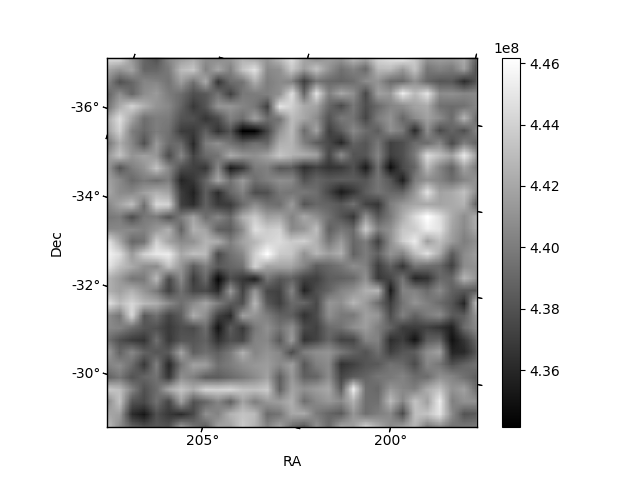
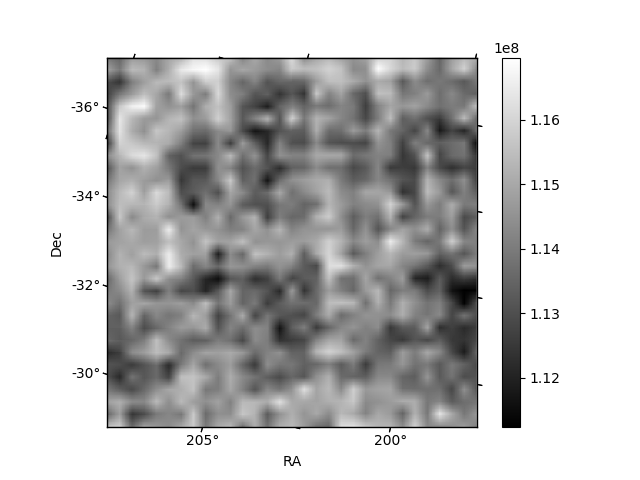
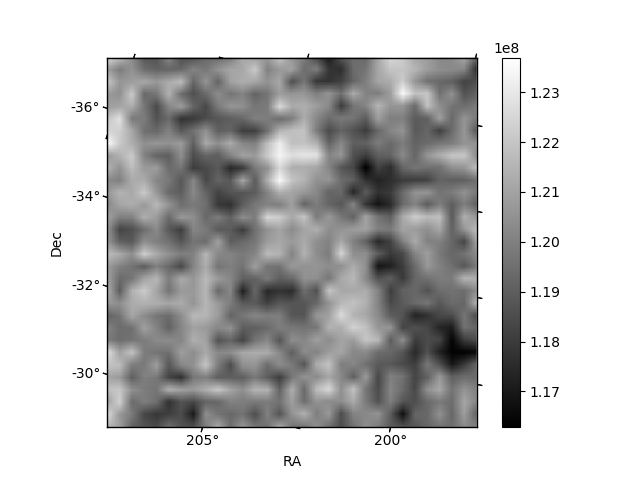
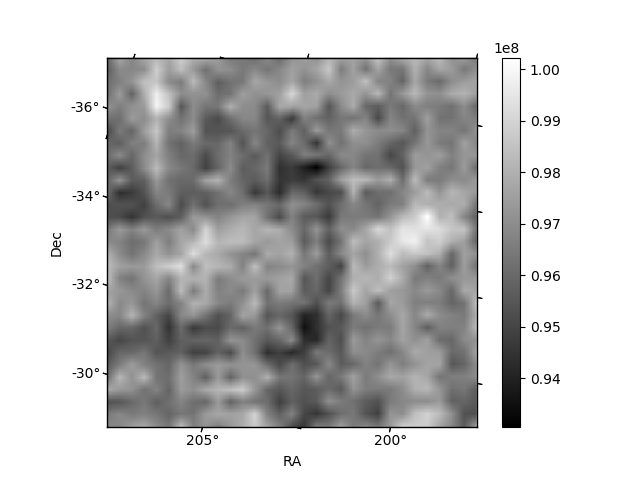
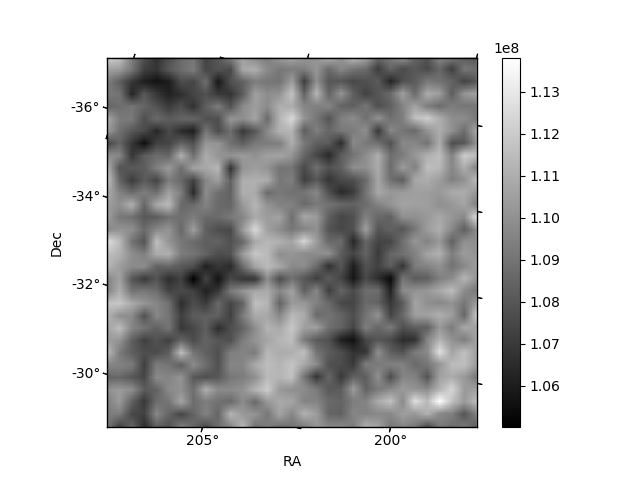
Histogram calculated using DETX and DETY for each event in the final _common_clean file
| Quadrant A | 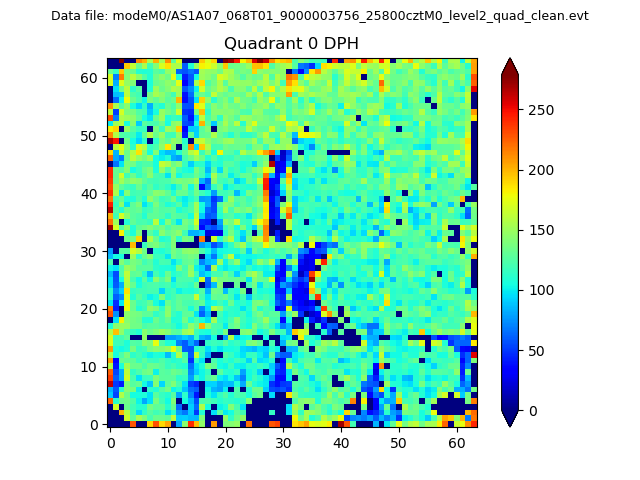 |
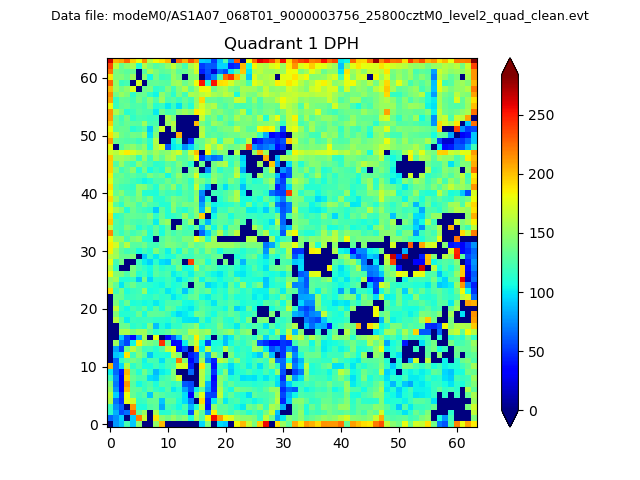 |
Quadrant B |
|---|---|---|---|
| Quadrant D | 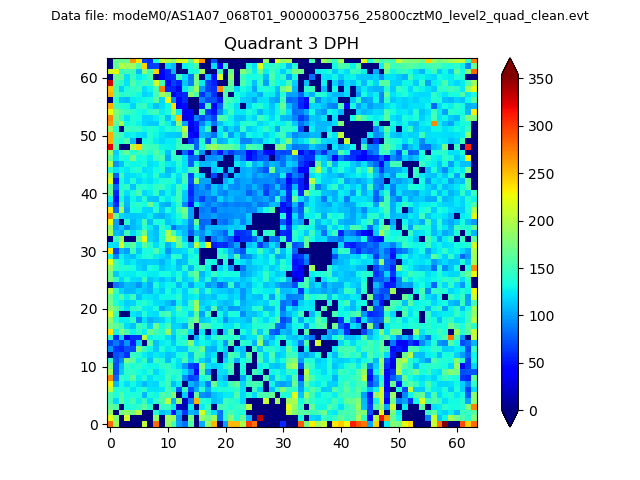 |
 |
Quadrant C |
| Plot type | Count rate plots | Images |
|---|---|---|
| Comparison with Poisson distribution Blue bars denote a histogram of data divided into 1 sec bins. Red curve is a Poisson curve with rate = median count rate of data. |
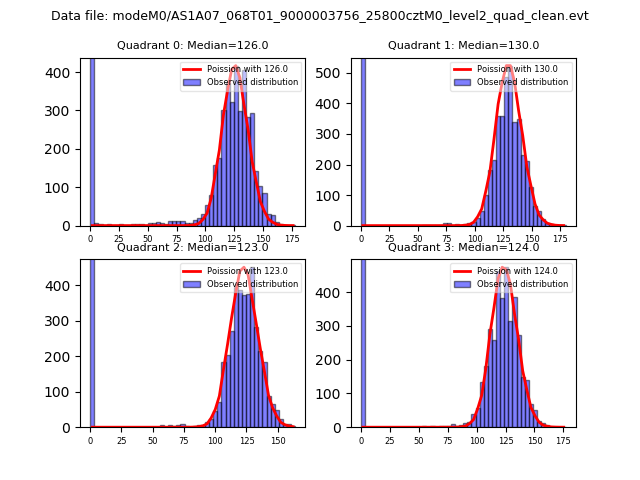 |
 |
| Quadrant-wise count rates Data is divided into 100 sec bins |
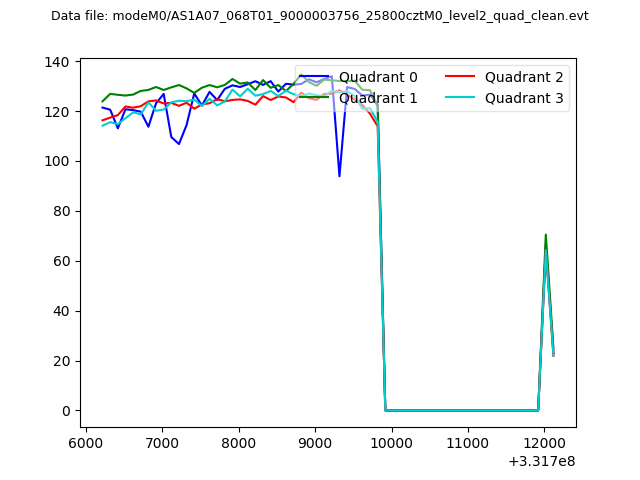 |
|
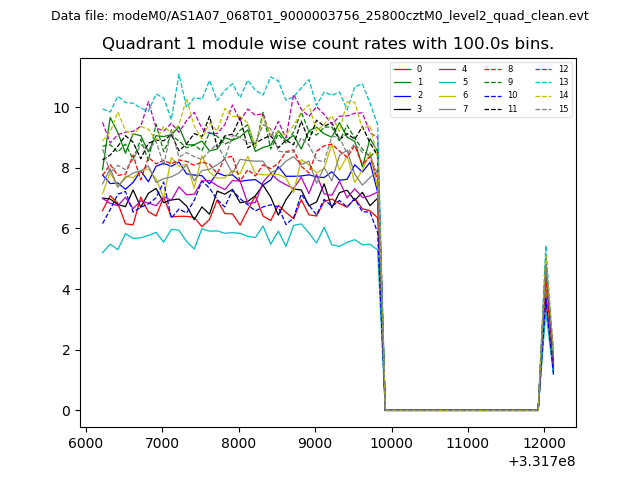
| Module-wise count rates for Quadrant A Data is divided into 100 sec bins |
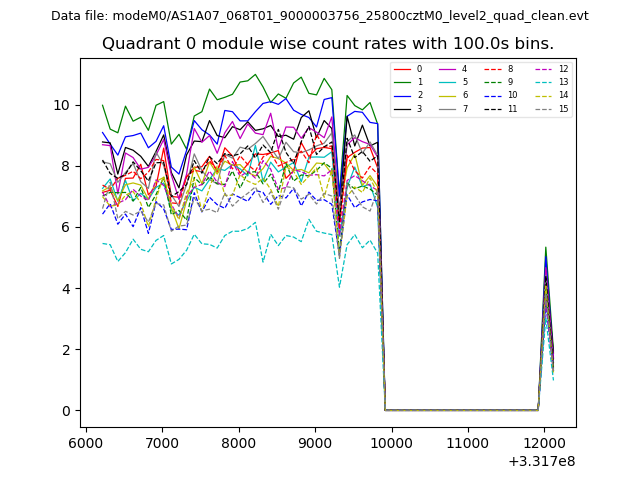 |
 |
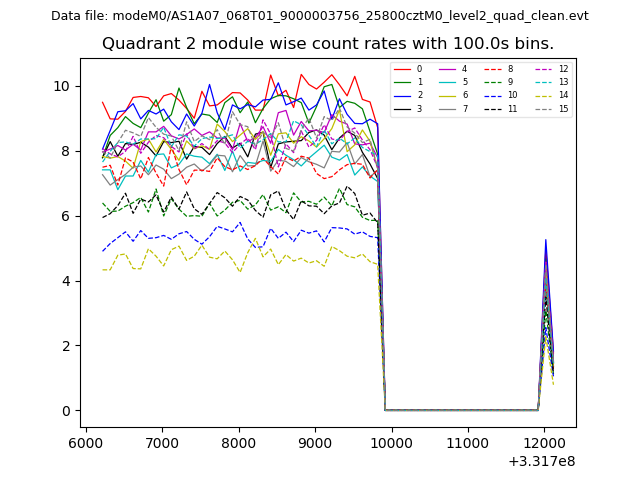
| Module-wise count rates for Quadrant B Data is divided into 100 sec bins |
 |
 |
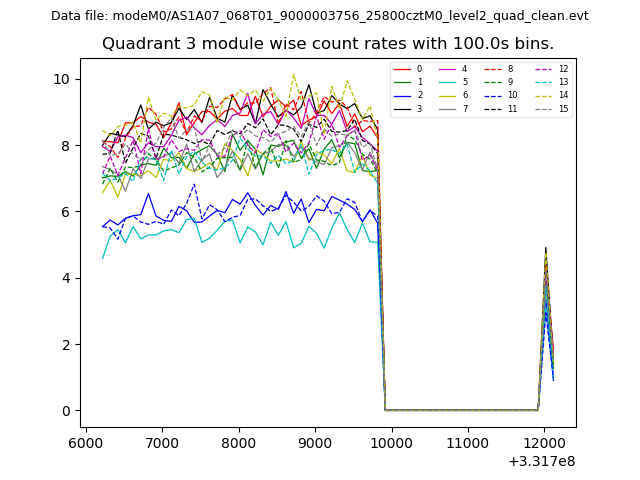
| Module-wise count rates for Quadrant C Data is divided into 100 sec bins |
 |
 |
| Module-wise count rates for Quadrant D Data is divided into 100 sec bins |
 |
 |
| Parameter | Plot |
|---|---|
| CZT HV Monitor | 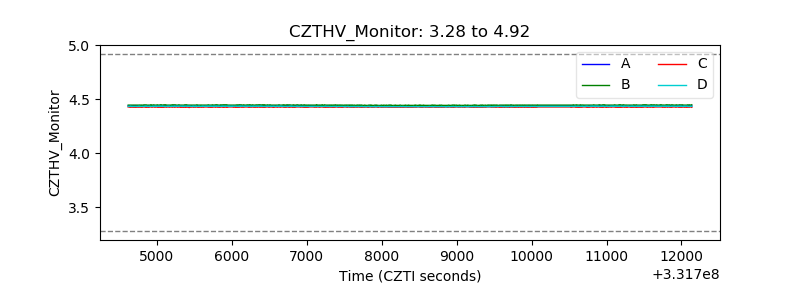 |
| D_VDD | 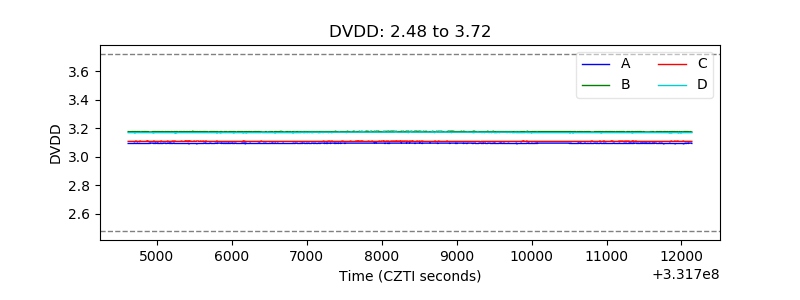 |
| Temperature 1 | 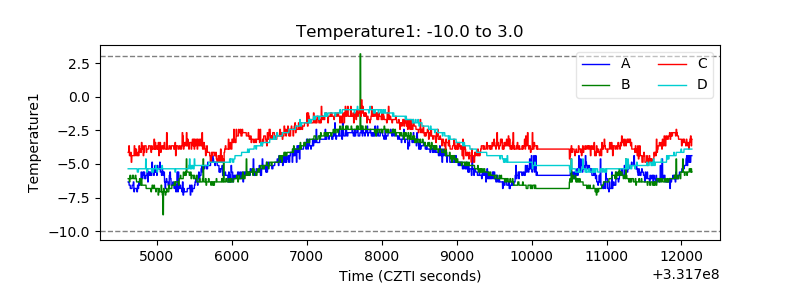 |
| Veto HV Monitor | 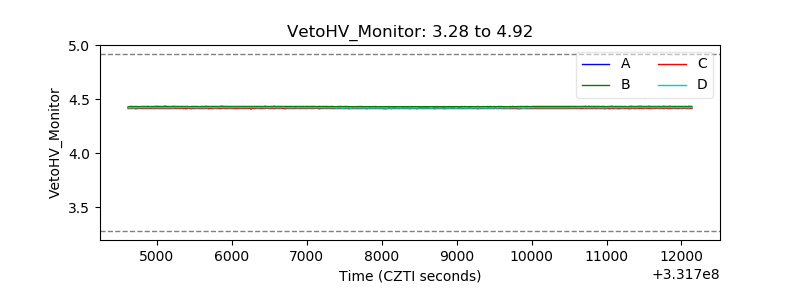 |
| Veto LLD | 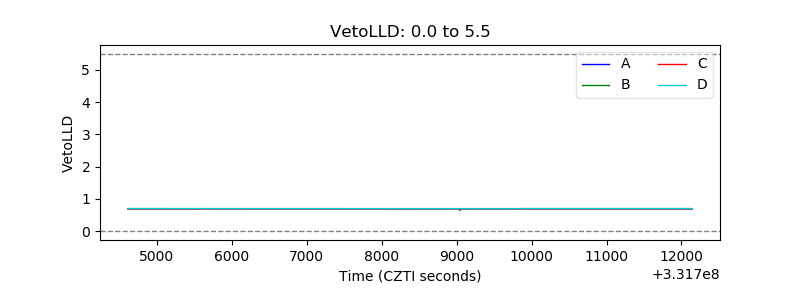 |
| Alpha Counter | 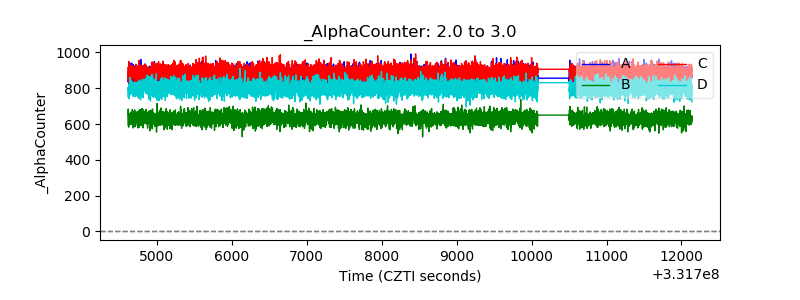 |
| _CPM_Rate | 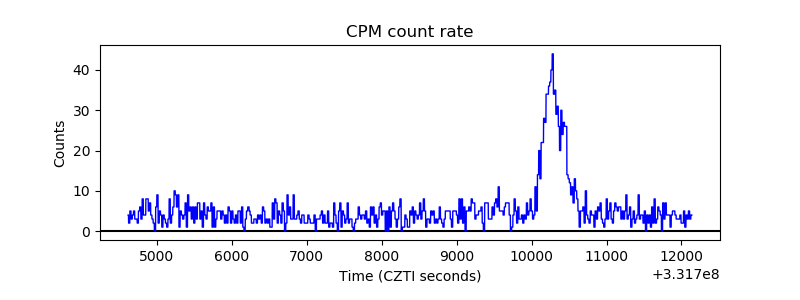 |
| CZT Counter | 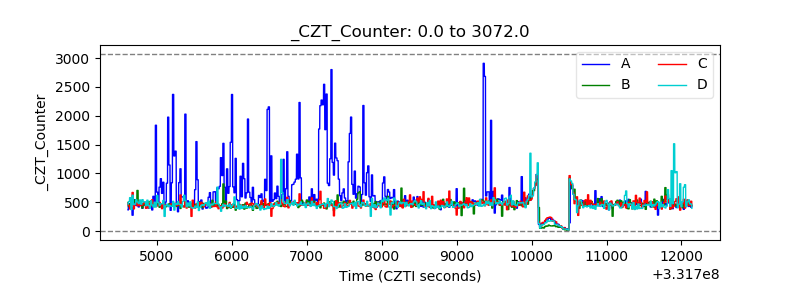 |
| +2.5 Volts monitor |  |
| +5 Volts monitor |  |
| _ROLL_ROT | 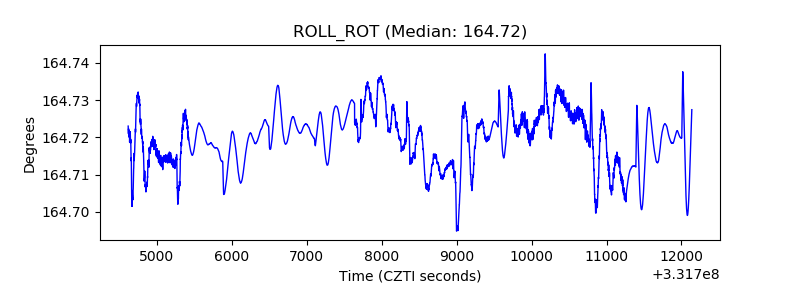 |
| _Roll_DEC | 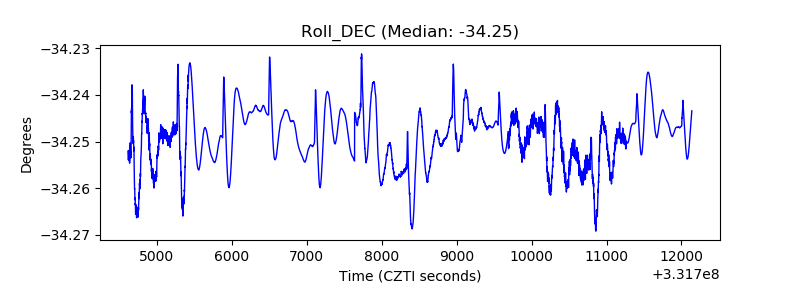 |
| _Roll_RA | 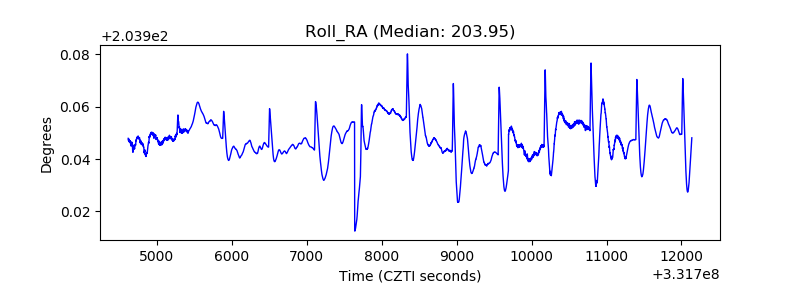 |
| Veto Counter | 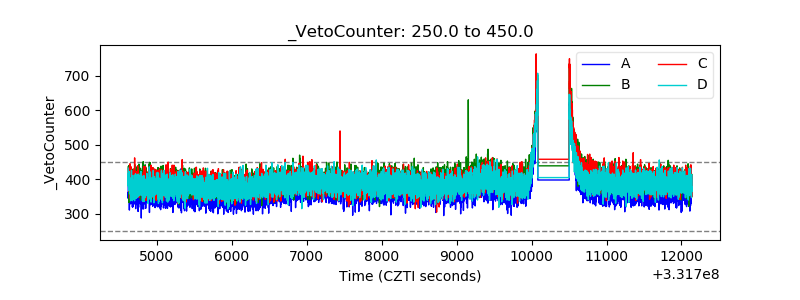 |