| Param | Original file | Final file |
|---|---|---|
| Filename | modeM0/AS1A07_068T01_9000003756_25802cztM0_level2.evt | modeM0/AS1A07_068T01_9000003756_25802cztM0_level2_quad_clean.evt |
| Size (bytes) | 861,143,040 | 165,994,560 |
| Size | 821.2 MB | 158.3 MB |
| Events in quadrant A | 6,076,755 | 1,057,240 |
| Events in quadrant B | 6,029,527 | 1,068,545 |
| Events in quadrant C | 6,522,696 | 1,015,840 |
| Events in quadrant D | 6,598,708 | 1,016,211 |
| Mode M0 | |||
|---|---|---|---|
| Quadrant | BADHDUFLAG | Total packets | Discarded packets |
| A | 0 | 25863 | 0 |
| B | 0 | 25681 | 0 |
| C | 0 | 27123 | 0 |
| D | 0 | 27640 | 0 |
| Mode M9 | |||
|---|---|---|---|
| Quadrant | BADHDUFLAG | Total packets | Discarded packets |
| A | 0 | 13 | 0 |
| B | 0 | 13 | 0 |
| C | 0 | 13 | 0 |
| D | 0 | 13 | 0 |
| Quadrant | Total seconds | Saturated seconds | Saturation percentage |
|---|---|---|---|
| A | 12580 | 152 | 1.208267% |
| B | 12581 | 120 | 0.953819% |
| C | 12581 | 249 | 1.979175% |
| D | 12581 | 122 | 0.969716% |
Noise dominated data is calculated using 1-second bins in cleaned event files. If a bin has >2000 counts, and if more than 50% of those come from <1% of pixels, then it is considered to be noise-dominated and hence unusable.
| Quadrant | # 1 sec bins | Bins with >0 counts | Bins with >2000 counts | High rate bins dominated by noise | Noise dominated (total time) | Noise dominated (detector-on time) | Marked lightcurve |
|---|---|---|---|---|---|---|---|
| A | 13850 | 12580 | 21 | 21 | 0.15% | 0.17% | 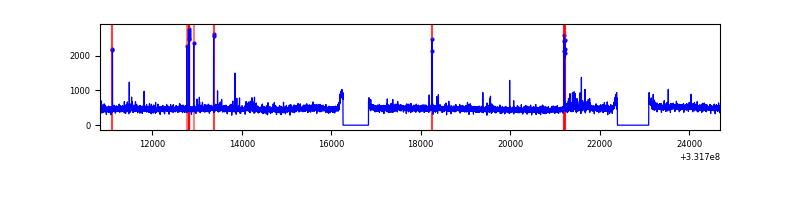 |
| B | 13851 | 12581 | 0 | 0 | 0.00% | 0.00% | 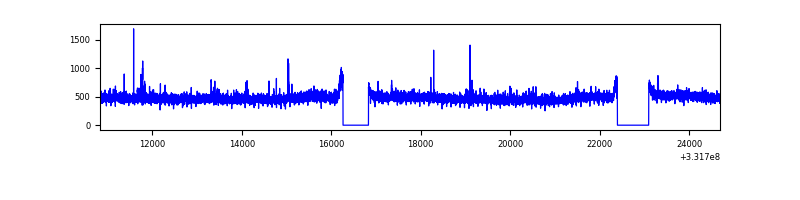 |
| C | 13851 | 12581 | 47 | 47 | 0.34% | 0.37% | 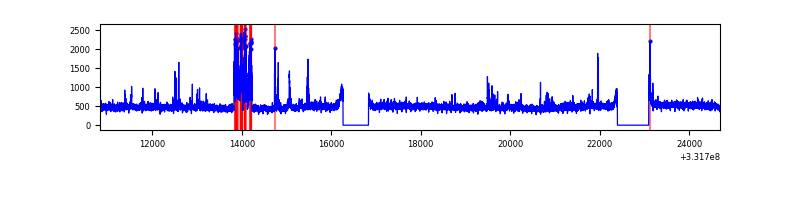 |
| D | 13851 | 12581 | 19 | 19 | 0.14% | 0.15% | 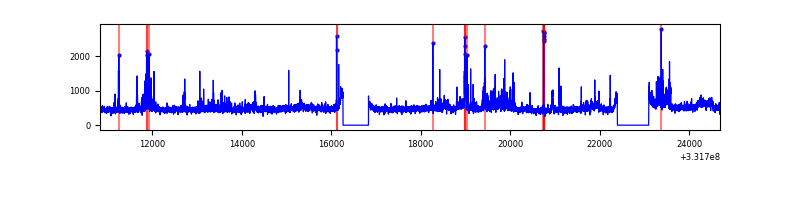 |
Top three noisy pixels from each quadrant. If the there are fewer than three noisy pixels in the level2.evt file, extra rows are filled as -1
| Pixel properties | Quadrant properties | ||||||
|---|---|---|---|---|---|---|---|
| Quadrant | DetID | PixID | Counts | Sigma | Mean | Median | Sigma |
| A | 0 | 13 | 190487 | 618.05 | 1526 | 1494 | 305.8 |
| A | 13 | 254 | 16992 | 50.68 | 1526 | 1494 | 305.8 |
| A | 3 | 137 | 14600 | 42.86 | 1526 | 1494 | 305.8 |
| B | 4 | 171 | 40430 | 135.23 | 1512 | 1476 | 288.1 |
| B | 12 | 111 | 36328 | 120.99 | 1512 | 1476 | 288.1 |
| B | 0 | 219 | 34113 | 113.3 | 1512 | 1476 | 288.1 |
| C | 3 | 233 | 620031 | 1812.13 | 1455 | 1464 | 341.3 |
| C | 14 | 238 | 231301 | 673.32 | 1455 | 1464 | 341.3 |
| C | 13 | 61 | 10200 | 25.59 | 1455 | 1464 | 341.3 |
| D | 7 | 80 | 479877 | 1361.41 | 1476 | 1440 | 351.4 |
| D | 8 | 195 | 300999 | 852.4 | 1476 | 1440 | 351.4 |
| D | 13 | 104 | 119750 | 336.65 | 1476 | 1440 | 351.4 |
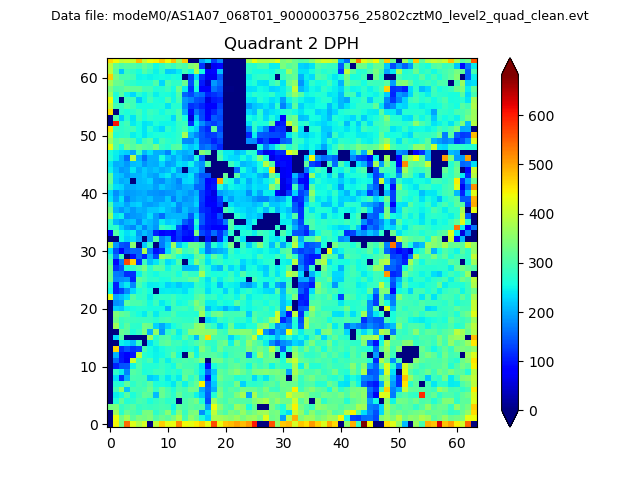
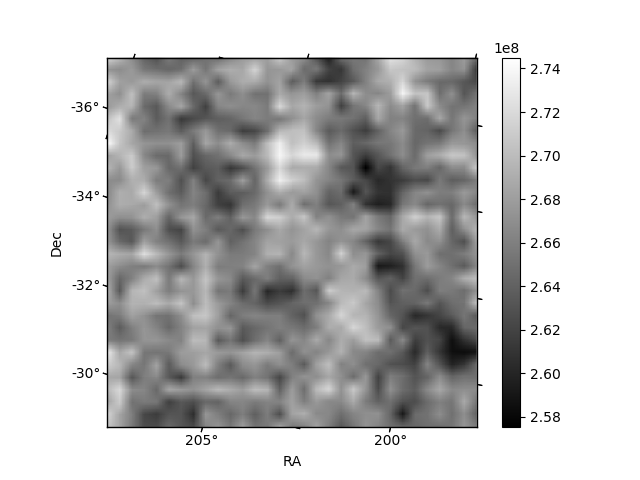
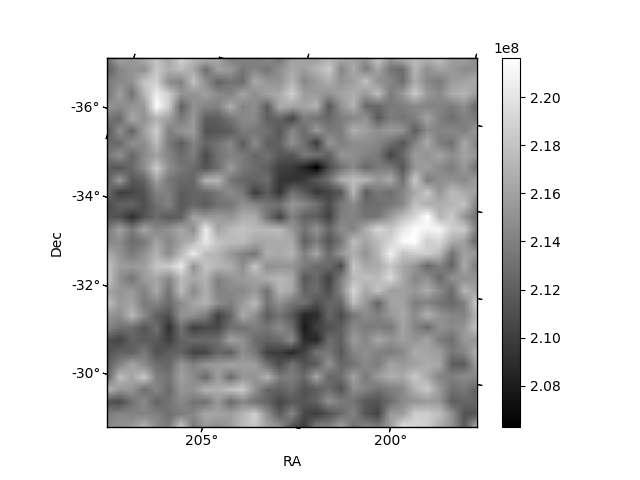
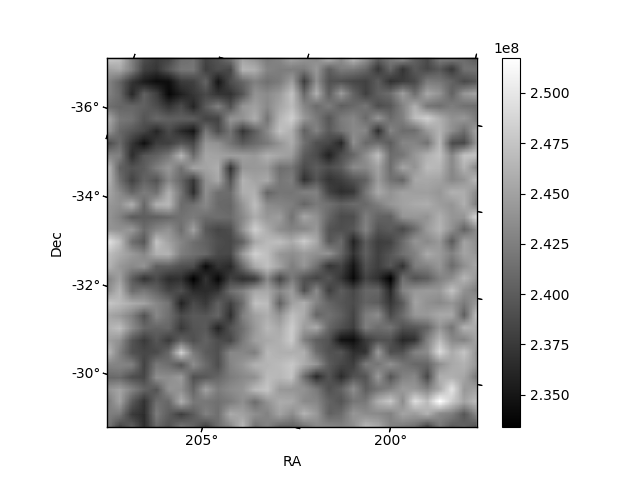
Histogram calculated using DETX and DETY for each event in the final _common_clean file
| Quadrant A | 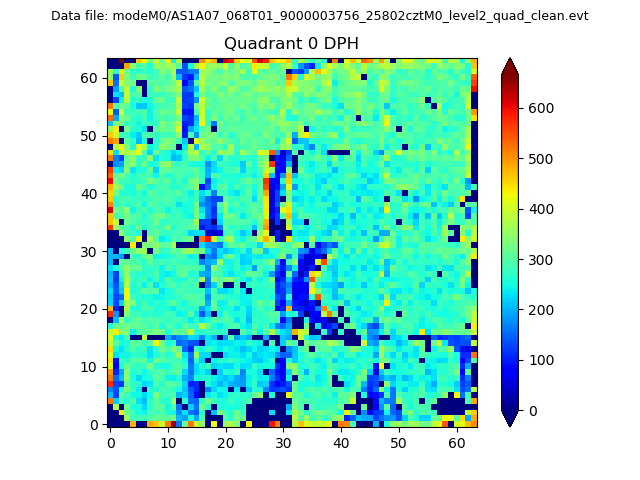 |
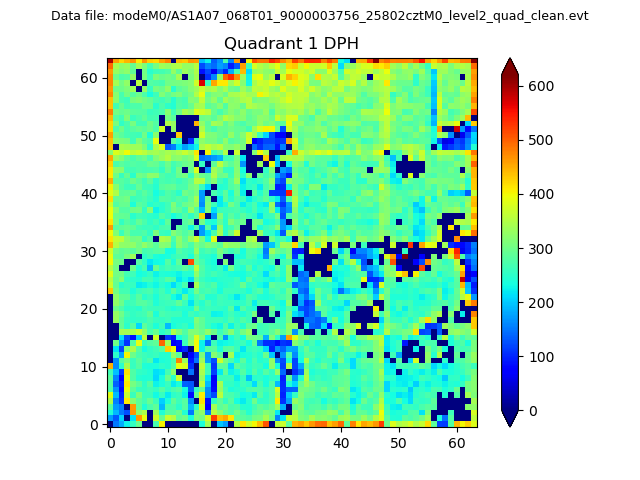 |
Quadrant B |
|---|---|---|---|
| Quadrant D | 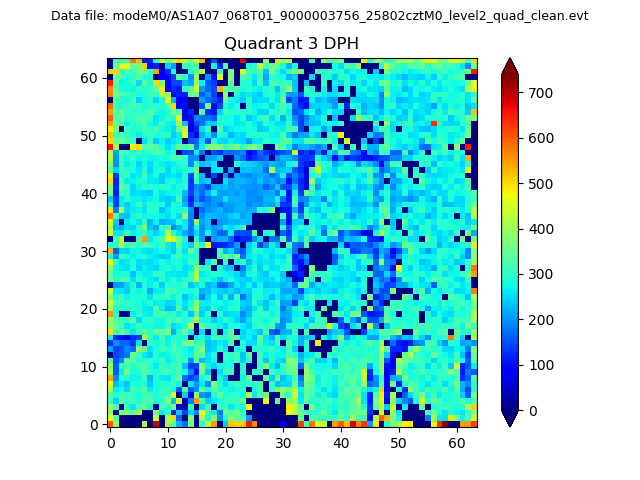 |
 |
Quadrant C |
| Plot type | Count rate plots | Images |
|---|---|---|
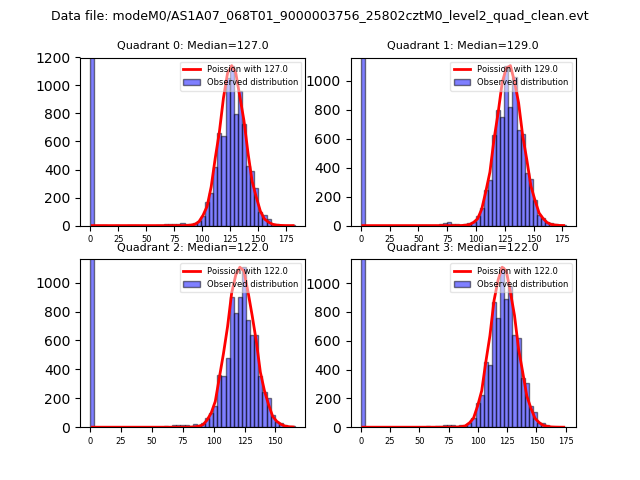
| Comparison with Poisson distribution Blue bars denote a histogram of data divided into 1 sec bins. Red curve is a Poisson curve with rate = median count rate of data. |
 |
 |
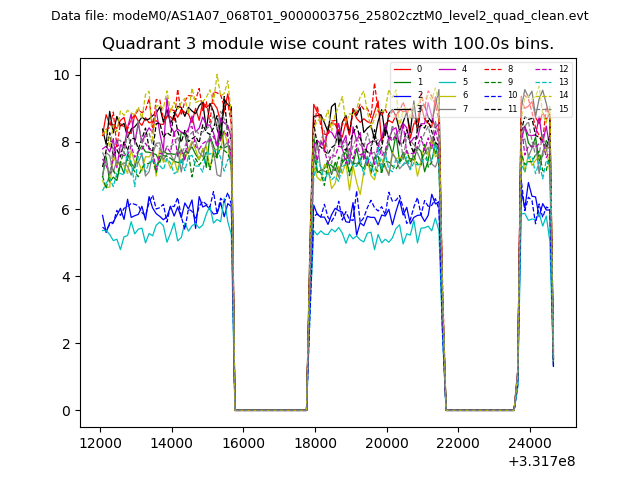
| Quadrant-wise count rates Data is divided into 100 sec bins |
 |
|
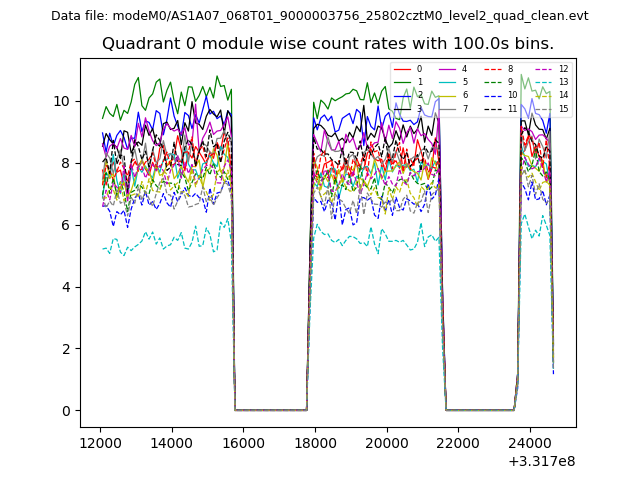
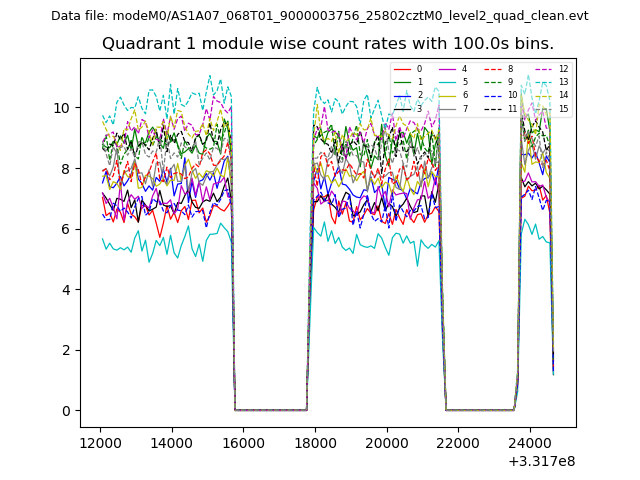
| Module-wise count rates for Quadrant A Data is divided into 100 sec bins |
 |
 |
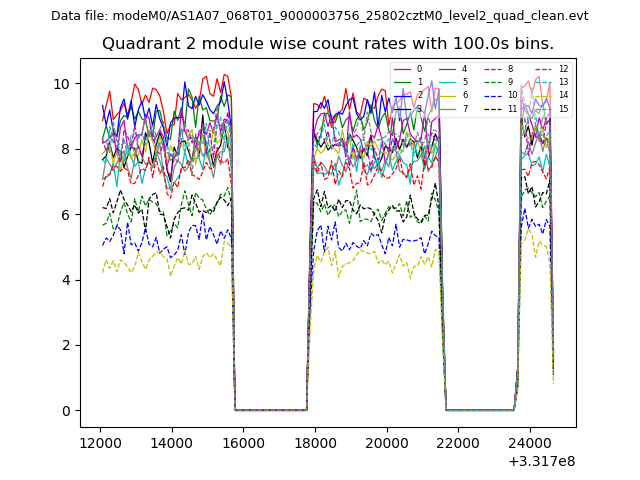
| Module-wise count rates for Quadrant B Data is divided into 100 sec bins |
 |
 |
| Module-wise count rates for Quadrant C Data is divided into 100 sec bins |
 |
 |
| Module-wise count rates for Quadrant D Data is divided into 100 sec bins |
 |
 |
| Parameter | Plot |
|---|---|
| CZT HV Monitor | 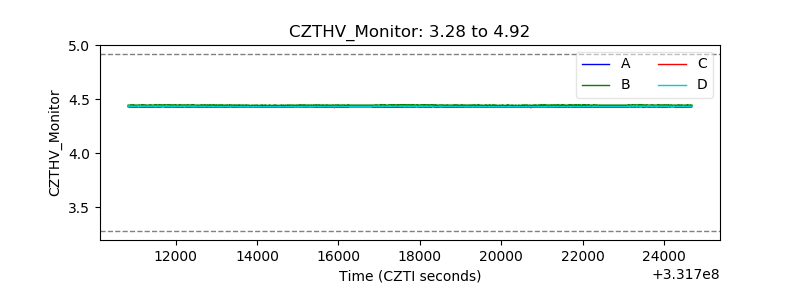 |
| D_VDD | 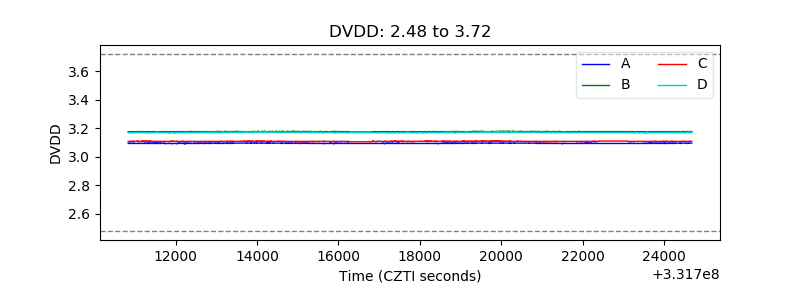 |
| Temperature 1 | 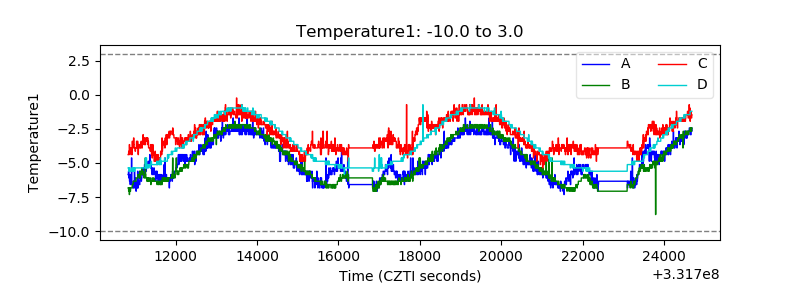 |
| Veto HV Monitor | 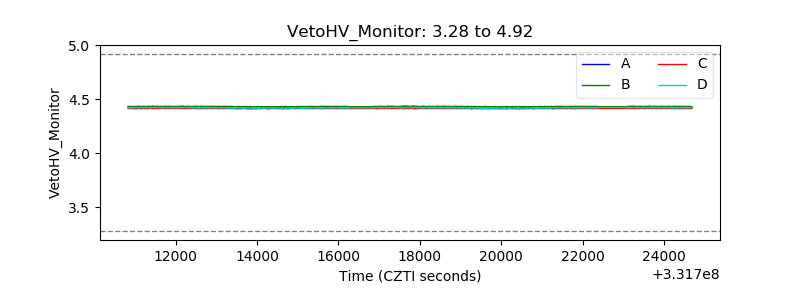 |
| Veto LLD |  |
| Alpha Counter |  |
| _CPM_Rate | 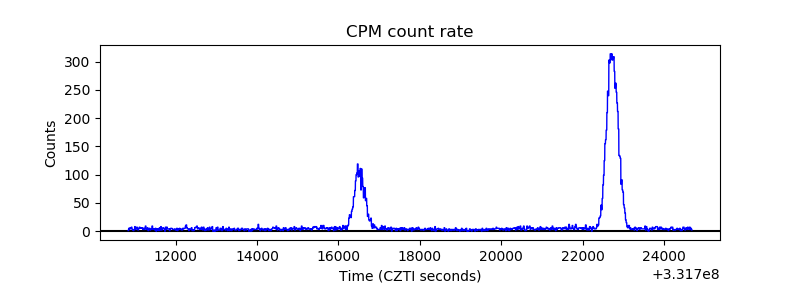 |
| CZT Counter | 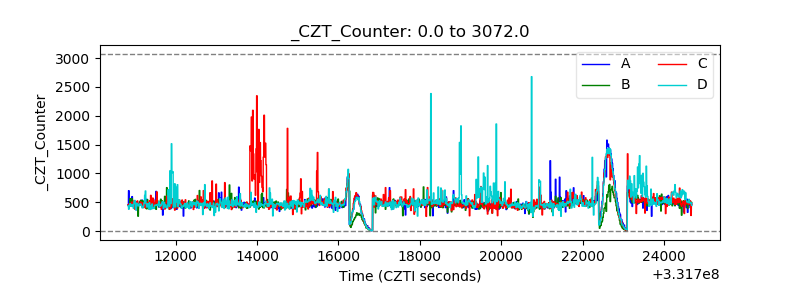 |
| +2.5 Volts monitor |  |
| +5 Volts monitor |  |
| _ROLL_ROT | 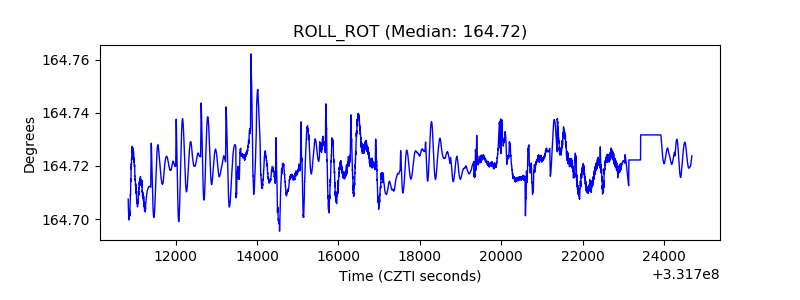 |
| _Roll_DEC | 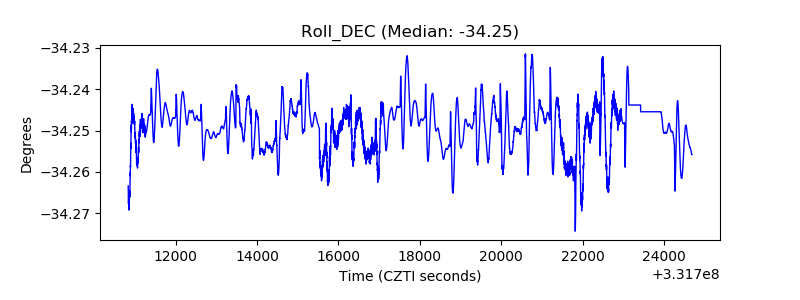 |
| _Roll_RA | 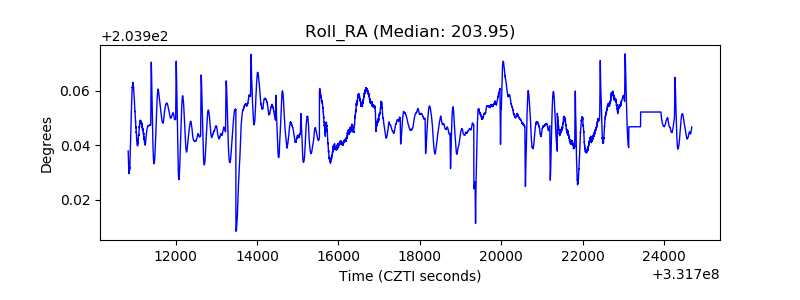 |
| Veto Counter | 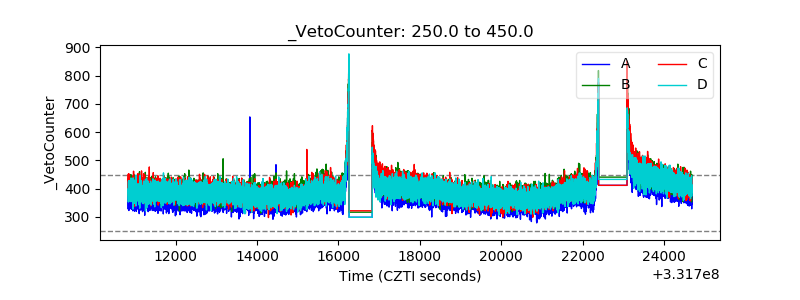 |