| Param | Original file | Final file |
|---|---|---|
| Filename | modeM0/AS1A07_068T01_9000003756_25803cztM0_level2.evt | modeM0/AS1A07_068T01_9000003756_25803cztM0_level2_quad_clean.evt |
| Size (bytes) | 471,430,080 | 97,490,880 |
| Size | 449.6 MB | 93.0 MB |
| Events in quadrant A | 3,046,409 | 651,790 |
| Events in quadrant B | 3,028,089 | 656,088 |
| Events in quadrant C | 3,091,186 | 621,938 |
| Events in quadrant D | 4,690,227 | 589,473 |
| Mode M0 | |||
|---|---|---|---|
| Quadrant | BADHDUFLAG | Total packets | Discarded packets |
| A | 0 | 12893 | 0 |
| B | 0 | 12905 | 0 |
| C | 0 | 13070 | 0 |
| D | 0 | 17848 | 0 |
| Mode M9 | |||
|---|---|---|---|
| Quadrant | BADHDUFLAG | Total packets | Discarded packets |
| A | 0 | 9 | 0 |
| B | 0 | 9 | 0 |
| C | 0 | 9 | 0 |
| D | 0 | 9 | 0 |
| Quadrant | Total seconds | Saturated seconds | Saturation percentage |
|---|---|---|---|
| A | 6203 | 56 | 0.902789% |
| B | 6204 | 71 | 1.144423% |
| C | 6204 | 102 | 1.644101% |
| D | 6204 | 498 | 8.027079% |
Noise dominated data is calculated using 1-second bins in cleaned event files. If a bin has >2000 counts, and if more than 50% of those come from <1% of pixels, then it is considered to be noise-dominated and hence unusable.
| Quadrant | # 1 sec bins | Bins with >0 counts | Bins with >2000 counts | High rate bins dominated by noise | Noise dominated (total time) | Noise dominated (detector-on time) | Marked lightcurve |
|---|---|---|---|---|---|---|---|
| A | 7083 | 6203 | 0 | 0 | 0.00% | 0.00% | 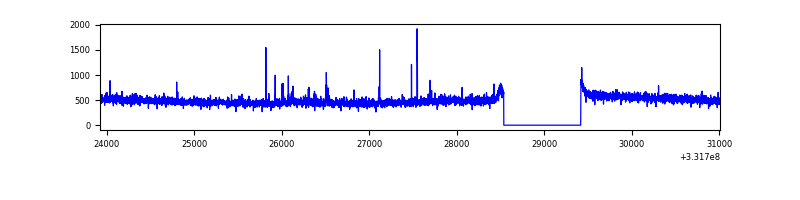 |
| B | 7084 | 6204 | 0 | 0 | 0.00% | 0.00% | 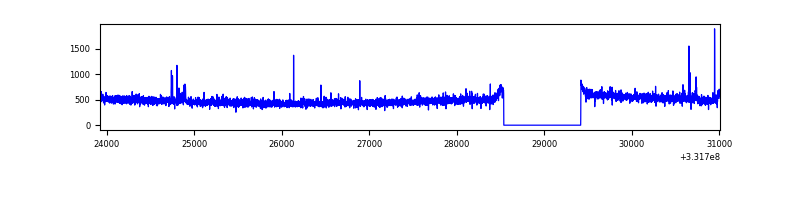 |
| C | 7084 | 6204 | 0 | 0 | 0.00% | 0.00% | 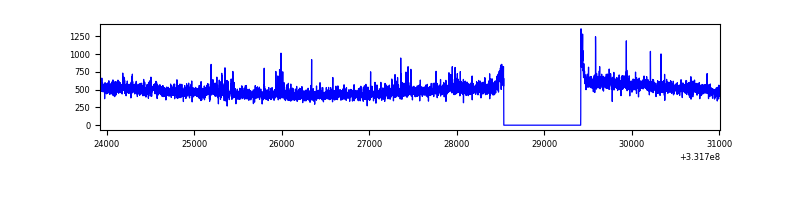 |
| D | 7084 | 6204 | 488 | 488 | 6.89% | 7.87% | 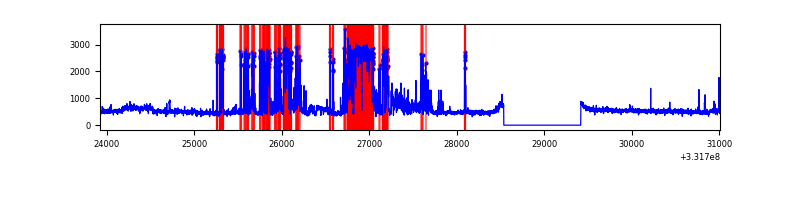 |
Top three noisy pixels from each quadrant. If the there are fewer than three noisy pixels in the level2.evt file, extra rows are filled as -1
| Pixel properties | Quadrant properties | ||||||
|---|---|---|---|---|---|---|---|
| Quadrant | DetID | PixID | Counts | Sigma | Mean | Median | Sigma |
| A | 0 | 13 | 61169 | 384.74 | 773 | 754 | 157.0 |
| A | 13 | 254 | 8624 | 50.12 | 773 | 754 | 157.0 |
| A | 3 | 137 | 7226 | 41.22 | 773 | 754 | 157.0 |
| B | 0 | 190 | 23810 | 156.93 | 760 | 741 | 147.0 |
| B | 12 | 111 | 18014 | 117.5 | 760 | 741 | 147.0 |
| B | 11 | 111 | 16361 | 106.26 | 760 | 741 | 147.0 |
| C | 3 | 233 | 124202 | 720.45 | 731 | 735 | 171.4 |
| C | 14 | 238 | 117011 | 678.49 | 731 | 735 | 171.4 |
| C | 13 | 61 | 5079 | 25.35 | 731 | 735 | 171.4 |
| D | 7 | 80 | 1719954 | 9950.78 | 725 | 707 | 172.8 |
| D | 8 | 195 | 89590 | 514.44 | 725 | 707 | 172.8 |
| D | 1 | 52 | 80478 | 461.7 | 725 | 707 | 172.8 |
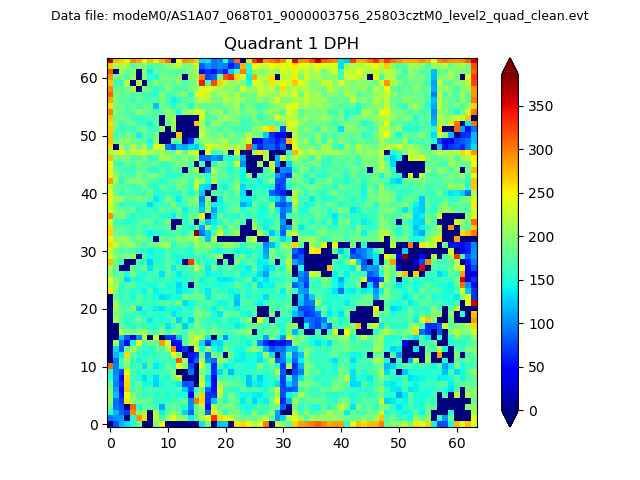
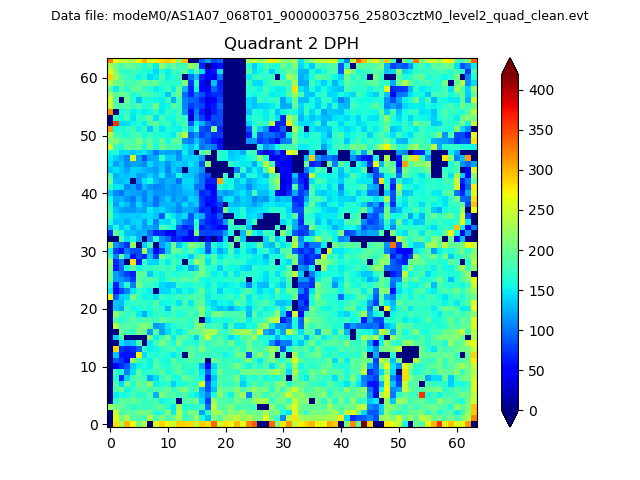
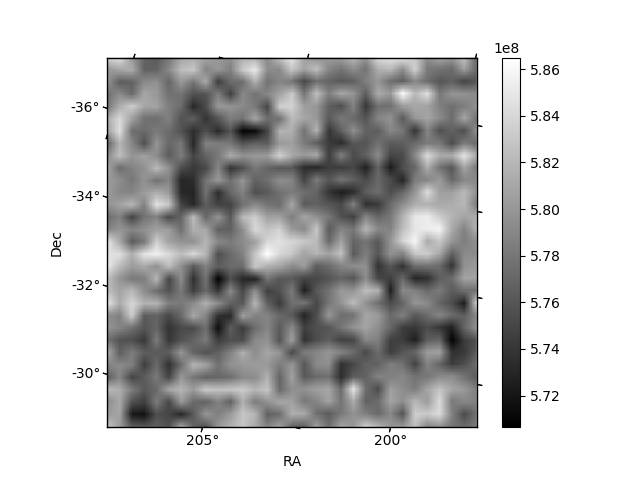
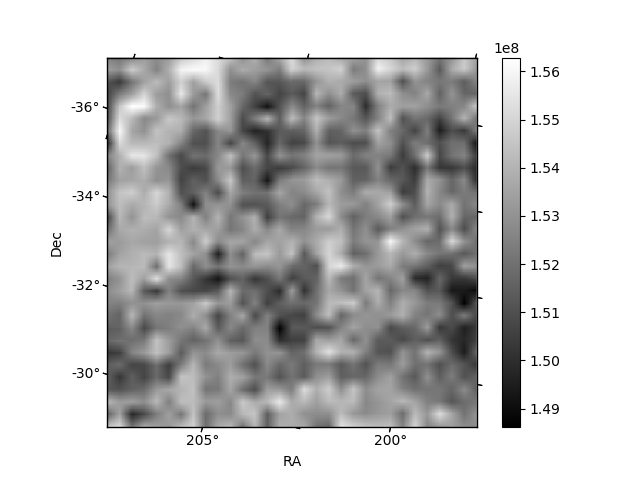
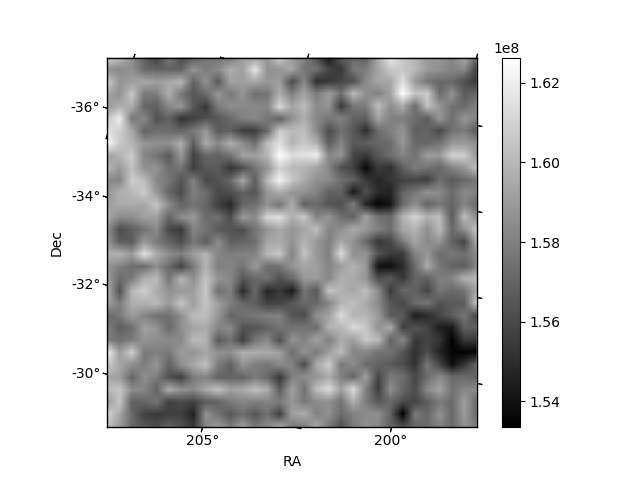
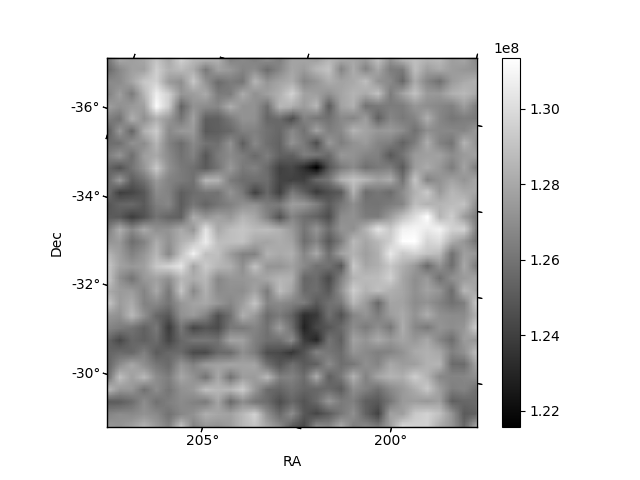
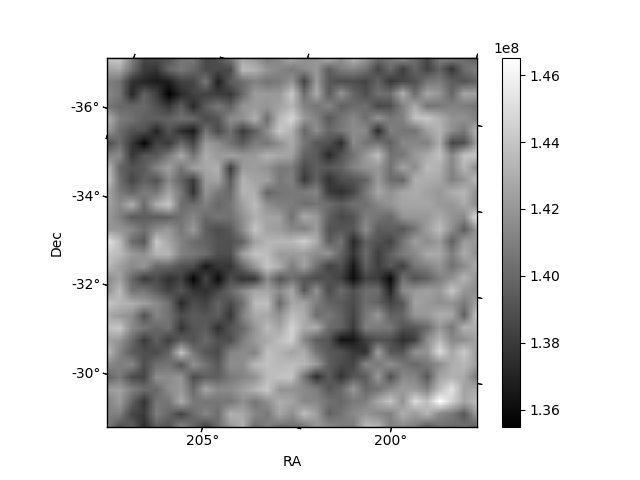
Histogram calculated using DETX and DETY for each event in the final _common_clean file
| Quadrant A |  |
 |
Quadrant B |
|---|---|---|---|
| Quadrant D | 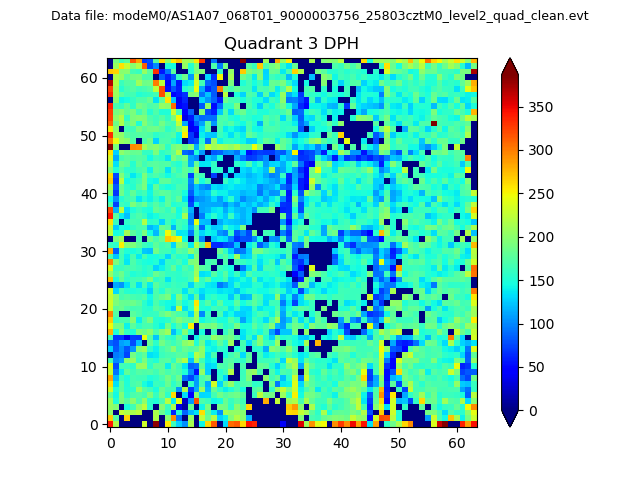 |
 |
Quadrant C |
| Plot type | Count rate plots | Images |
|---|---|---|
| Comparison with Poisson distribution Blue bars denote a histogram of data divided into 1 sec bins. Red curve is a Poisson curve with rate = median count rate of data. |
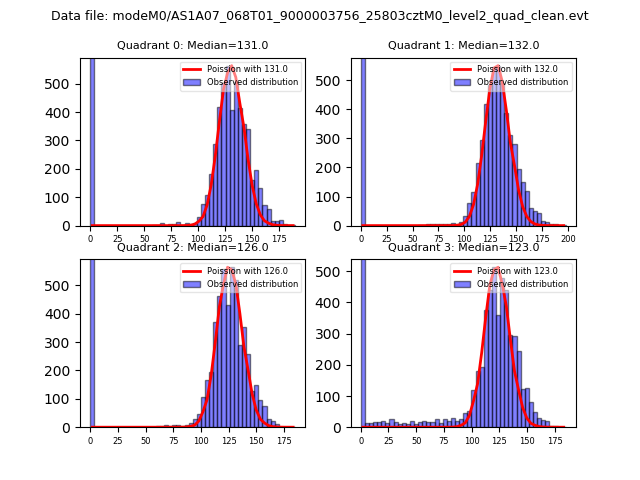 |
 |
| Quadrant-wise count rates Data is divided into 100 sec bins |
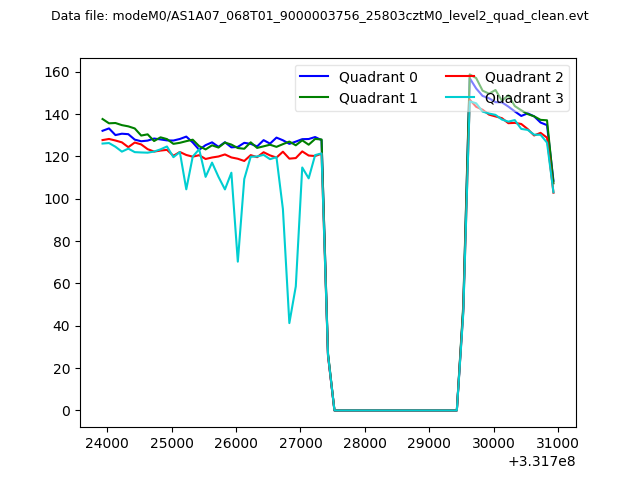 |
|
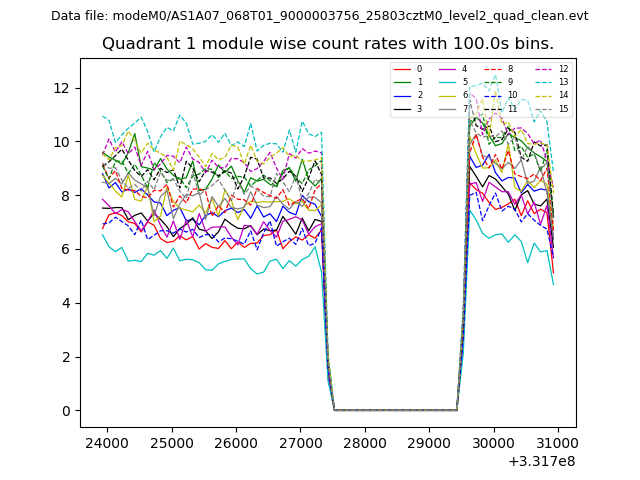
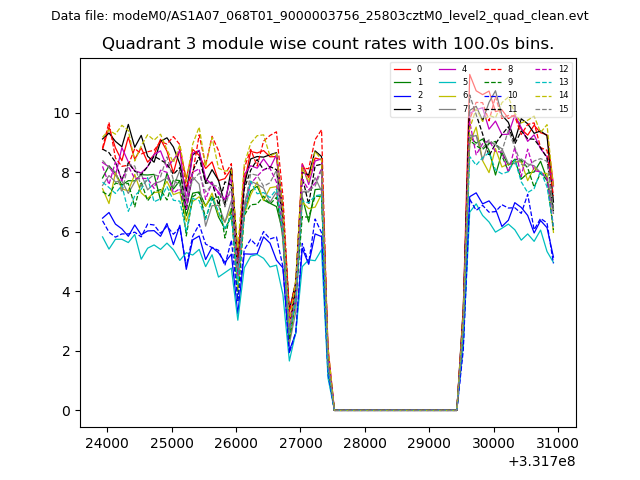
| Module-wise count rates for Quadrant A Data is divided into 100 sec bins |
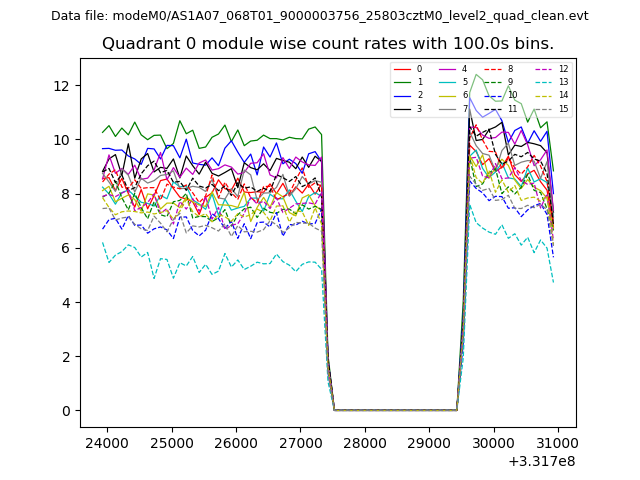 |
 |
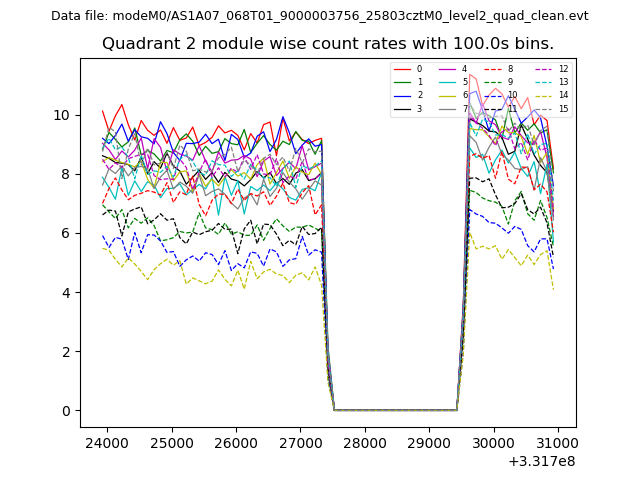
| Module-wise count rates for Quadrant B Data is divided into 100 sec bins |
 |
 |
| Module-wise count rates for Quadrant C Data is divided into 100 sec bins |
 |
 |
| Module-wise count rates for Quadrant D Data is divided into 100 sec bins |
 |
 |
| Parameter | Plot |
|---|---|
| CZT HV Monitor | 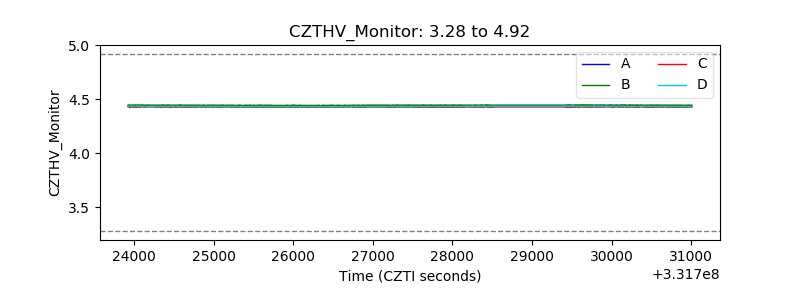 |
| D_VDD | 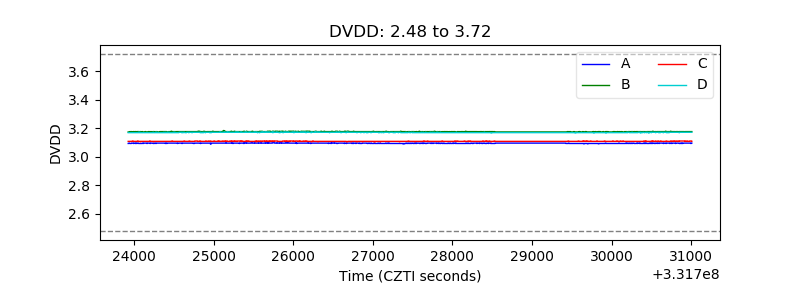 |
| Temperature 1 | 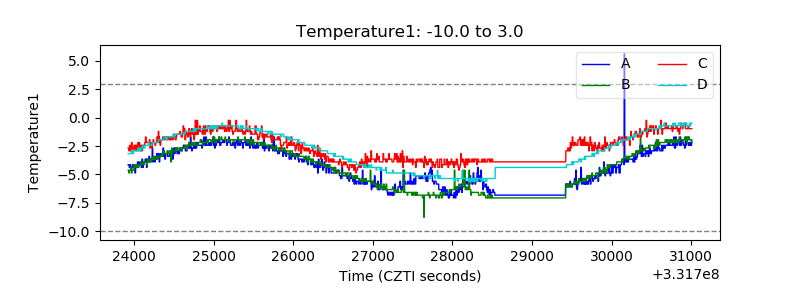 |
| Veto HV Monitor | 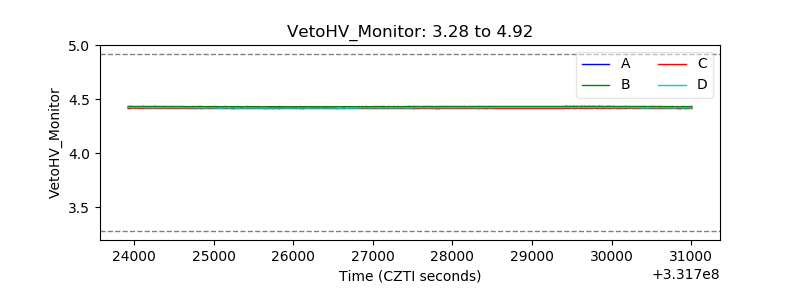 |
| Veto LLD | 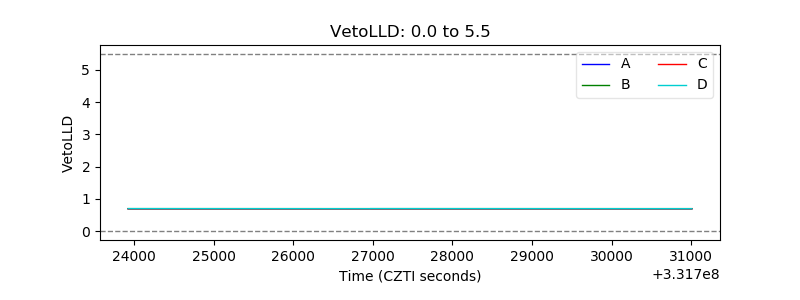 |
| Alpha Counter | 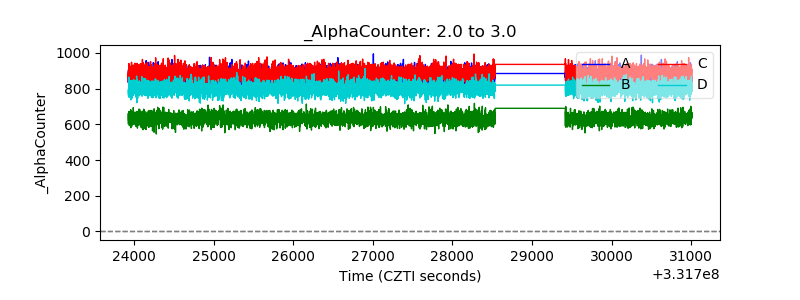 |
| _CPM_Rate |  |
| CZT Counter | 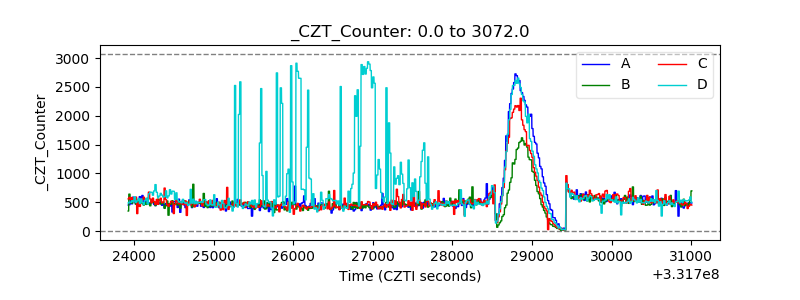 |
| +2.5 Volts monitor | 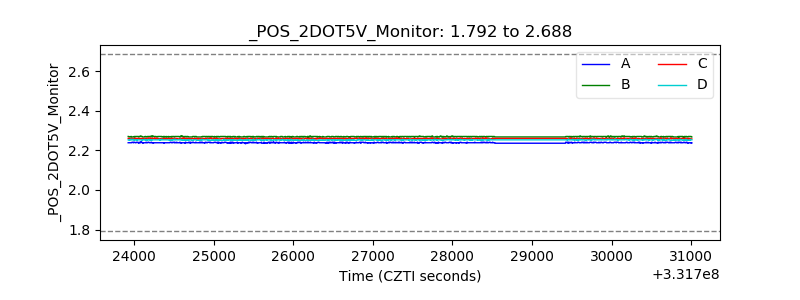 |
| +5 Volts monitor | 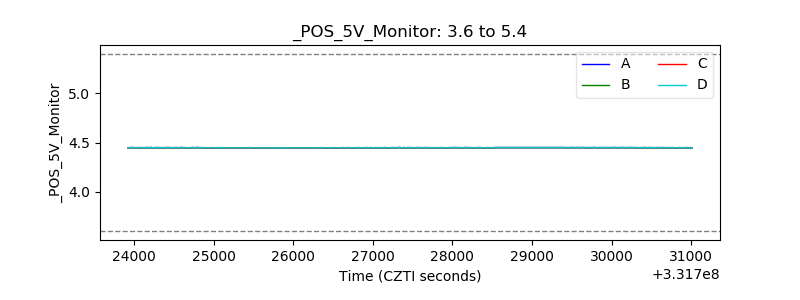 |
| _ROLL_ROT |  |
| _Roll_DEC | 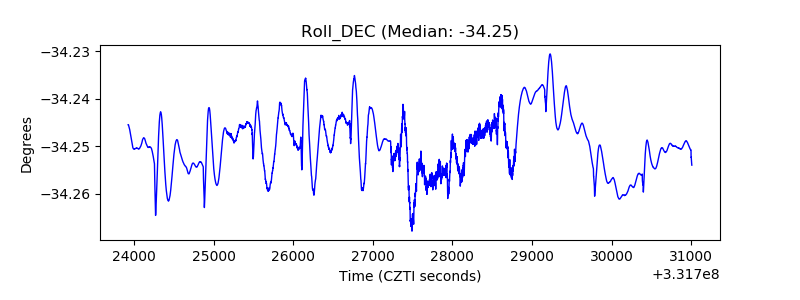 |
| _Roll_RA | 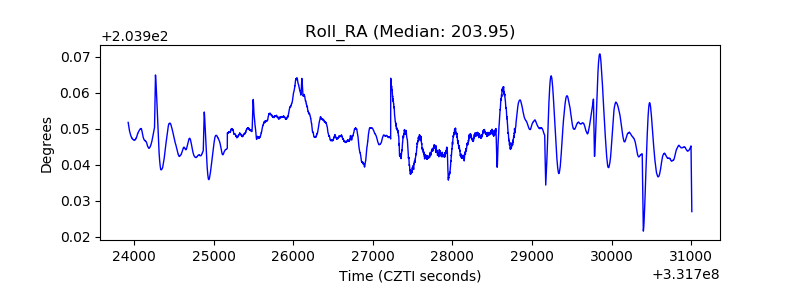 |
| Veto Counter | 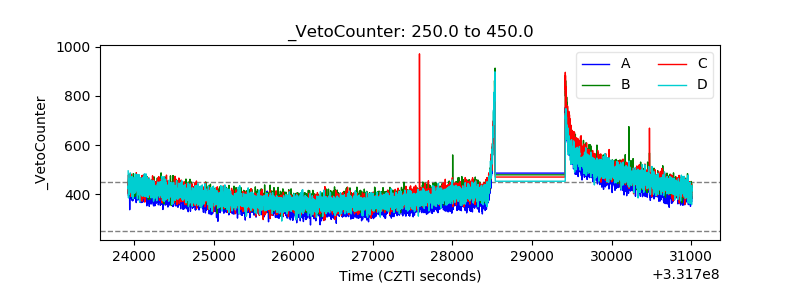 |