| Param | Original file | Final file |
|---|---|---|
| Filename | modeM0/AS1A07_068T01_9000003756_25804cztM0_level2.evt | modeM0/AS1A07_068T01_9000003756_25804cztM0_level2_quad_clean.evt |
| Size (bytes) | 395,187,840 | 93,208,320 |
| Size | 376.9 MB | 88.9 MB |
| Events in quadrant A | 3,040,498 | 622,460 |
| Events in quadrant B | 2,869,796 | 618,394 |
| Events in quadrant C | 2,839,312 | 584,751 |
| Events in quadrant D | 2,825,019 | 592,855 |
| Mode M0 | |||
|---|---|---|---|
| Quadrant | BADHDUFLAG | Total packets | Discarded packets |
| A | 0 | 12888 | 0 |
| B | 0 | 12249 | 0 |
| C | 0 | 12237 | 0 |
| D | 0 | 12281 | 0 |
| Mode M9 | |||
|---|---|---|---|
| Quadrant | BADHDUFLAG | Total packets | Discarded packets |
| A | 0 | 11 | 0 |
| B | 0 | 11 | 0 |
| C | 0 | 11 | 0 |
| D | 0 | 11 | 0 |
| Quadrant | Total seconds | Saturated seconds | Saturation percentage |
|---|---|---|---|
| A | 5788 | 50 | 0.863856% |
| B | 5789 | 56 | 0.967352% |
| C | 5789 | 64 | 1.105545% |
| D | 5789 | 43 | 0.742788% |
Noise dominated data is calculated using 1-second bins in cleaned event files. If a bin has >2000 counts, and if more than 50% of those come from <1% of pixels, then it is considered to be noise-dominated and hence unusable.
| Quadrant | # 1 sec bins | Bins with >0 counts | Bins with >2000 counts | High rate bins dominated by noise | Noise dominated (total time) | Noise dominated (detector-on time) | Marked lightcurve |
|---|---|---|---|---|---|---|---|
| A | 6843 | 5788 | 5 | 5 | 0.07% | 0.09% | 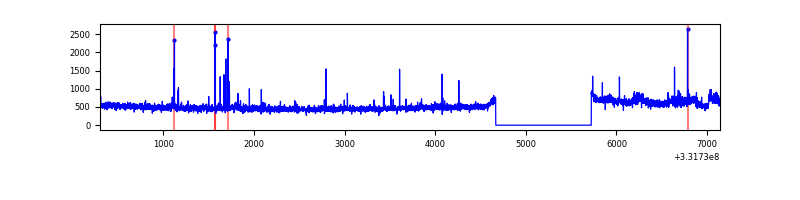 |
| B | 6844 | 5789 | 2 | 2 | 0.03% | 0.03% | 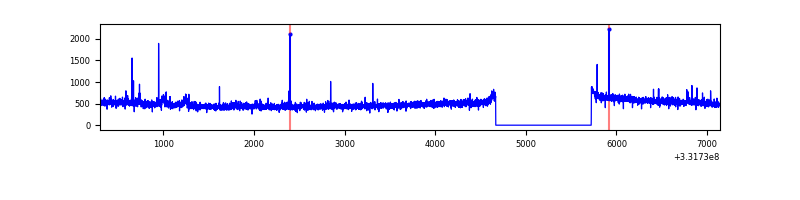 |
| C | 6844 | 5789 | 2 | 2 | 0.03% | 0.03% | 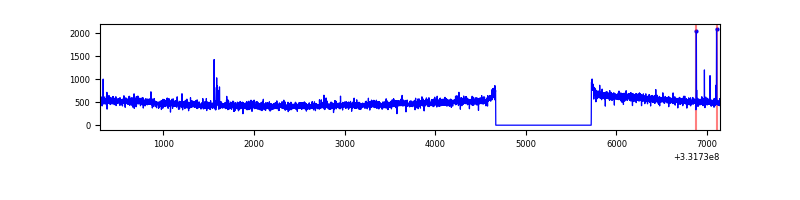 |
| D | 6844 | 5789 | 12 | 12 | 0.18% | 0.21% | 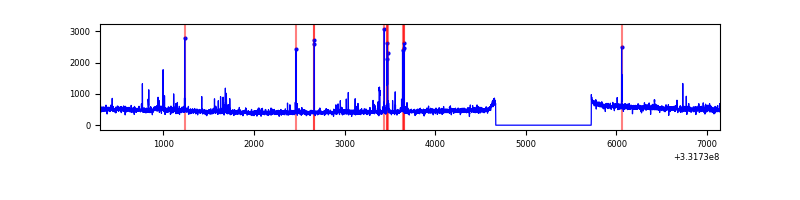 |
Top three noisy pixels from each quadrant. If the there are fewer than three noisy pixels in the level2.evt file, extra rows are filled as -1
| Pixel properties | Quadrant properties | ||||||
|---|---|---|---|---|---|---|---|
| Quadrant | DetID | PixID | Counts | Sigma | Mean | Median | Sigma |
| A | 0 | 13 | 209731 | 1421.97 | 732 | 718 | 147.0 |
| A | 13 | 254 | 8712 | 54.39 | 732 | 718 | 147.0 |
| A | 3 | 1 | 7976 | 49.38 | 732 | 718 | 147.0 |
| B | 0 | 190 | 30387 | 215.19 | 718 | 701 | 138.0 |
| B | 12 | 111 | 16788 | 116.61 | 718 | 701 | 138.0 |
| B | 11 | 111 | 14946 | 103.26 | 718 | 701 | 138.0 |
| C | 14 | 238 | 111352 | 692.15 | 687 | 689 | 159.9 |
| C | 3 | 233 | 29021 | 177.2 | 687 | 689 | 159.9 |
| C | 0 | 207 | 23106 | 140.21 | 687 | 689 | 159.9 |
| D | 7 | 80 | 57681 | 335.7 | 706 | 691 | 169.8 |
| D | 1 | 52 | 38344 | 221.79 | 706 | 691 | 169.8 |
| D | 2 | 234 | 25794 | 147.87 | 706 | 691 | 169.8 |
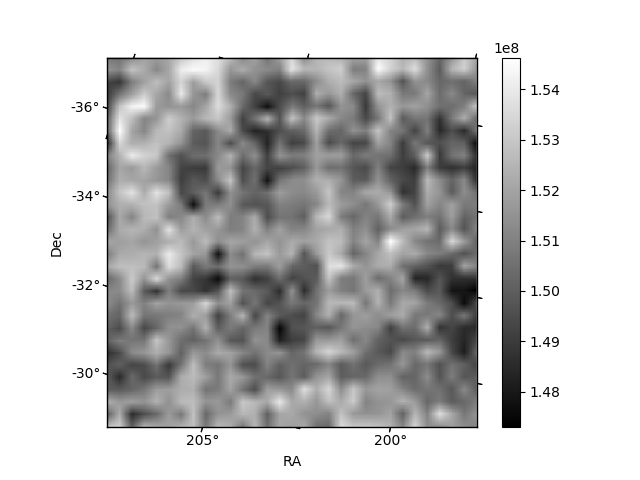
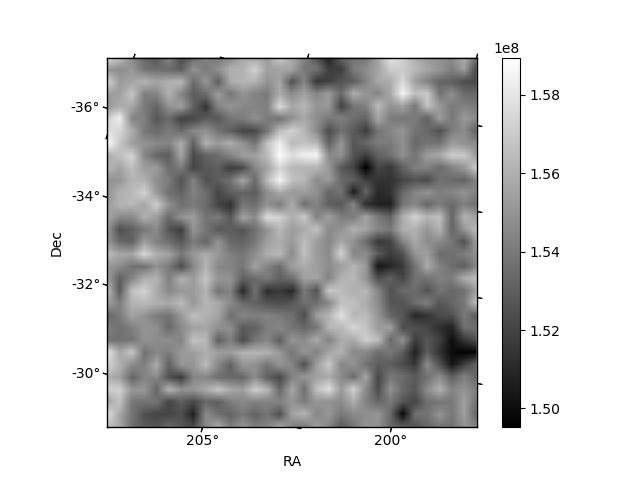
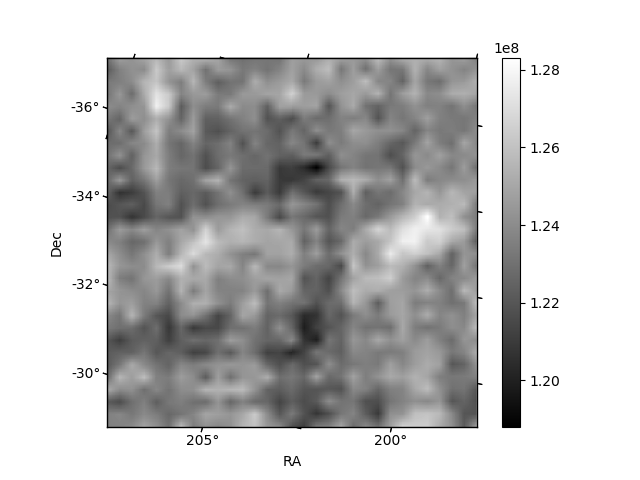
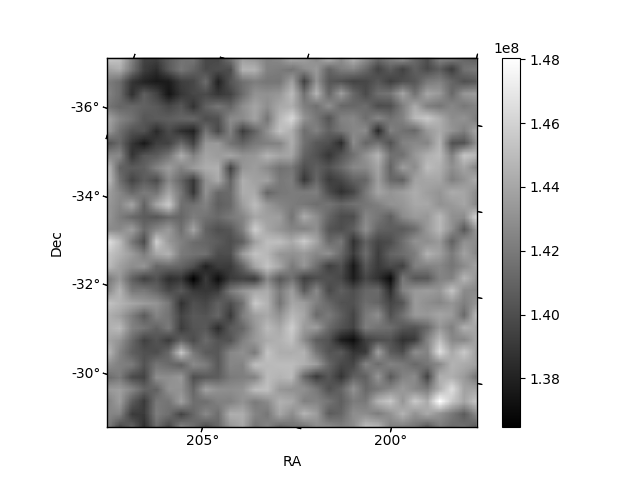
Histogram calculated using DETX and DETY for each event in the final _common_clean file
| Quadrant A |  |
 |
Quadrant B |
|---|---|---|---|
| Quadrant D |  |
 |
Quadrant C |
| Plot type | Count rate plots | Images |
|---|---|---|
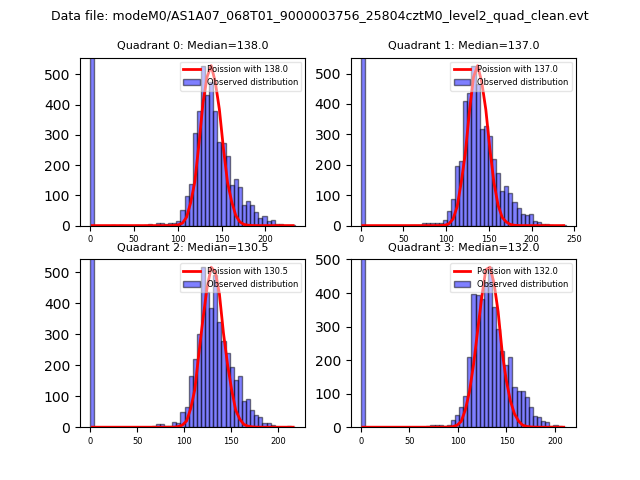
| Comparison with Poisson distribution Blue bars denote a histogram of data divided into 1 sec bins. Red curve is a Poisson curve with rate = median count rate of data. |
 |
 |
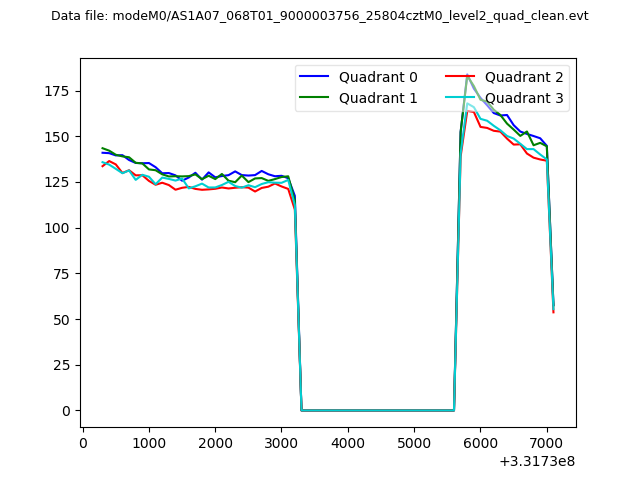
| Quadrant-wise count rates Data is divided into 100 sec bins |
 |
|
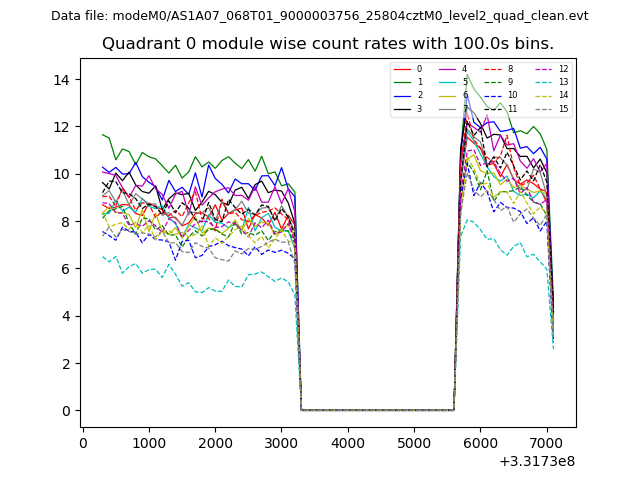
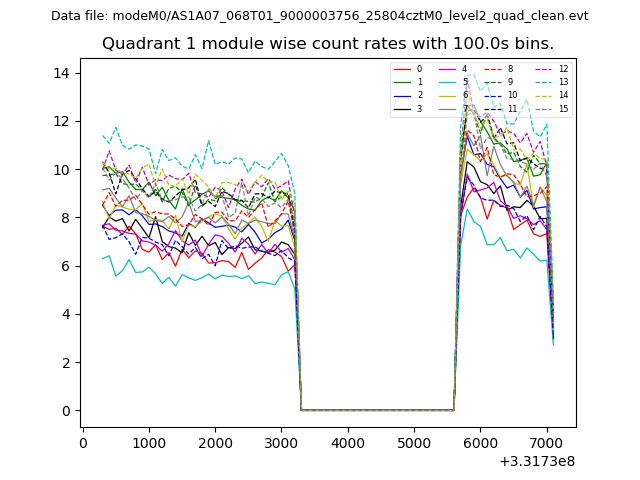
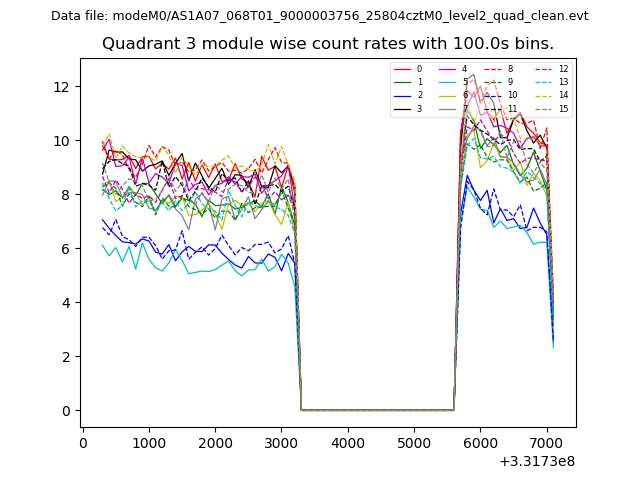
| Module-wise count rates for Quadrant A Data is divided into 100 sec bins |
 |
 |
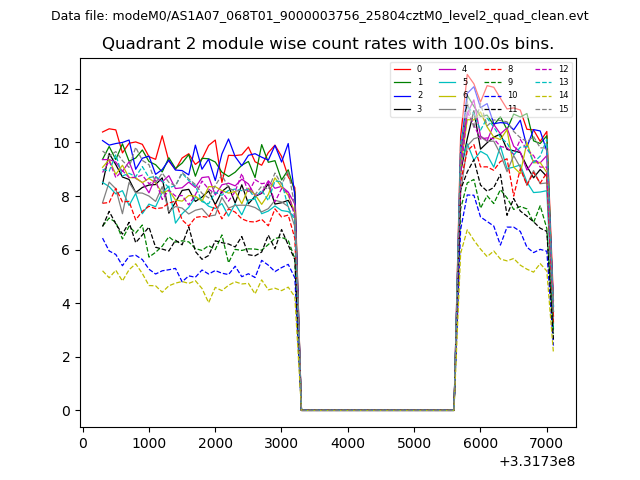
| Module-wise count rates for Quadrant B Data is divided into 100 sec bins |
 |
 |
| Module-wise count rates for Quadrant C Data is divided into 100 sec bins |
 |
 |
| Module-wise count rates for Quadrant D Data is divided into 100 sec bins |
 |
 |
| Parameter | Plot |
|---|---|
| CZT HV Monitor | 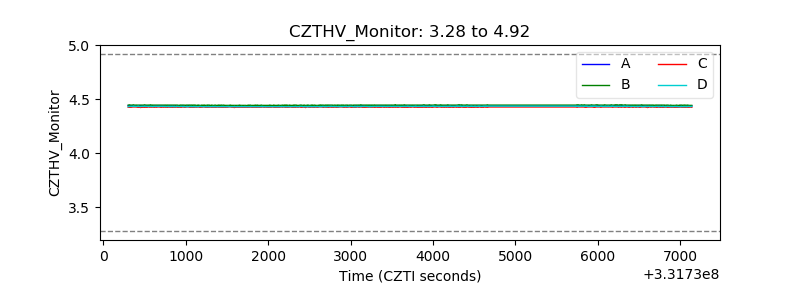 |
| D_VDD | 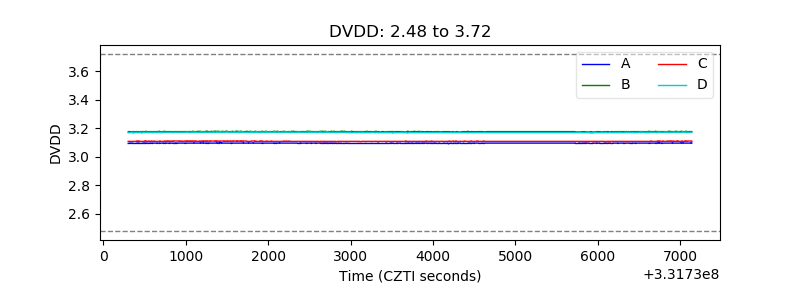 |
| Temperature 1 | 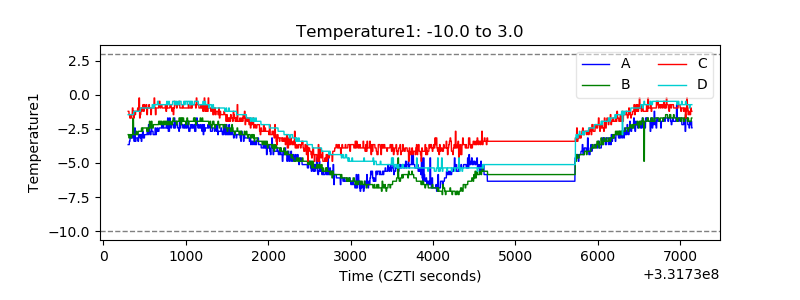 |
| Veto HV Monitor | 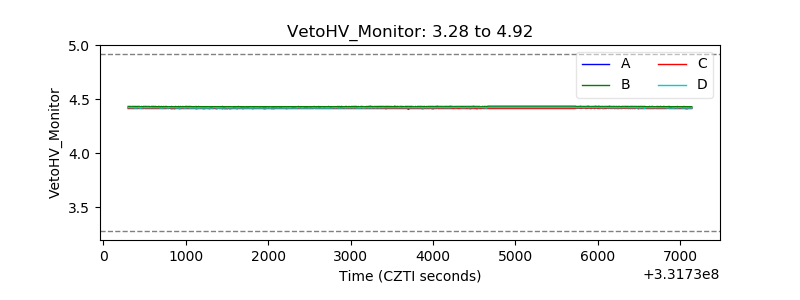 |
| Veto LLD | 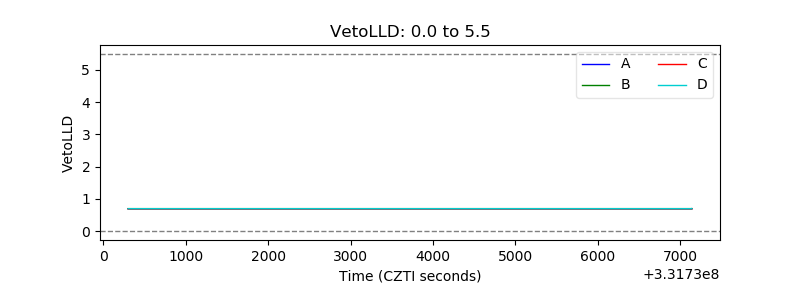 |
| Alpha Counter | 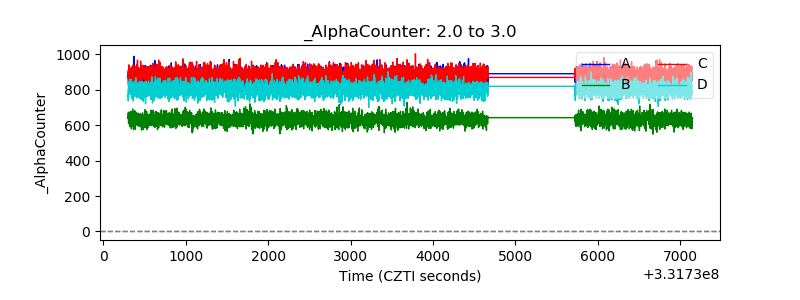 |
| _CPM_Rate | 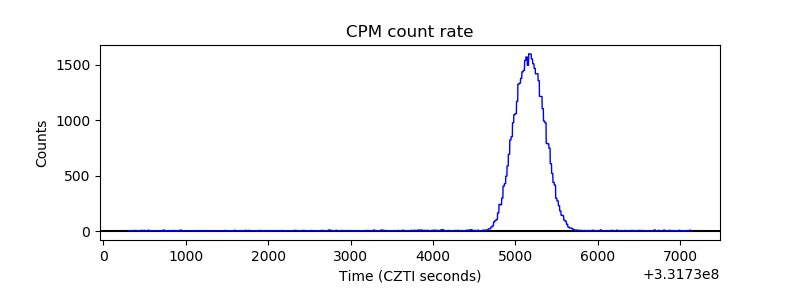 |
| CZT Counter | 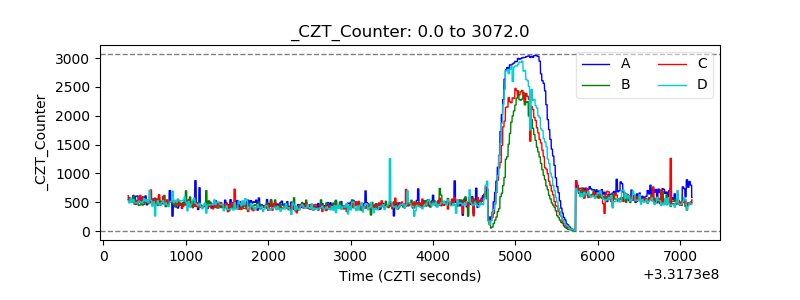 |
| +2.5 Volts monitor |  |
| +5 Volts monitor |  |
| _ROLL_ROT | 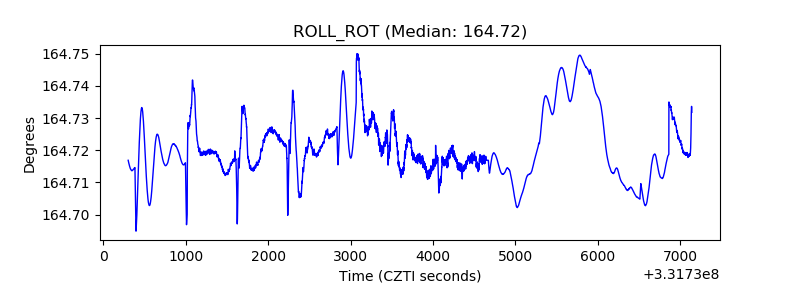 |
| _Roll_DEC | 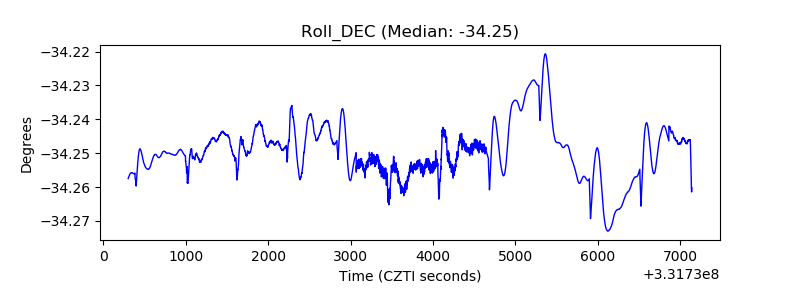 |
| _Roll_RA | 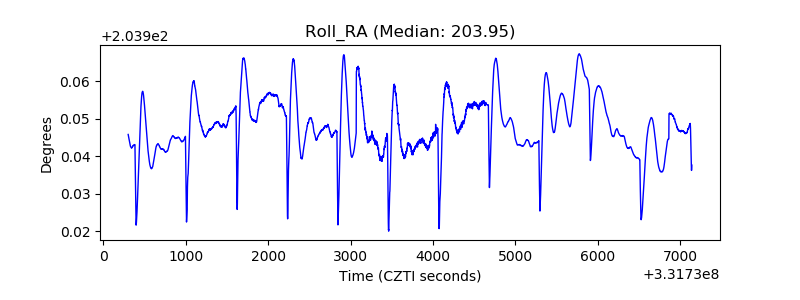 |
| Veto Counter | 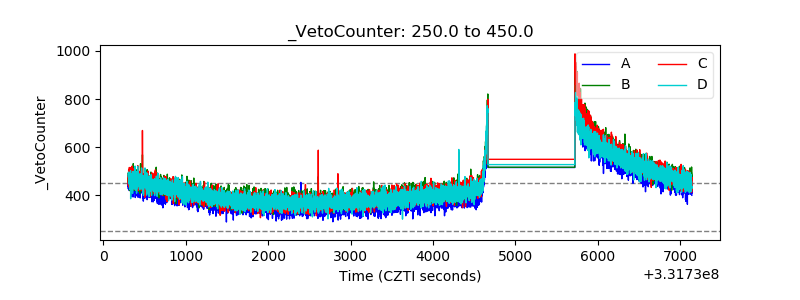 |