| Param | Original file | Final file |
|---|---|---|
| Filename | modeM0/AS1A07_068T01_9000003756_25806cztM0_level2.evt | modeM0/AS1A07_068T01_9000003756_25806cztM0_level2_quad_clean.evt |
| Size (bytes) | 478,895,040 | 99,685,440 |
| Size | 456.7 MB | 95.1 MB |
| Events in quadrant A | 4,518,492 | 650,569 |
| Events in quadrant B | 3,157,941 | 672,740 |
| Events in quadrant C | 3,107,214 | 627,175 |
| Events in quadrant D | 3,302,240 | 639,065 |
| Mode M0 | |||
|---|---|---|---|
| Quadrant | BADHDUFLAG | Total packets | Discarded packets |
| A | 0 | 17660 | 0 |
| B | 0 | 13298 | 0 |
| C | 0 | 13225 | 0 |
| D | 0 | 13841 | 0 |
| Mode M9 | |||
|---|---|---|---|
| Quadrant | BADHDUFLAG | Total packets | Discarded packets |
| A | 0 | 12 | 0 |
| B | 0 | 12 | 0 |
| C | 0 | 12 | 0 |
| D | 0 | 12 | 0 |
| Quadrant | Total seconds | Saturated seconds | Saturation percentage |
|---|---|---|---|
| A | 6152 | 425 | 6.908322% |
| B | 6152 | 74 | 1.202861% |
| C | 6152 | 88 | 1.430429% |
| D | 6152 | 118 | 1.918075% |
Noise dominated data is calculated using 1-second bins in cleaned event files. If a bin has >2000 counts, and if more than 50% of those come from <1% of pixels, then it is considered to be noise-dominated and hence unusable.
| Quadrant | # 1 sec bins | Bins with >0 counts | Bins with >2000 counts | High rate bins dominated by noise | Noise dominated (total time) | Noise dominated (detector-on time) | Marked lightcurve |
|---|---|---|---|---|---|---|---|
| A | 7317 | 6152 | 294 | 294 | 4.02% | 4.78% | 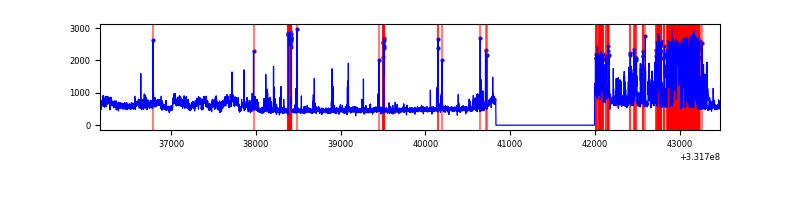 |
| B | 7317 | 6152 | 6 | 6 | 0.08% | 0.10% | 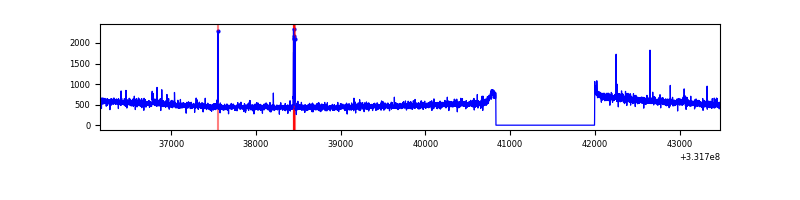 |
| C | 7317 | 6152 | 2 | 2 | 0.03% | 0.03% | 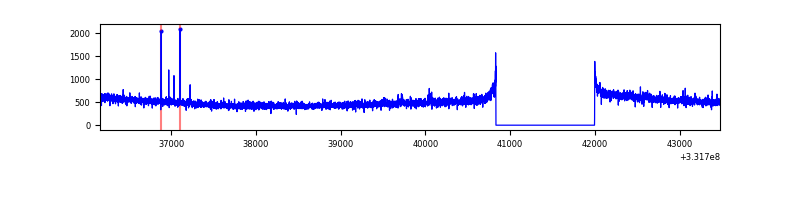 |
| D | 7317 | 6152 | 71 | 71 | 0.97% | 1.15% | 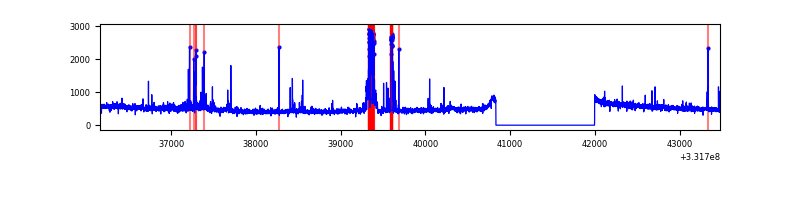 |
Top three noisy pixels from each quadrant. If the there are fewer than three noisy pixels in the level2.evt file, extra rows are filled as -1
| Pixel properties | Quadrant properties | ||||||
|---|---|---|---|---|---|---|---|
| Quadrant | DetID | PixID | Counts | Sigma | Mean | Median | Sigma |
| A | 0 | 13 | 1462768 | 9185.37 | 791 | 777 | 159.2 |
| A | 11 | 29 | 10361 | 60.21 | 791 | 777 | 159.2 |
| A | 13 | 254 | 9181 | 52.8 | 791 | 777 | 159.2 |
| B | 10 | 247 | 21851 | 142.27 | 786 | 769 | 148.2 |
| B | 0 | 219 | 20567 | 133.61 | 786 | 769 | 148.2 |
| B | 0 | 190 | 19328 | 125.24 | 786 | 769 | 148.2 |
| C | 14 | 238 | 122661 | 703.37 | 747 | 751 | 173.3 |
| C | 3 | 233 | 51027 | 290.07 | 747 | 751 | 173.3 |
| C | 0 | 207 | 16914 | 93.25 | 747 | 751 | 173.3 |
| D | 7 | 80 | 277033 | 1493.41 | 771 | 754 | 185.0 |
| D | 1 | 52 | 44717 | 237.64 | 771 | 754 | 185.0 |
| D | 10 | 230 | 40558 | 215.16 | 771 | 754 | 185.0 |
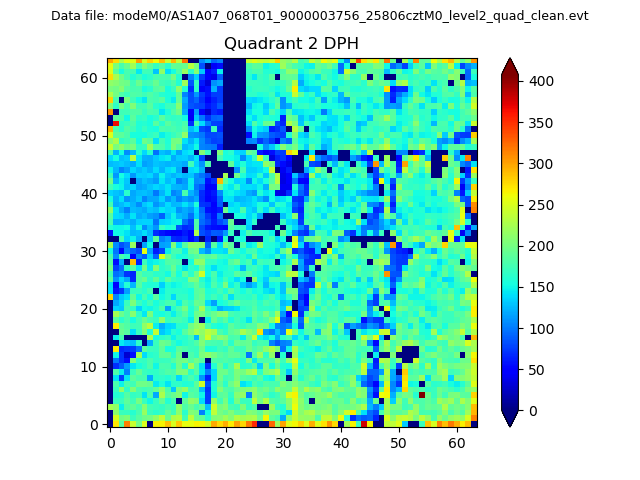
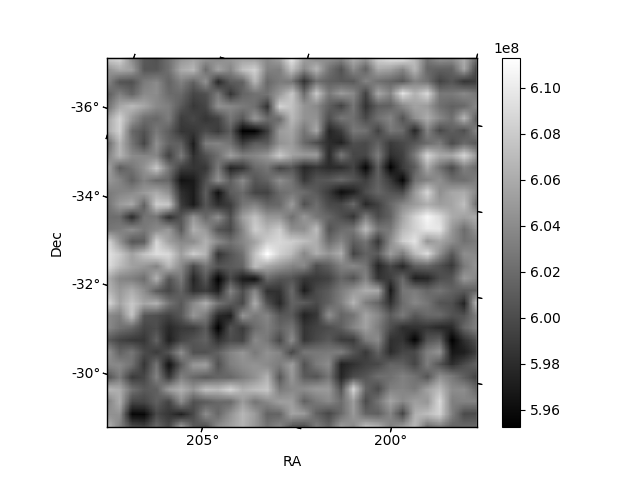
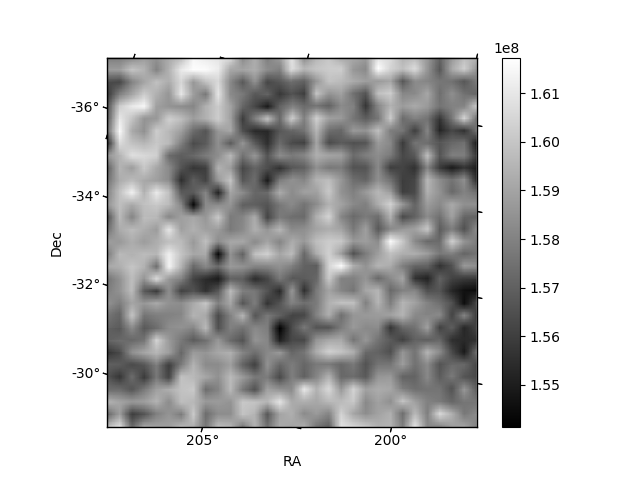
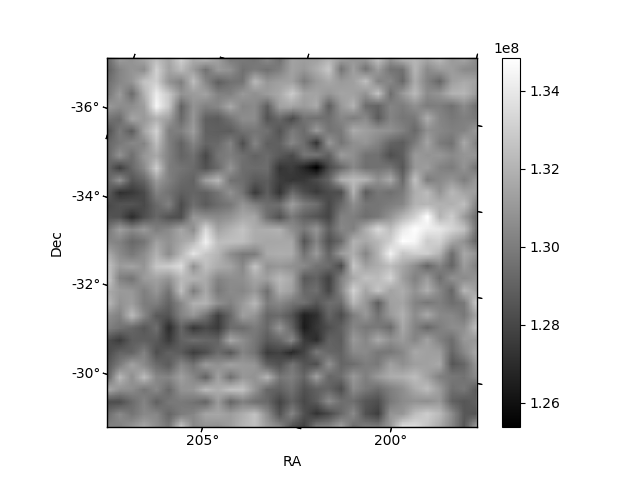
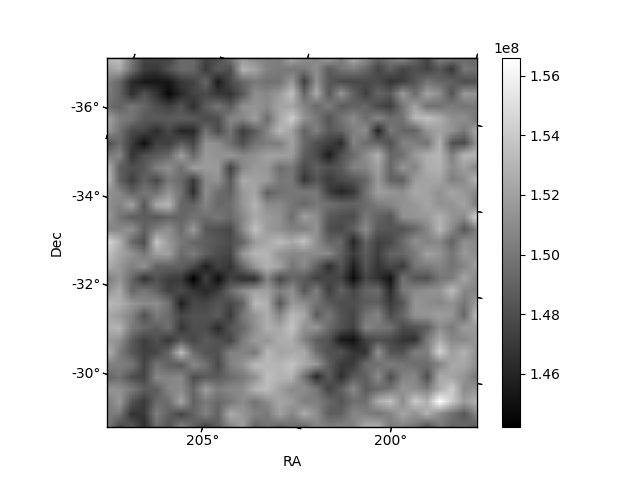
Histogram calculated using DETX and DETY for each event in the final _common_clean file
| Quadrant A | 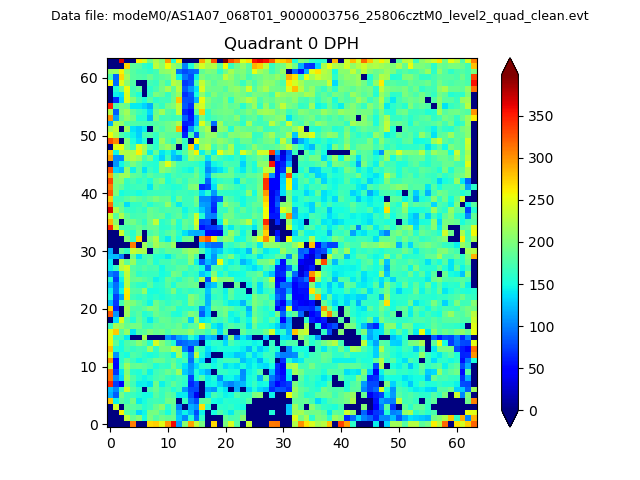 |
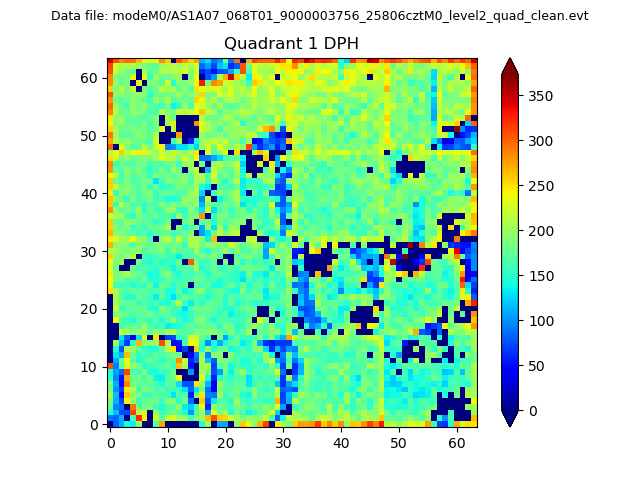 |
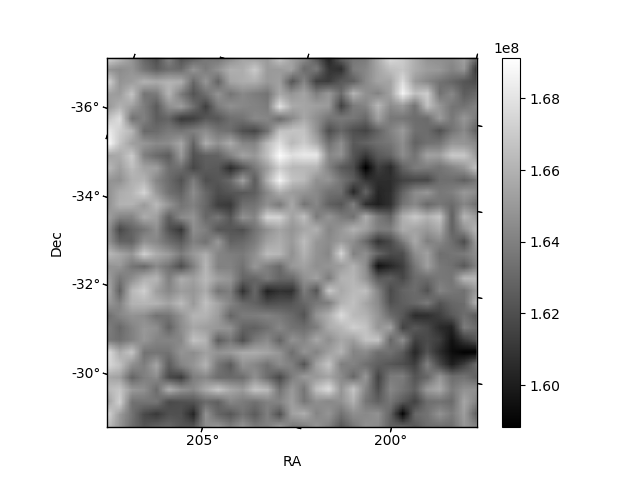
Quadrant B |
|---|---|---|---|
| Quadrant D | 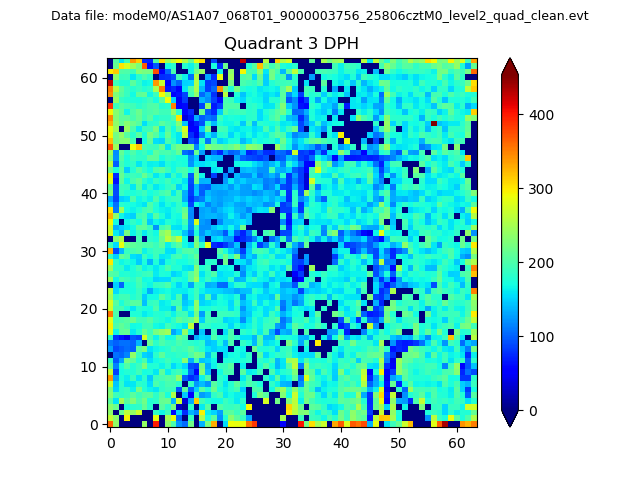 |
 |
Quadrant C |
| Plot type | Count rate plots | Images |
|---|---|---|
| Comparison with Poisson distribution Blue bars denote a histogram of data divided into 1 sec bins. Red curve is a Poisson curve with rate = median count rate of data. |
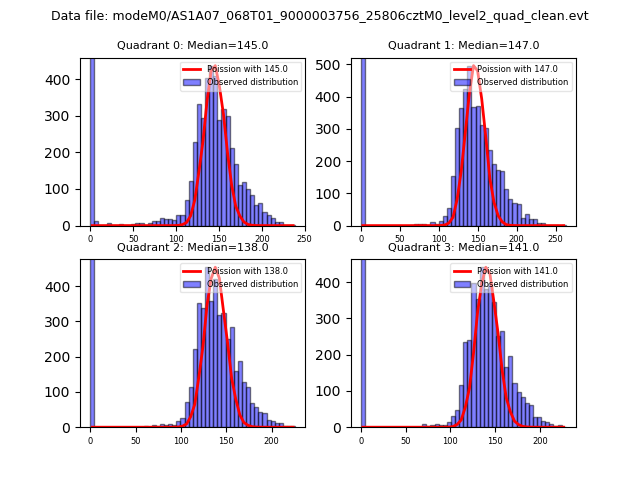 |
 |
| Quadrant-wise count rates Data is divided into 100 sec bins |
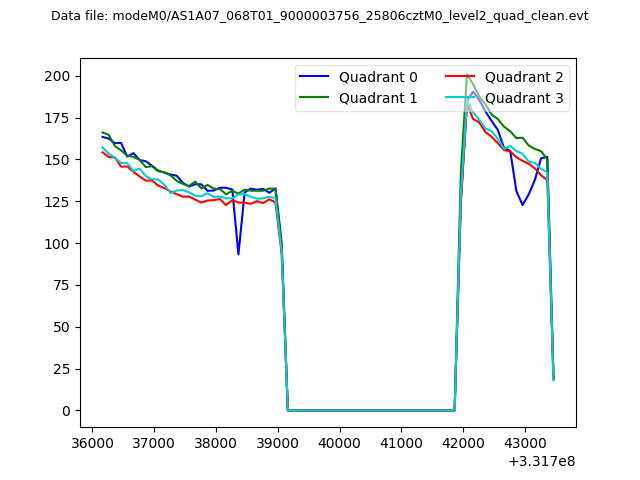 |
|
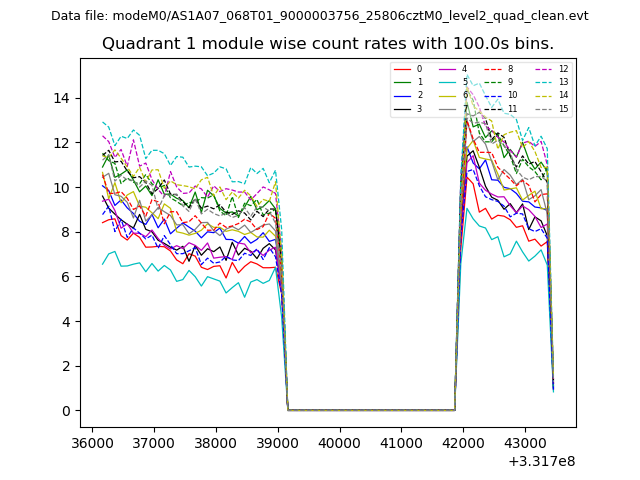
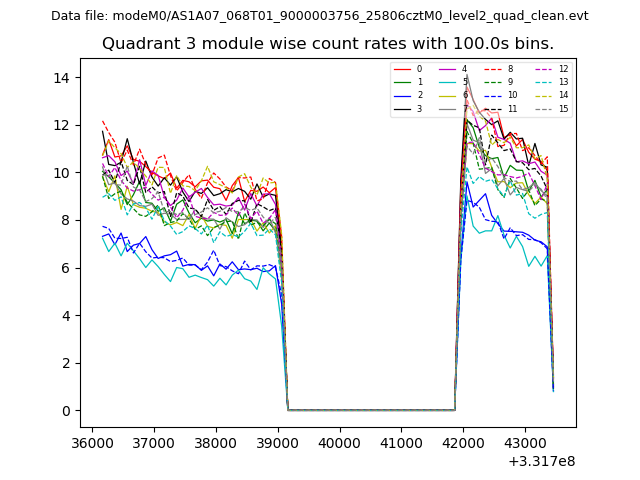
| Module-wise count rates for Quadrant A Data is divided into 100 sec bins |
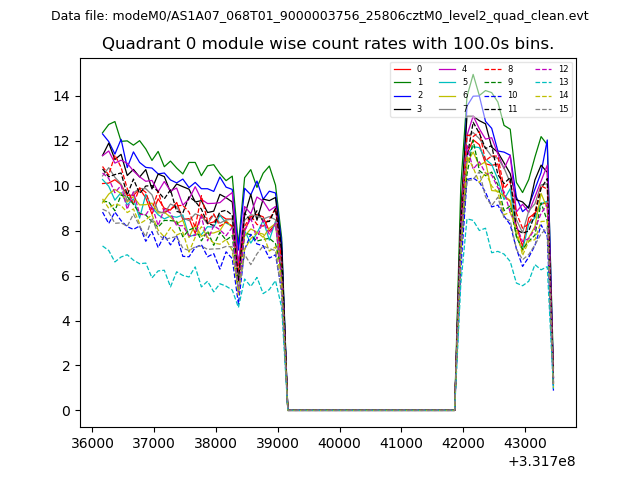 |
 |
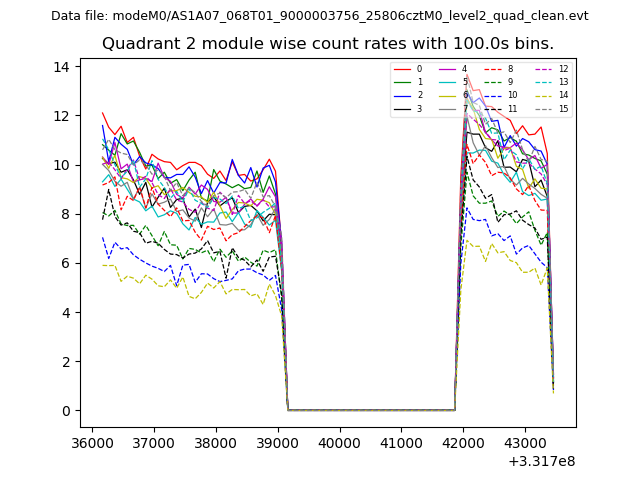
| Module-wise count rates for Quadrant B Data is divided into 100 sec bins |
 |
 |
| Module-wise count rates for Quadrant C Data is divided into 100 sec bins |
 |
 |
| Module-wise count rates for Quadrant D Data is divided into 100 sec bins |
 |
 |
| Parameter | Plot |
|---|---|
| CZT HV Monitor | 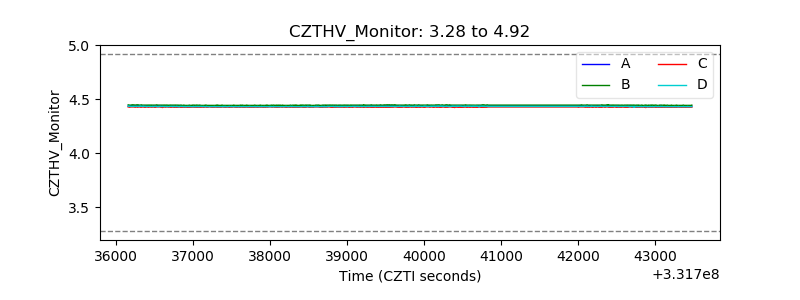 |
| D_VDD | 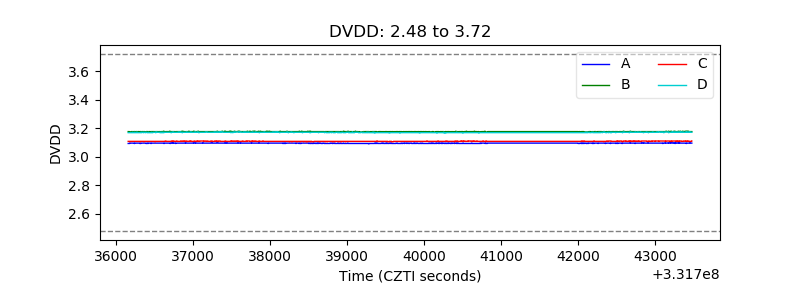 |
| Temperature 1 | 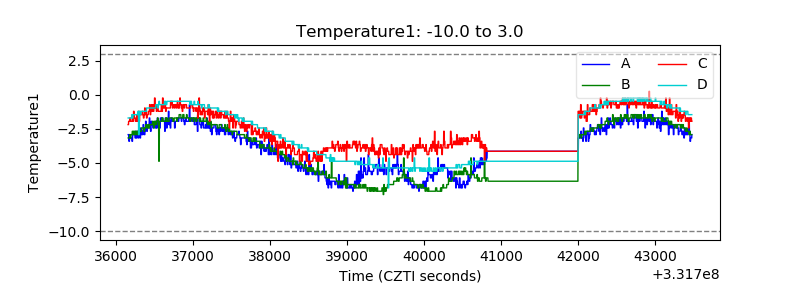 |
| Veto HV Monitor | 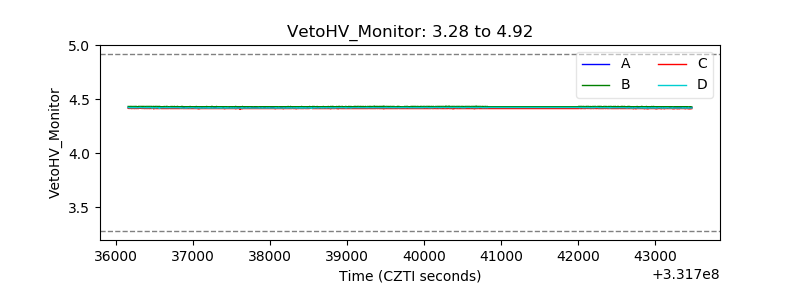 |
| Veto LLD | 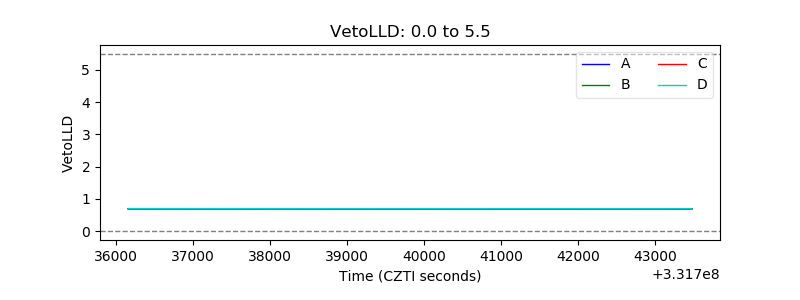 |
| Alpha Counter | 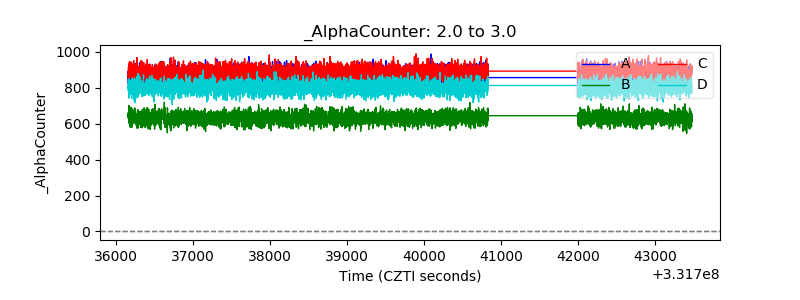 |
| _CPM_Rate | 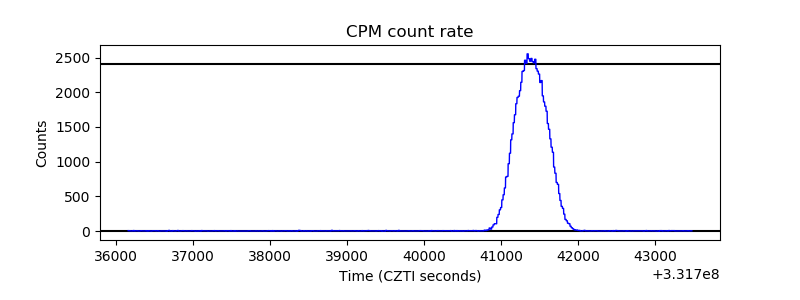 |
| CZT Counter | 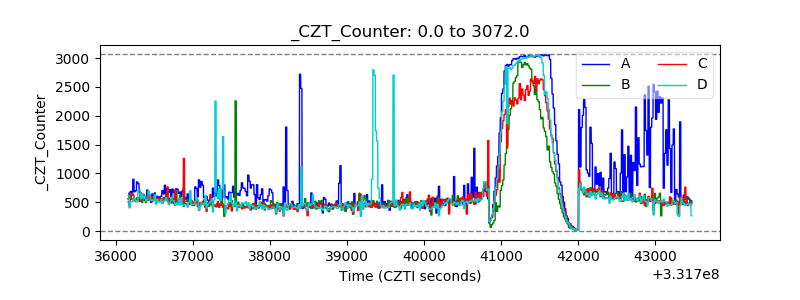 |
| +2.5 Volts monitor |  |
| +5 Volts monitor |  |
| _ROLL_ROT | 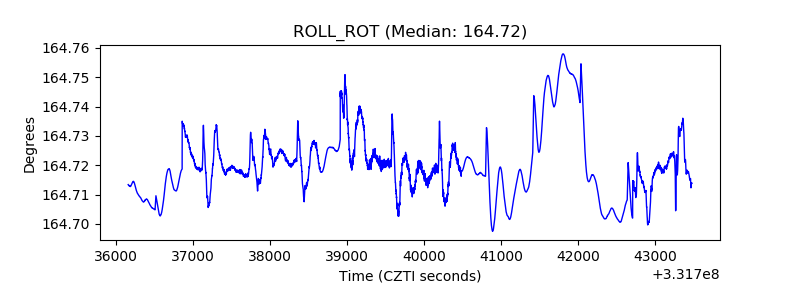 |
| _Roll_DEC | 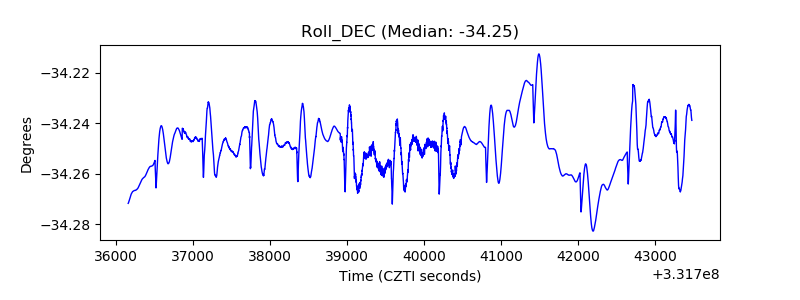 |
| _Roll_RA | 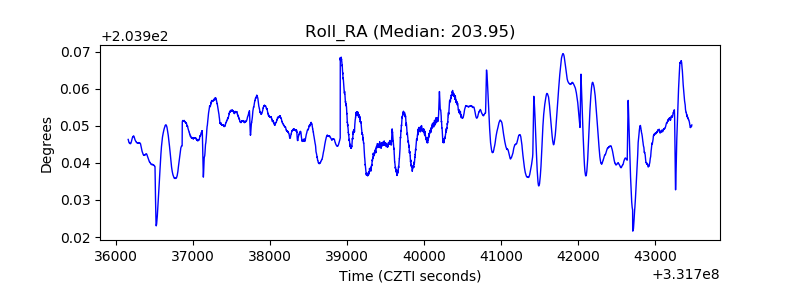 |
| Veto Counter |  |