| Param | Original file | Final file |
|---|---|---|
| Filename | modeM0/AS1A07_068T01_9000003756_25807cztM0_level2.evt | modeM0/AS1A07_068T01_9000003756_25807cztM0_level2_quad_clean.evt |
| Size (bytes) | 523,592,640 | 104,230,080 |
| Size | 499.3 MB | 99.4 MB |
| Events in quadrant A | 4,868,292 | 688,000 |
| Events in quadrant B | 3,429,839 | 710,660 |
| Events in quadrant C | 3,440,399 | 656,672 |
| Events in quadrant D | 3,686,070 | 656,482 |
| Mode M0 | |||
|---|---|---|---|
| Quadrant | BADHDUFLAG | Total packets | Discarded packets |
| A | 0 | 18713 | 0 |
| B | 0 | 14261 | 0 |
| C | 0 | 14283 | 0 |
| D | 0 | 15191 | 0 |
| Mode M9 | |||
|---|---|---|---|
| Quadrant | BADHDUFLAG | Total packets | Discarded packets |
| A | 0 | 12 | 0 |
| B | 0 | 12 | 0 |
| C | 0 | 12 | 0 |
| D | 0 | 12 | 0 |
| Quadrant | Total seconds | Saturated seconds | Saturation percentage |
|---|---|---|---|
| A | 6373 | 375 | 5.884199% |
| B | 6373 | 63 | 0.988545% |
| C | 6373 | 118 | 1.851561% |
| D | 6373 | 138 | 2.165385% |
Noise dominated data is calculated using 1-second bins in cleaned event files. If a bin has >2000 counts, and if more than 50% of those come from <1% of pixels, then it is considered to be noise-dominated and hence unusable.
| Quadrant | # 1 sec bins | Bins with >0 counts | Bins with >2000 counts | High rate bins dominated by noise | Noise dominated (total time) | Noise dominated (detector-on time) | Marked lightcurve |
|---|---|---|---|---|---|---|---|
| A | 7643 | 6373 | 252 | 252 | 3.30% | 3.95% | 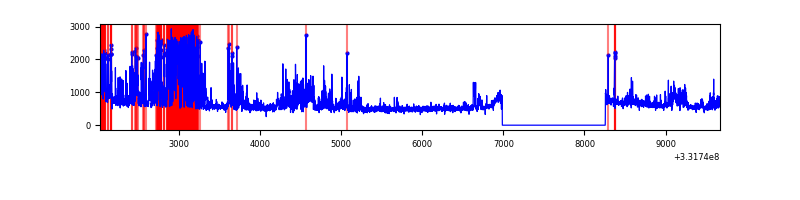 |
| B | 7643 | 6373 | 0 | 0 | 0.00% | 0.00% | 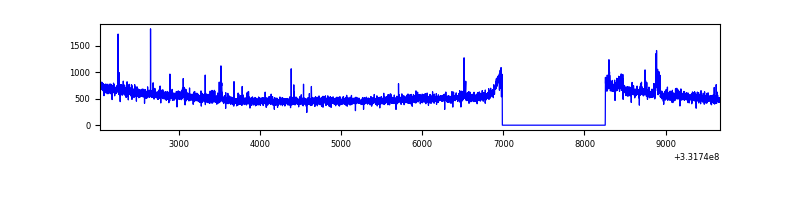 |
| C | 7643 | 6373 | 2 | 2 | 0.03% | 0.03% | 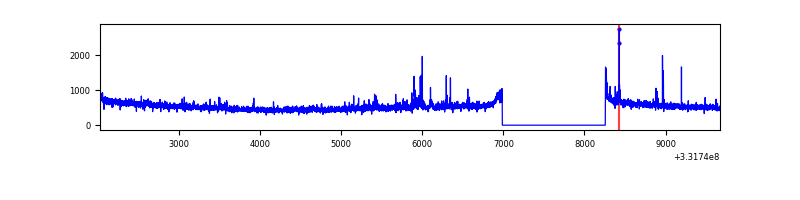 |
| D | 7643 | 6373 | 90 | 90 | 1.18% | 1.41% | 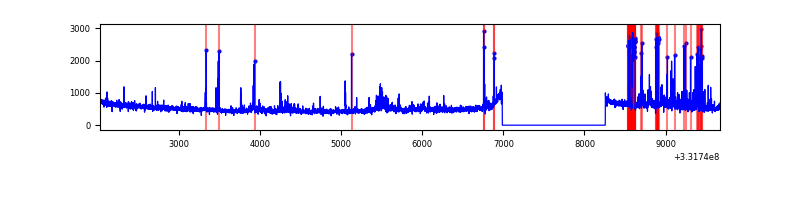 |
Top three noisy pixels from each quadrant. If the there are fewer than three noisy pixels in the level2.evt file, extra rows are filled as -1
| Pixel properties | Quadrant properties | ||||||
|---|---|---|---|---|---|---|---|
| Quadrant | DetID | PixID | Counts | Sigma | Mean | Median | Sigma |
| A | 0 | 13 | 1408450 | 8252.18 | 858 | 845 | 170.6 |
| A | 11 | 29 | 156767 | 914.1 | 858 | 845 | 170.6 |
| A | 13 | 254 | 8888 | 47.15 | 858 | 845 | 170.6 |
| B | 0 | 190 | 26018 | 157.84 | 852 | 835 | 159.5 |
| B | 0 | 219 | 22554 | 136.13 | 852 | 835 | 159.5 |
| B | 15 | 33 | 22268 | 134.34 | 852 | 835 | 159.5 |
| C | 3 | 233 | 149655 | 803.7 | 804 | 809 | 185.2 |
| C | 14 | 238 | 130101 | 698.11 | 804 | 809 | 185.2 |
| C | 0 | 207 | 22856 | 119.04 | 804 | 809 | 185.2 |
| D | 7 | 80 | 314962 | 1599.06 | 820 | 801 | 196.5 |
| D | 1 | 52 | 204883 | 1038.76 | 820 | 801 | 196.5 |
| D | 8 | 195 | 42982 | 214.7 | 820 | 801 | 196.5 |
Histogram calculated using DETX and DETY for each event in the final _common_clean file
| Quadrant A | 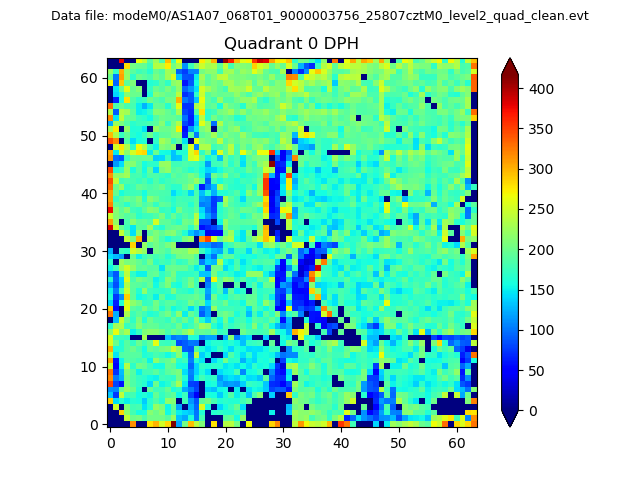 |
 |
Quadrant B |
|---|---|---|---|
| Quadrant D | 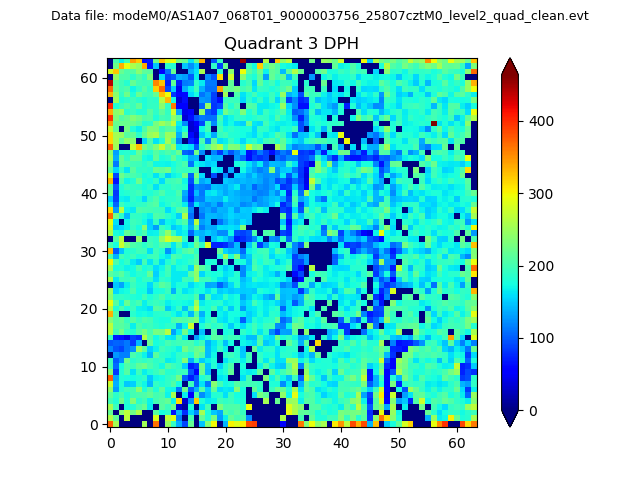 |
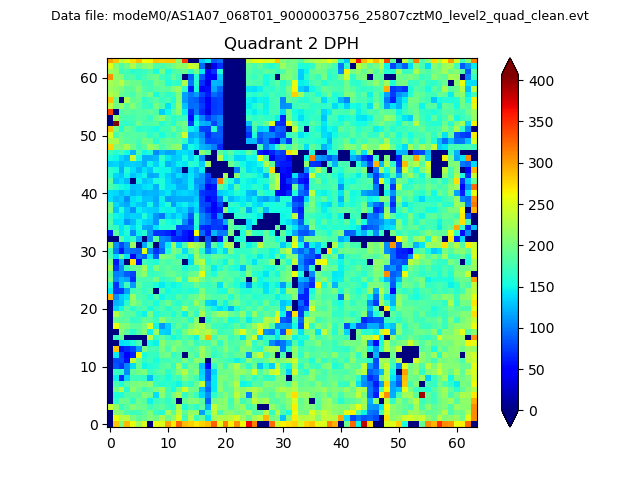 |
Quadrant C |
| Plot type | Count rate plots | Images |
|---|---|---|
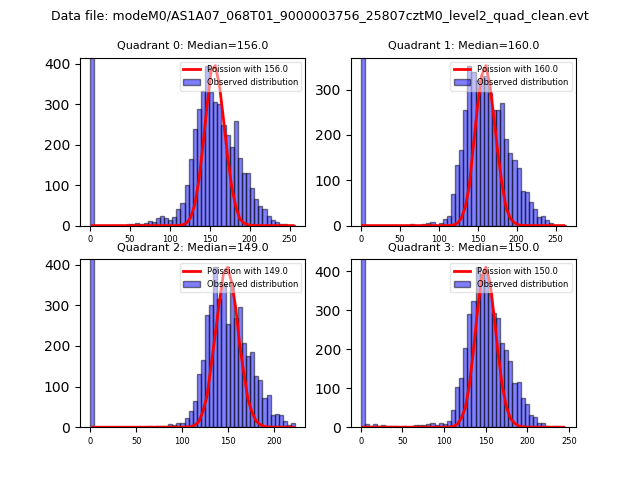
| Comparison with Poisson distribution Blue bars denote a histogram of data divided into 1 sec bins. Red curve is a Poisson curve with rate = median count rate of data. |
 |
 |
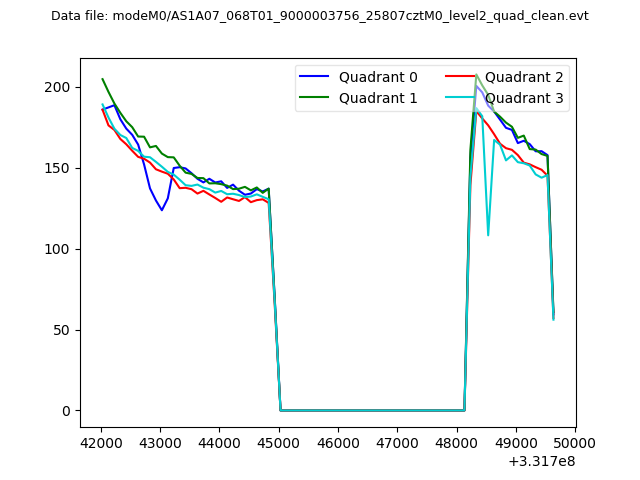
| Quadrant-wise count rates Data is divided into 100 sec bins |
 |
|
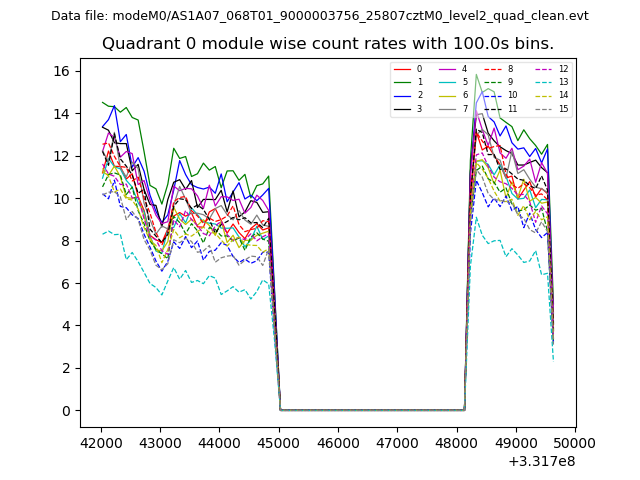
| Module-wise count rates for Quadrant A Data is divided into 100 sec bins |
 |
 |
| Module-wise count rates for Quadrant B Data is divided into 100 sec bins |
 |
 |
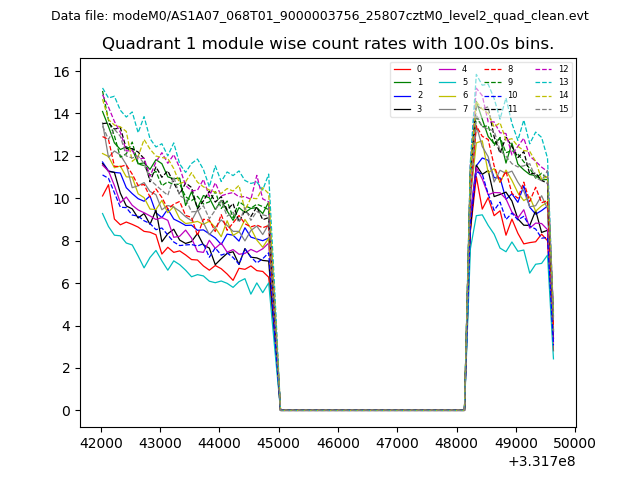
| Module-wise count rates for Quadrant C Data is divided into 100 sec bins |
 |
 |
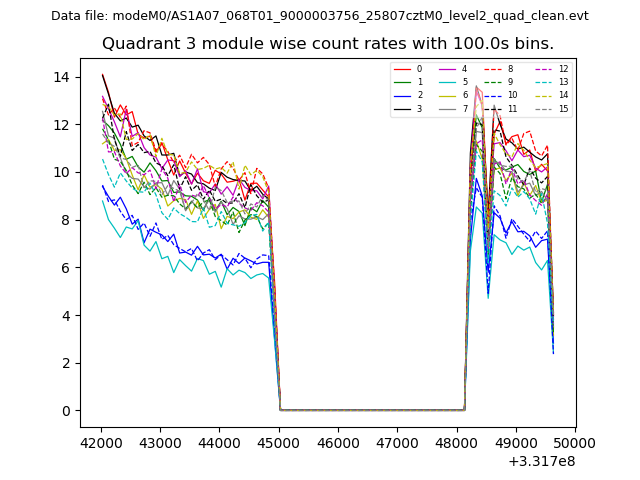
| Module-wise count rates for Quadrant D Data is divided into 100 sec bins |
 |
 |
| Parameter | Plot |
|---|---|
| CZT HV Monitor | 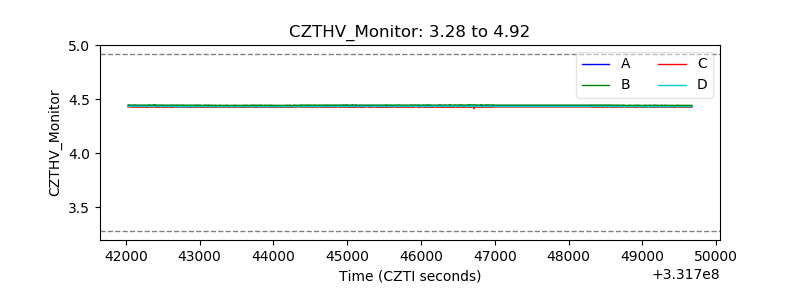 |
| D_VDD | 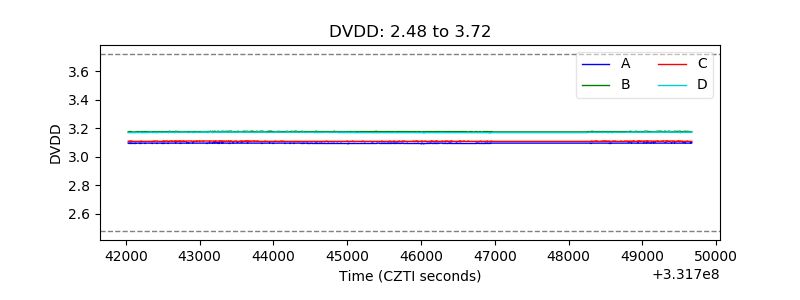 |
| Temperature 1 | 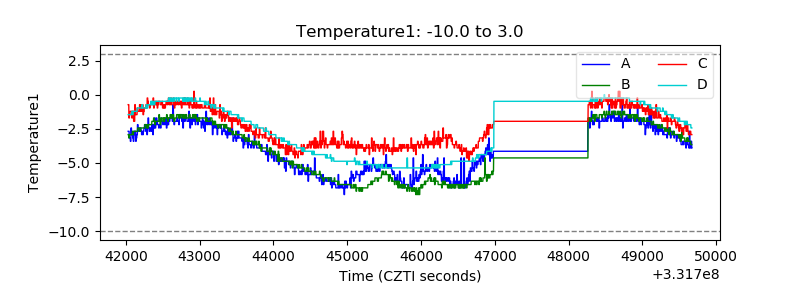 |
| Veto HV Monitor | 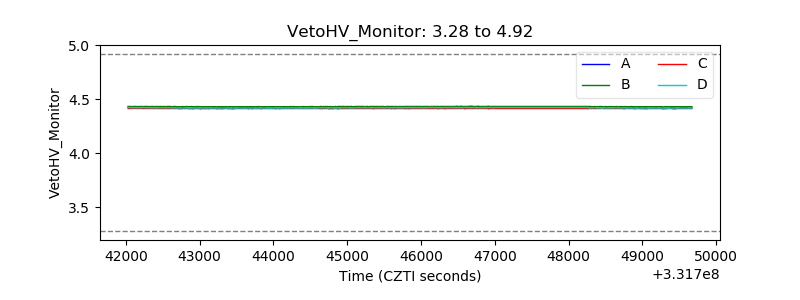 |
| Veto LLD | 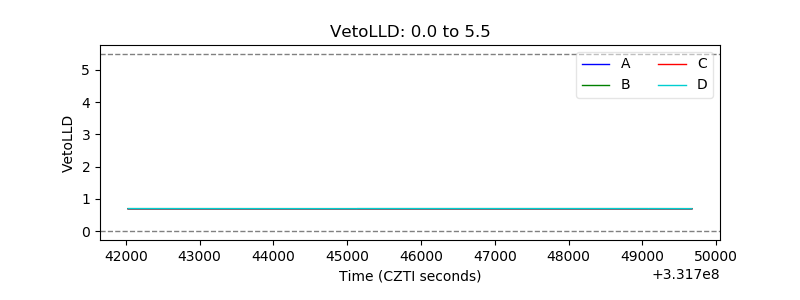 |
| Alpha Counter | 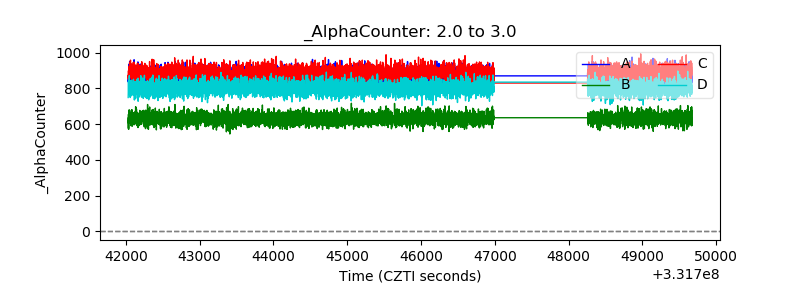 |
| _CPM_Rate | 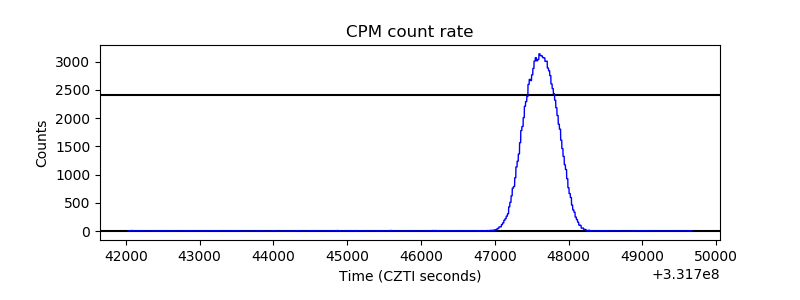 |
| CZT Counter | 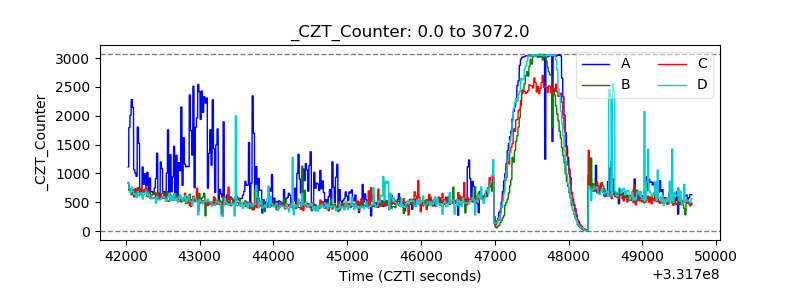 |
| +2.5 Volts monitor |  |
| +5 Volts monitor |  |
| _ROLL_ROT | 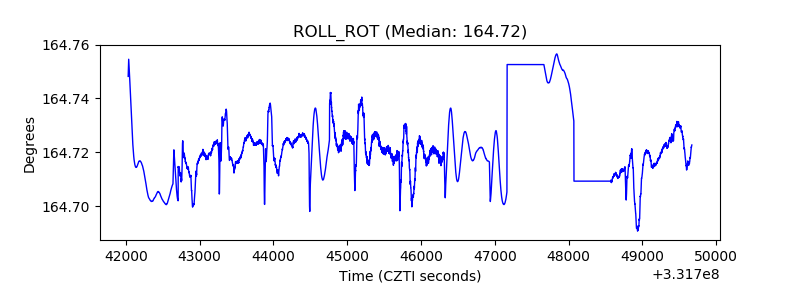 |
| _Roll_DEC |  |
| _Roll_RA | 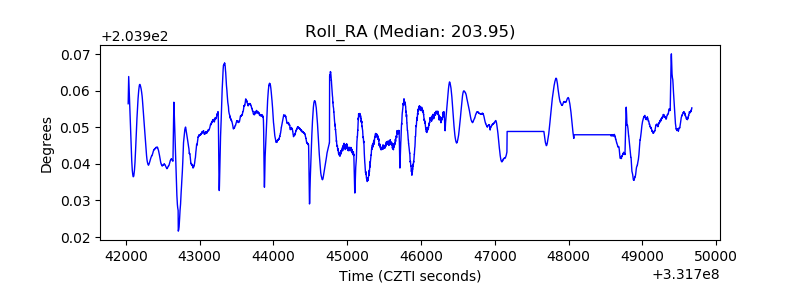 |
| Veto Counter | 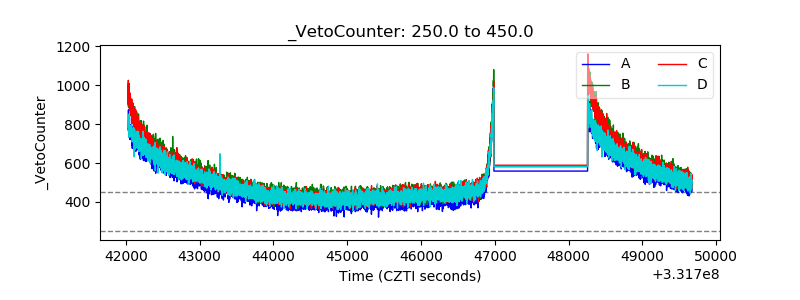 |