| Param | Original file | Final file |
|---|---|---|
| Filename | modeM0/AS1A07_068T01_9000003756_25808cztM0_level2.evt | modeM0/AS1A07_068T01_9000003756_25808cztM0_level2_quad_clean.evt |
| Size (bytes) | 545,178,240 | 98,280,000 |
| Size | 519.9 MB | 93.7 MB |
| Events in quadrant A | 4,393,657 | 621,437 |
| Events in quadrant B | 3,374,161 | 682,450 |
| Events in quadrant C | 3,279,458 | 629,658 |
| Events in quadrant D | 5,042,288 | 608,665 |
| Mode M0 | |||
|---|---|---|---|
| Quadrant | BADHDUFLAG | Total packets | Discarded packets |
| A | 0 | 17123 | 0 |
| B | 0 | 13879 | 0 |
| C | 0 | 13618 | 0 |
| D | 0 | 19140 | 0 |
| Mode M9 | |||
|---|---|---|---|
| Quadrant | BADHDUFLAG | Total packets | Discarded packets |
| A | 0 | 19 | 0 |
| B | 0 | 20 | 0 |
| C | 0 | 20 | 0 |
| D | 0 | 20 | 0 |
| Quadrant | Total seconds | Saturated seconds | Saturation percentage |
|---|---|---|---|
| A | 6219 | 463 | 7.444927% |
| B | 6219 | 58 | 0.932626% |
| C | 6219 | 105 | 1.688374% |
| D | 6218 | 185 | 2.975233% |
Noise dominated data is calculated using 1-second bins in cleaned event files. If a bin has >2000 counts, and if more than 50% of those come from <1% of pixels, then it is considered to be noise-dominated and hence unusable.
| Quadrant | # 1 sec bins | Bins with >0 counts | Bins with >2000 counts | High rate bins dominated by noise | Noise dominated (total time) | Noise dominated (detector-on time) | Marked lightcurve |
|---|---|---|---|---|---|---|---|
| A | 7579 | 6219 | 408 | 408 | 5.38% | 6.56% | 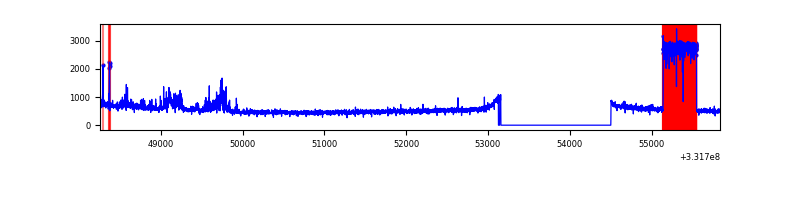 |
| B | 7579 | 6219 | 1 | 1 | 0.01% | 0.02% | 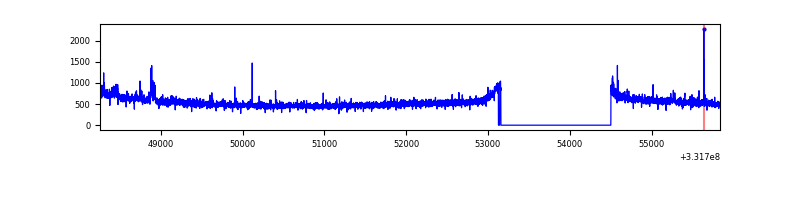 |
| C | 7579 | 6219 | 2 | 2 | 0.03% | 0.03% | 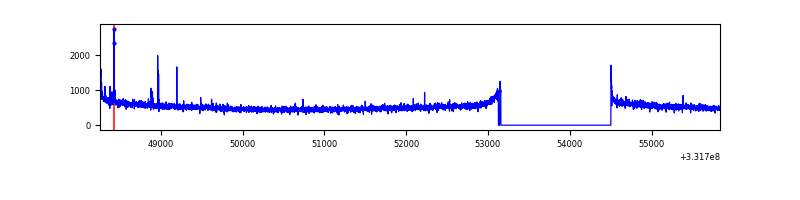 |
| D | 7578 | 6218 | 129 | 129 | 1.70% | 2.07% | 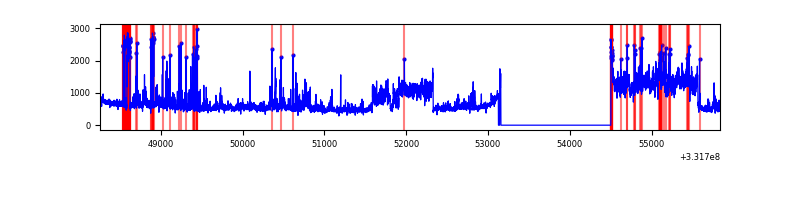 |
Top three noisy pixels from each quadrant. If the there are fewer than three noisy pixels in the level2.evt file, extra rows are filled as -1
| Pixel properties | Quadrant properties | ||||||
|---|---|---|---|---|---|---|---|
| Quadrant | DetID | PixID | Counts | Sigma | Mean | Median | Sigma |
| A | 0 | 13 | 1277116 | 7963.24 | 809 | 797 | 160.3 |
| A | 13 | 254 | 8695 | 49.28 | 809 | 797 | 160.3 |
| A | 0 | 226 | 7053 | 39.03 | 809 | 797 | 160.3 |
| B | 0 | 190 | 26243 | 161.82 | 840 | 824 | 157.1 |
| B | 0 | 229 | 19881 | 121.32 | 840 | 824 | 157.1 |
| B | 0 | 219 | 19688 | 120.09 | 840 | 824 | 157.1 |
| C | 14 | 238 | 130177 | 711.67 | 790 | 797 | 181.8 |
| C | 3 | 233 | 41633 | 224.62 | 790 | 797 | 181.8 |
| C | 0 | 207 | 21849 | 115.8 | 790 | 797 | 181.8 |
| D | 7 | 223 | 1181669 | 6177.81 | 793 | 774 | 191.2 |
| D | 1 | 52 | 384249 | 2006.13 | 793 | 774 | 191.2 |
| D | 7 | 80 | 369032 | 1926.53 | 793 | 774 | 191.2 |
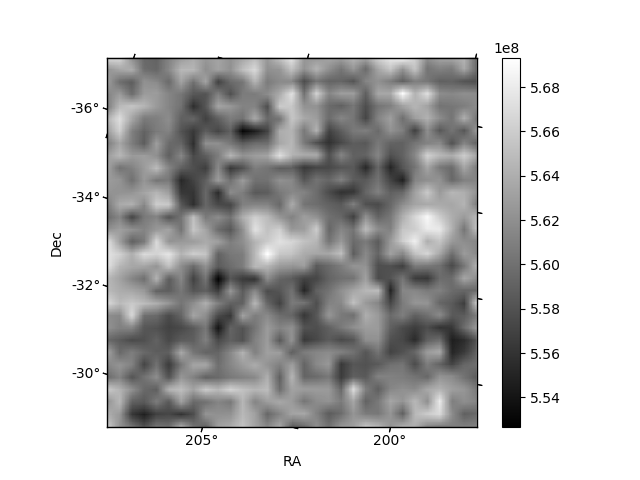
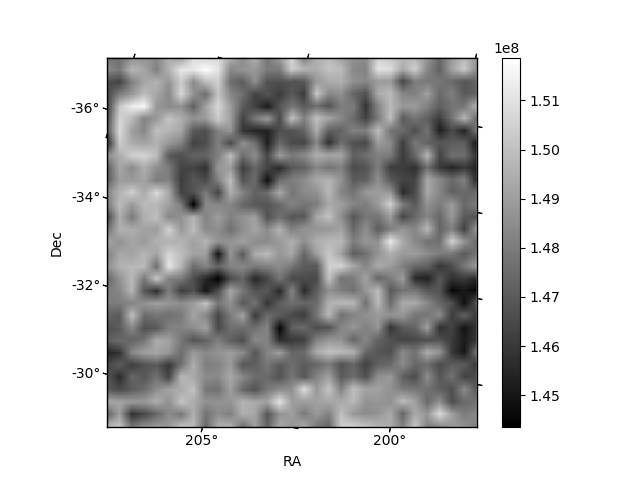
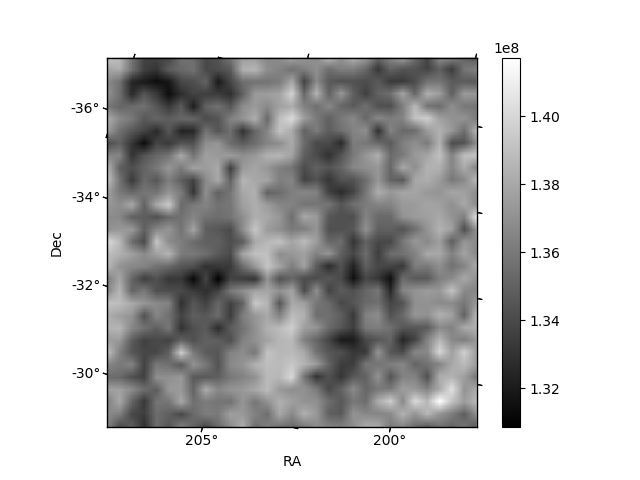
Histogram calculated using DETX and DETY for each event in the final _common_clean file
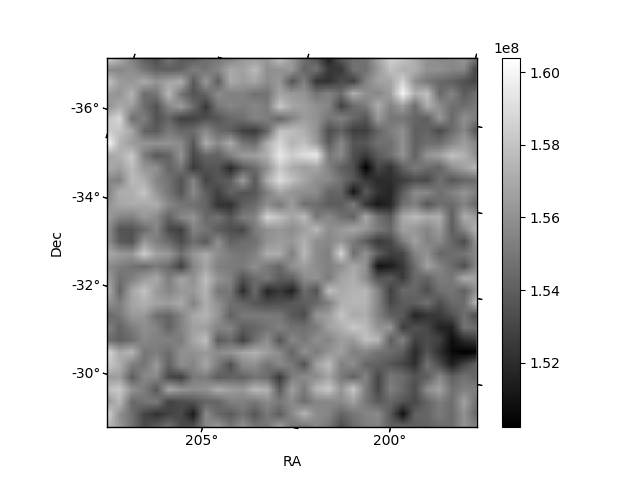
| Quadrant A | 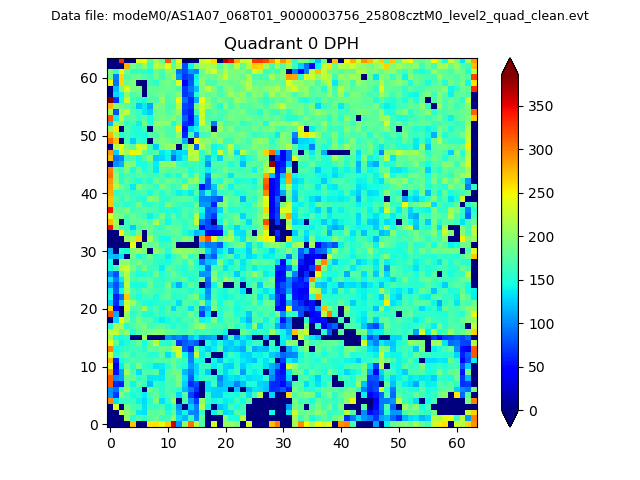 |
 |
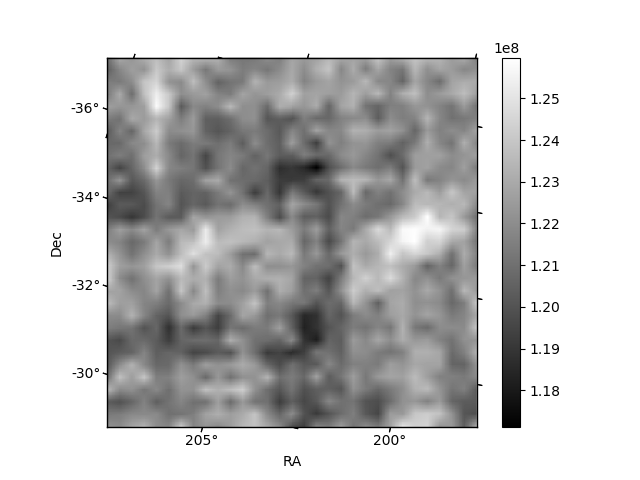
Quadrant B |
|---|---|---|---|
| Quadrant D | 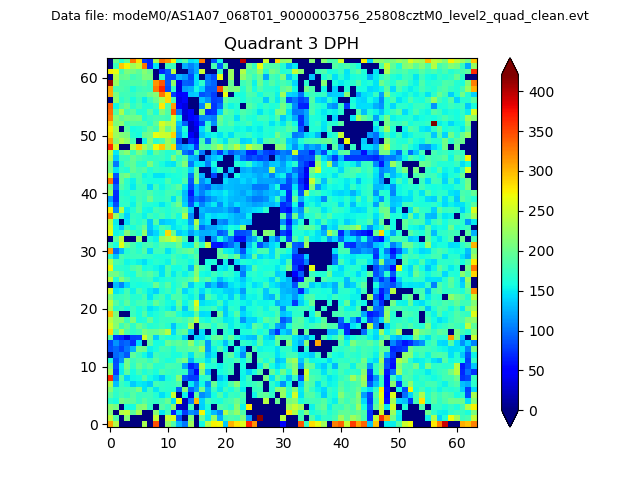 |
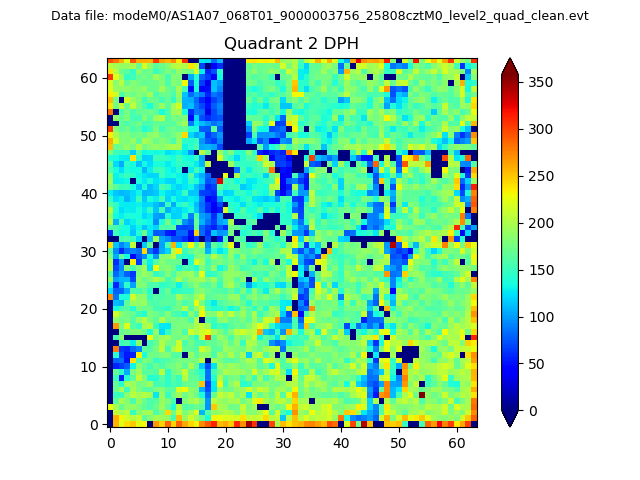 |
Quadrant C |
| Plot type | Count rate plots | Images |
|---|---|---|
| Comparison with Poisson distribution Blue bars denote a histogram of data divided into 1 sec bins. Red curve is a Poisson curve with rate = median count rate of data. |
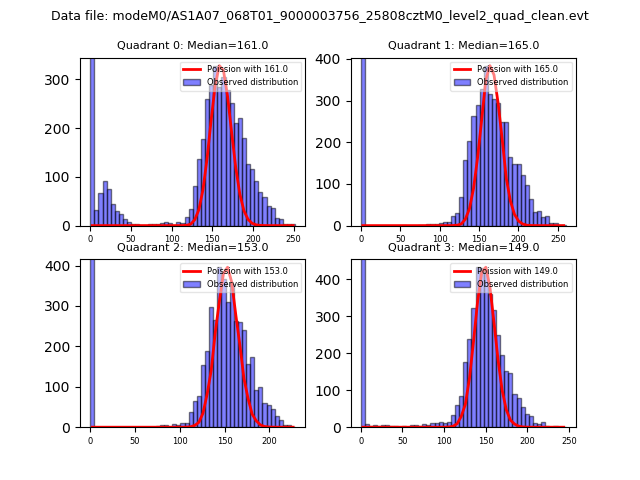 |
 |
| Quadrant-wise count rates Data is divided into 100 sec bins |
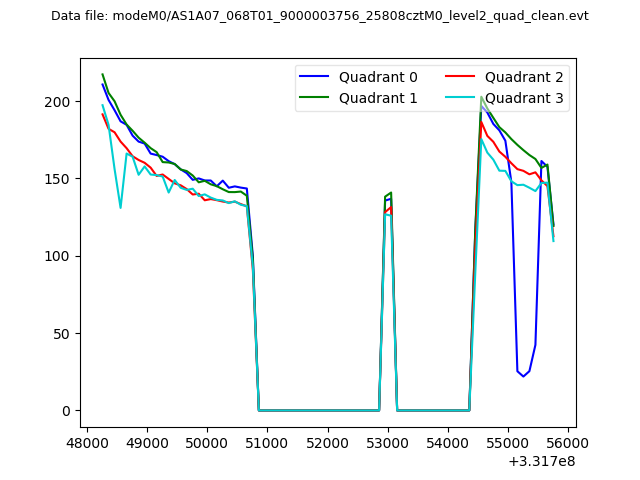 |
|
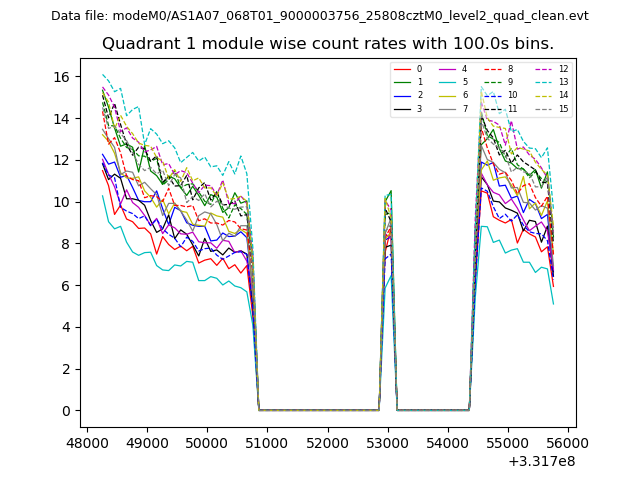
| Module-wise count rates for Quadrant A Data is divided into 100 sec bins |
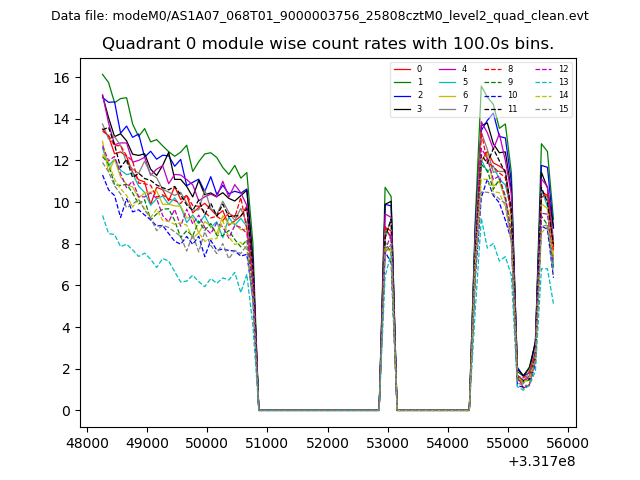 |
 |
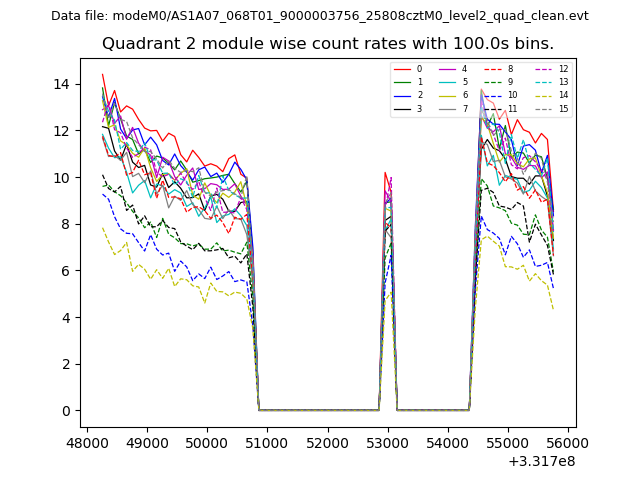
| Module-wise count rates for Quadrant B Data is divided into 100 sec bins |
 |
 |
| Module-wise count rates for Quadrant C Data is divided into 100 sec bins |
 |
 |
| Module-wise count rates for Quadrant D Data is divided into 100 sec bins |
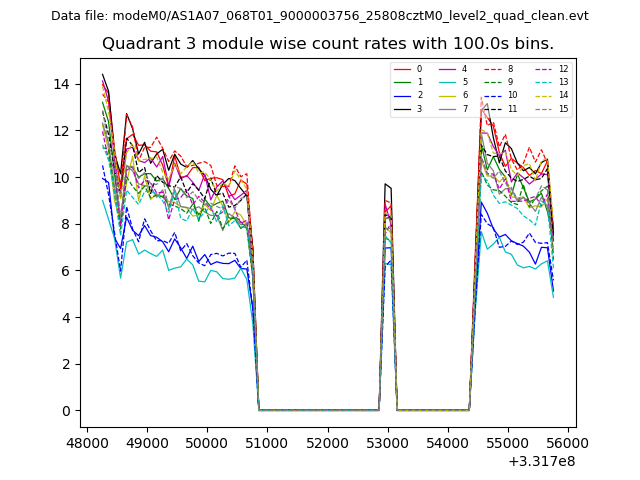 |
 |
| Parameter | Plot |
|---|---|
| CZT HV Monitor | 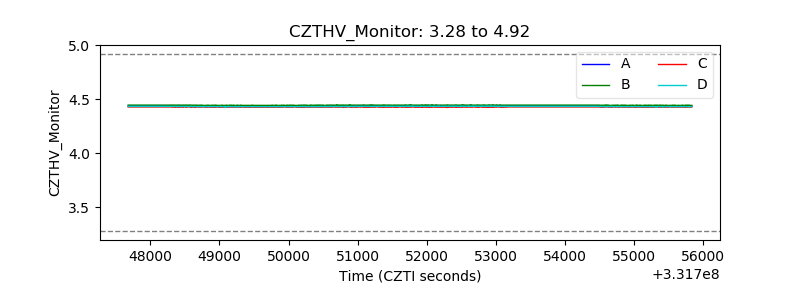 |
| D_VDD | 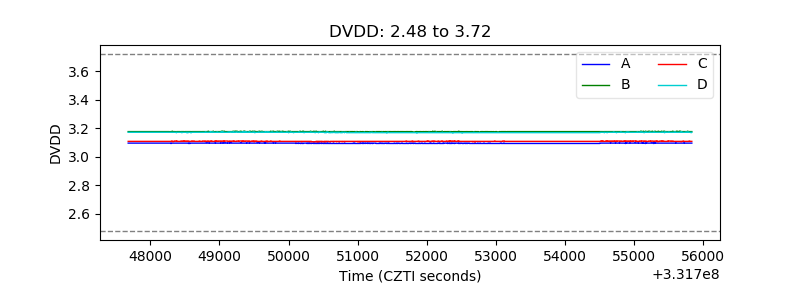 |
| Temperature 1 | 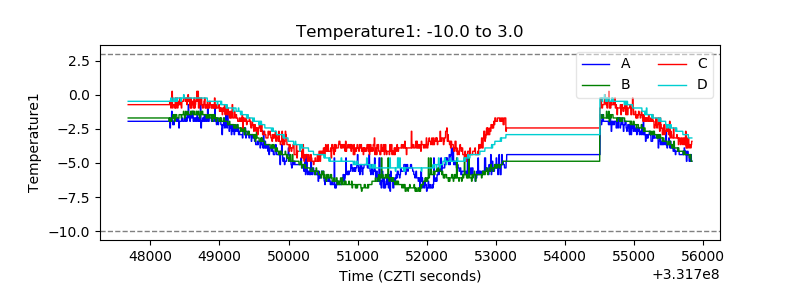 |
| Veto HV Monitor | 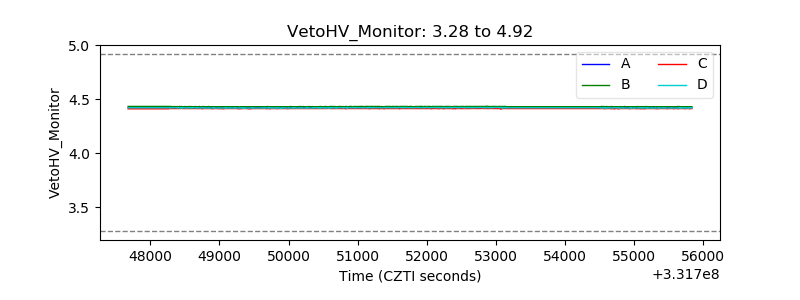 |
| Veto LLD | 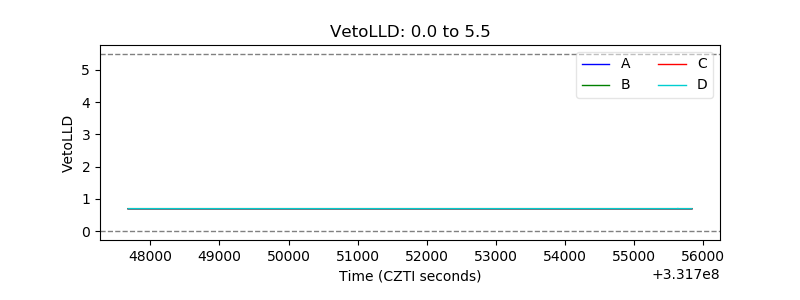 |
| Alpha Counter | 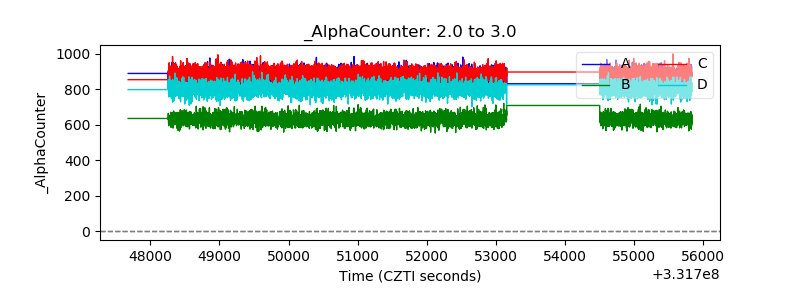 |
| _CPM_Rate | 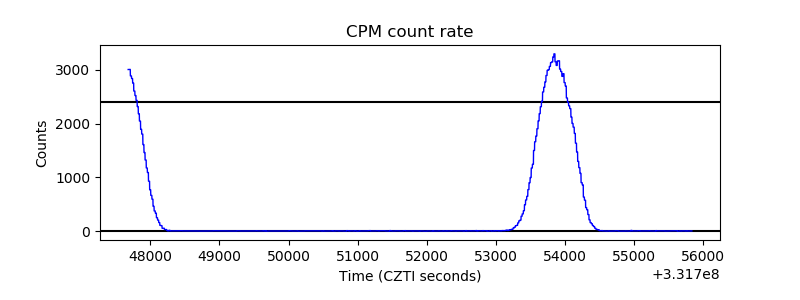 |
| CZT Counter | 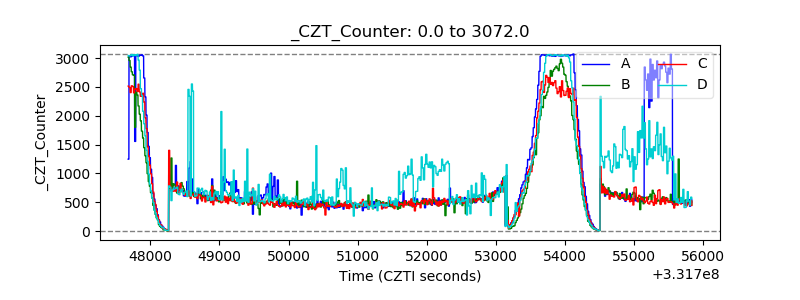 |
| +2.5 Volts monitor | 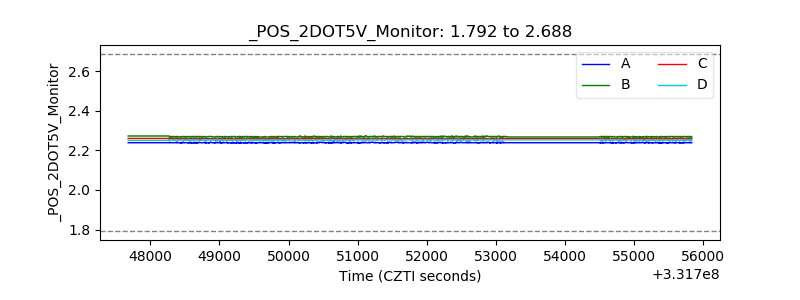 |
| +5 Volts monitor | 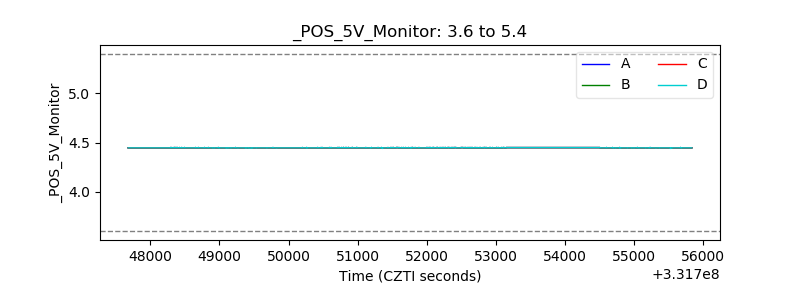 |
| _ROLL_ROT | 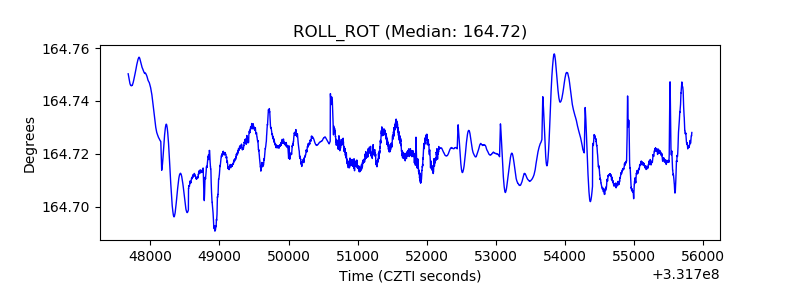 |
| _Roll_DEC |  |
| _Roll_RA | 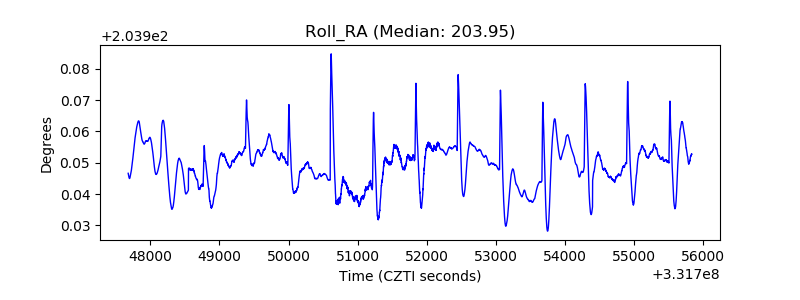 |
| Veto Counter | 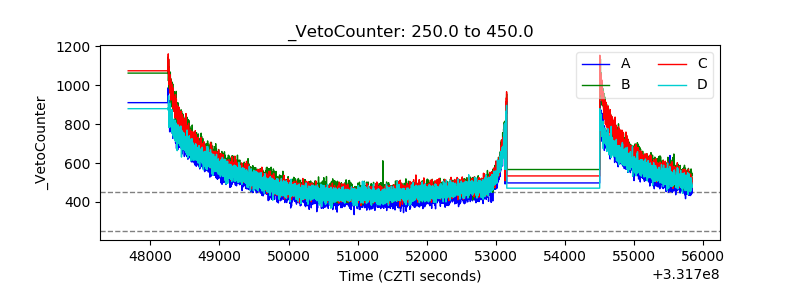 |