| Param | Original file | Final file |
|---|---|---|
| Filename | modeM0/AS1A07_068T01_9000003756_25809cztM0_level2.evt | modeM0/AS1A07_068T01_9000003756_25809cztM0_level2_quad_clean.evt |
| Size (bytes) | 500,906,880 | 93,542,400 |
| Size | 477.7 MB | 89.2 MB |
| Events in quadrant A | 4,109,437 | 581,095 |
| Events in quadrant B | 3,236,340 | 647,763 |
| Events in quadrant C | 3,128,383 | 597,803 |
| Events in quadrant D | 4,283,317 | 581,332 |
| Mode M0 | |||
|---|---|---|---|
| Quadrant | BADHDUFLAG | Total packets | Discarded packets |
| A | 0 | 16002 | 0 |
| B | 0 | 13304 | 0 |
| C | 0 | 13028 | 0 |
| D | 0 | 16619 | 0 |
| Mode M9 | |||
|---|---|---|---|
| Quadrant | BADHDUFLAG | Total packets | Discarded packets |
| A | 0 | 15 | 0 |
| B | 0 | 16 | 0 |
| C | 0 | 16 | 0 |
| D | 0 | 16 | 0 |
| Quadrant | Total seconds | Saturated seconds | Saturation percentage |
|---|---|---|---|
| A | 6087 | 449 | 7.376376% |
| B | 6087 | 57 | 0.936422% |
| C | 6087 | 92 | 1.511418% |
| D | 6087 | 105 | 1.724988% |
Noise dominated data is calculated using 1-second bins in cleaned event files. If a bin has >2000 counts, and if more than 50% of those come from <1% of pixels, then it is considered to be noise-dominated and hence unusable.
| Quadrant | # 1 sec bins | Bins with >0 counts | Bins with >2000 counts | High rate bins dominated by noise | Noise dominated (total time) | Noise dominated (detector-on time) | Marked lightcurve |
|---|---|---|---|---|---|---|---|
| A | 7467 | 6088 | 403 | 403 | 5.40% | 6.62% |  |
| B | 7467 | 6087 | 2 | 2 | 0.03% | 0.03% |  |
| C | 7467 | 6087 | 0 | 0 | 0.00% | 0.00% |  |
| D | 7467 | 6088 | 71 | 71 | 0.95% | 1.17% |  |
Top three noisy pixels from each quadrant. If the there are fewer than three noisy pixels in the level2.evt file, extra rows are filled as -1
| Pixel properties | Quadrant properties | ||||||
|---|---|---|---|---|---|---|---|
| Quadrant | DetID | PixID | Counts | Sigma | Mean | Median | Sigma |
| A | 0 | 13 | 1113451 | 7205.41 | 776 | 763 | 154.4 |
| A | 13 | 254 | 8661 | 51.14 | 776 | 763 | 154.4 |
| A | 6 | 16 | 8378 | 49.31 | 776 | 763 | 154.4 |
| B | 12 | 111 | 17778 | 111.59 | 811 | 793 | 152.2 |
| B | 0 | 219 | 16894 | 105.78 | 811 | 793 | 152.2 |
| B | 0 | 229 | 16555 | 103.56 | 811 | 793 | 152.2 |
| C | 14 | 238 | 125395 | 704.82 | 764 | 772 | 176.8 |
| C | 3 | 233 | 11433 | 60.29 | 764 | 772 | 176.8 |
| C | 0 | 10 | 11154 | 58.72 | 764 | 772 | 176.8 |
| D | 7 | 223 | 740419 | 4006.23 | 767 | 749 | 184.6 |
| D | 1 | 52 | 452131 | 2444.79 | 767 | 749 | 184.6 |
| D | 8 | 195 | 114848 | 617.99 | 767 | 749 | 184.6 |
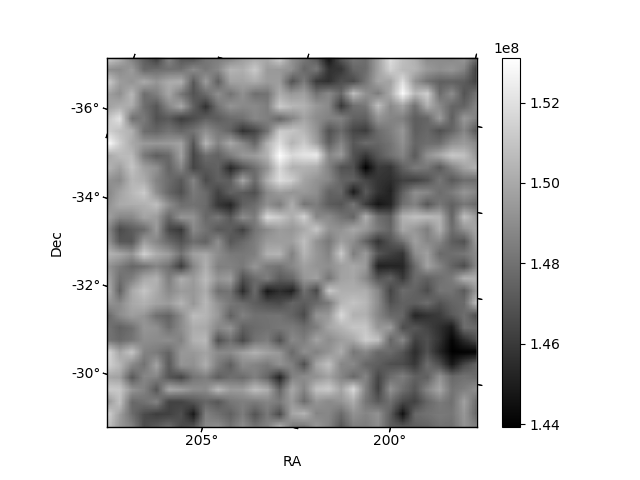
Histogram calculated using DETX and DETY for each event in the final _common_clean file
| Quadrant A | 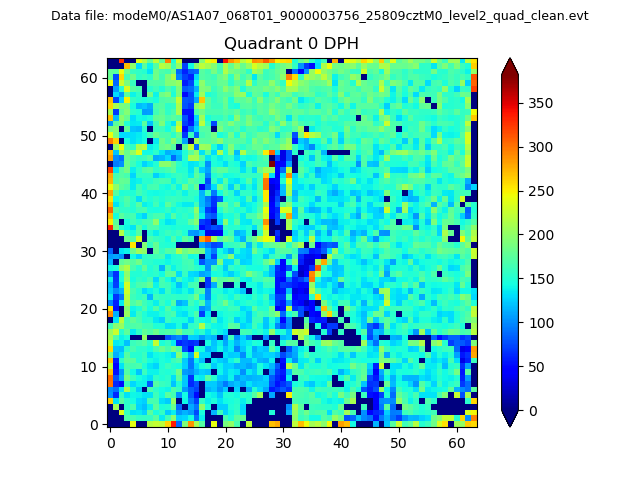 |
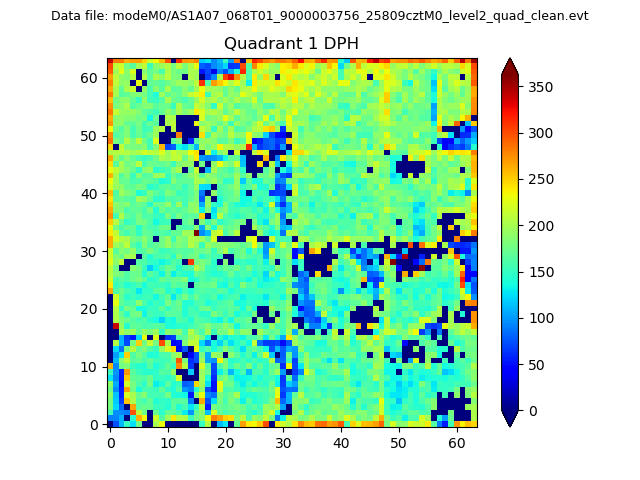 |
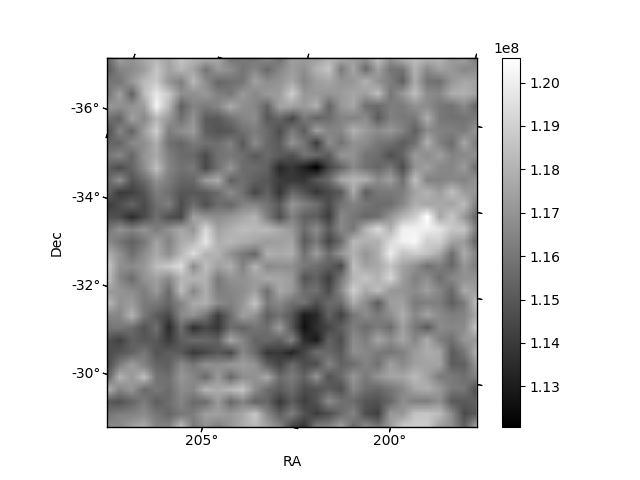
Quadrant B |
|---|---|---|---|
| Quadrant D | 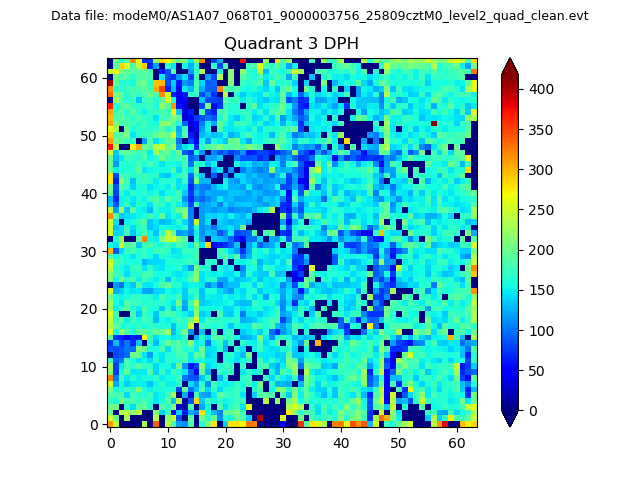 |
 |
Quadrant C |
| Plot type | Count rate plots | Images |
|---|---|---|
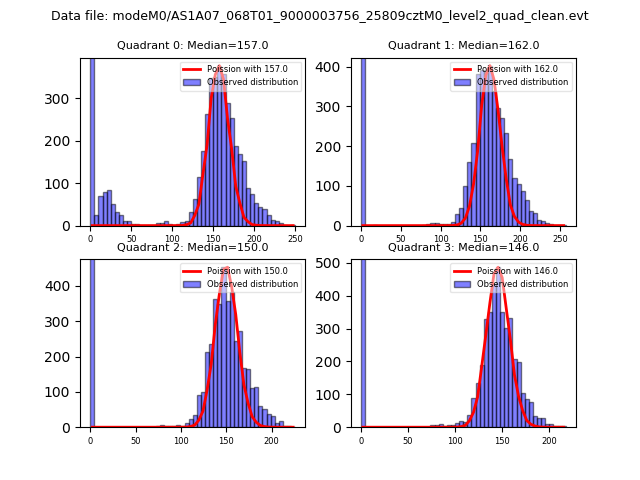
| Comparison with Poisson distribution Blue bars denote a histogram of data divided into 1 sec bins. Red curve is a Poisson curve with rate = median count rate of data. |
 |
 |
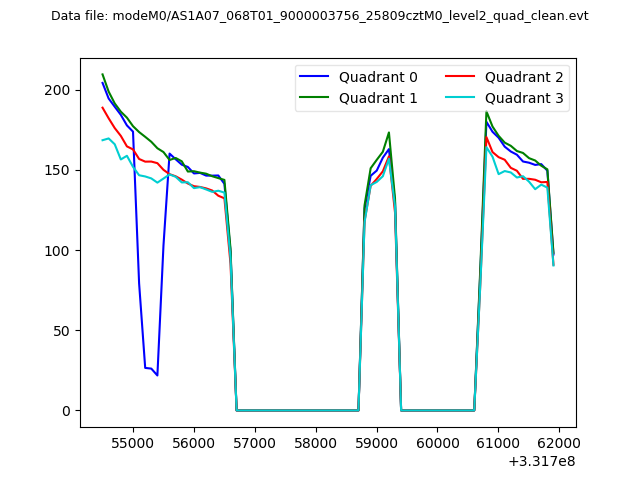
| Quadrant-wise count rates Data is divided into 100 sec bins |
 |
|
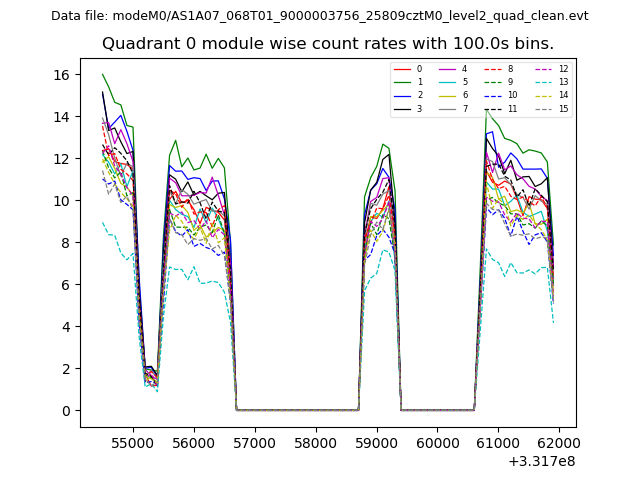
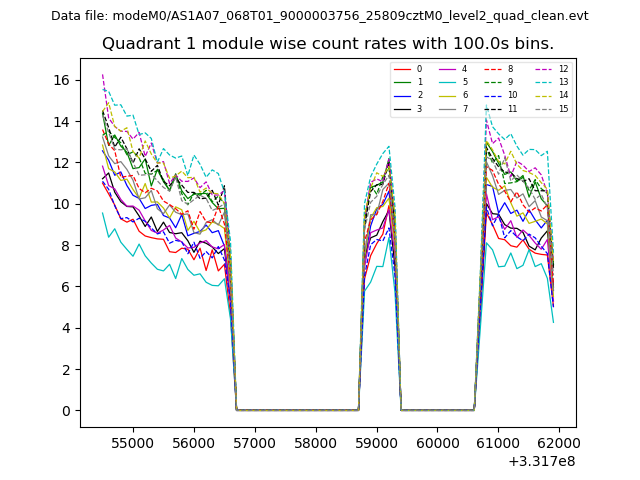
| Module-wise count rates for Quadrant A Data is divided into 100 sec bins |
 |
 |
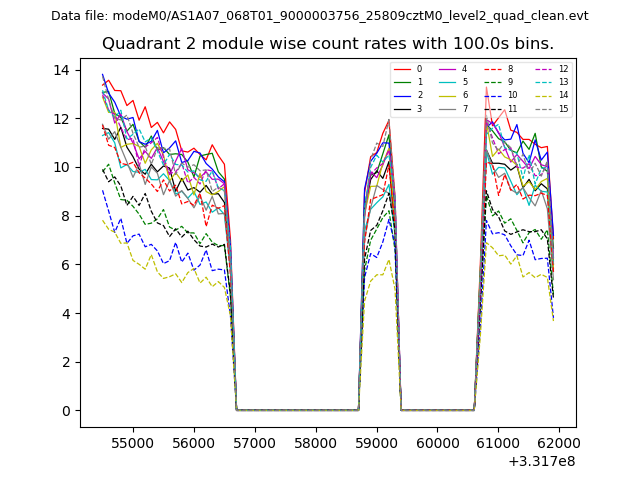
| Module-wise count rates for Quadrant B Data is divided into 100 sec bins |
 |
 |
| Module-wise count rates for Quadrant C Data is divided into 100 sec bins |
 |
 |
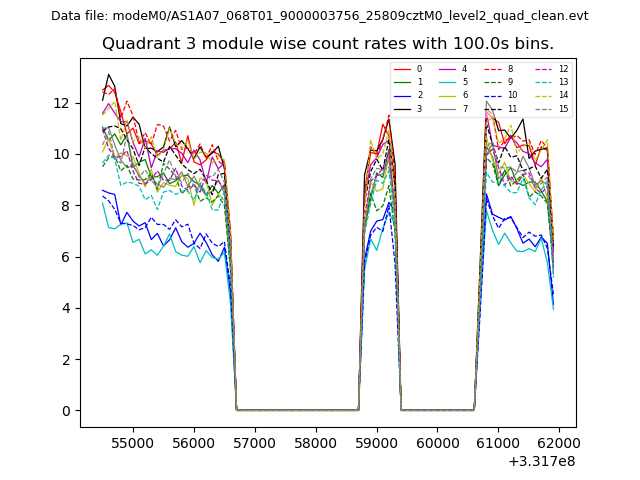
| Module-wise count rates for Quadrant D Data is divided into 100 sec bins |
 |
 |
| Parameter | Plot |
|---|---|
| CZT HV Monitor | 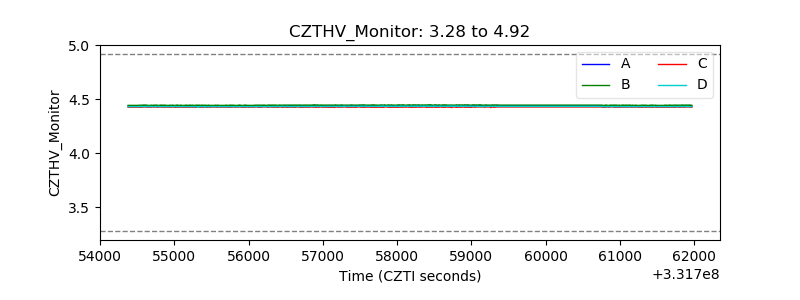 |
| D_VDD | 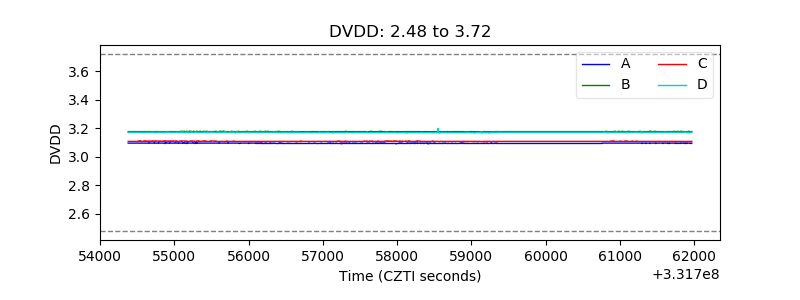 |
| Temperature 1 | 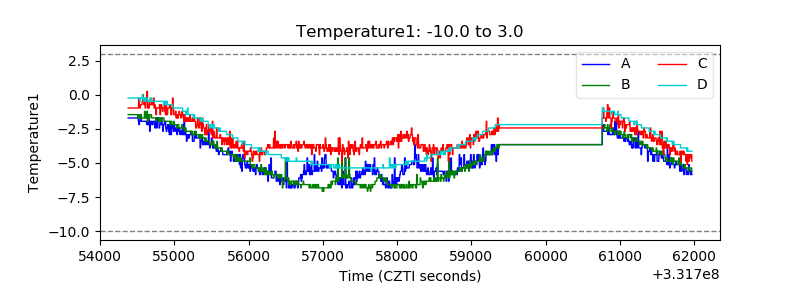 |
| Veto HV Monitor | 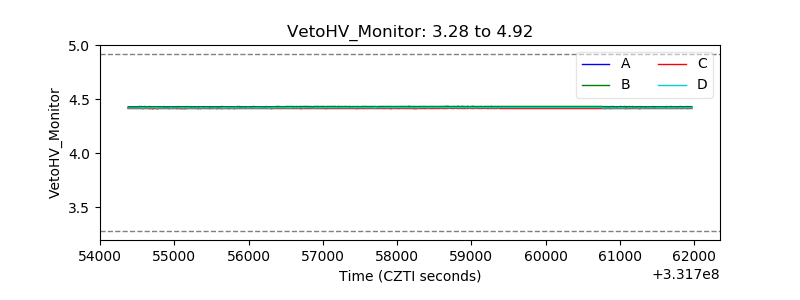 |
| Veto LLD | 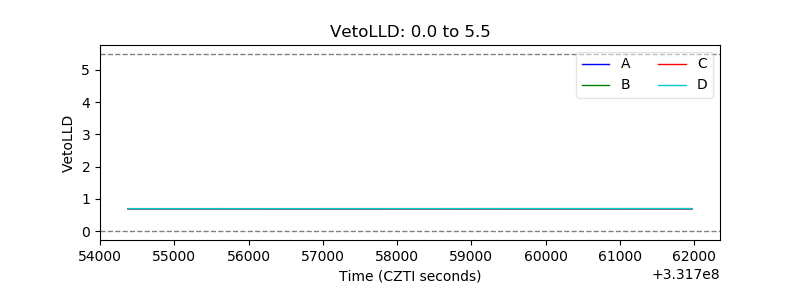 |
| Alpha Counter | 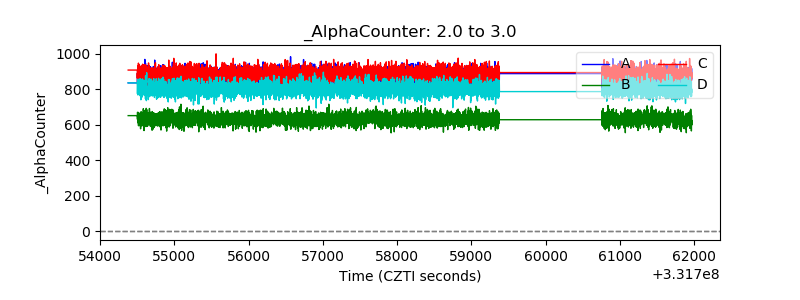 |
| _CPM_Rate | 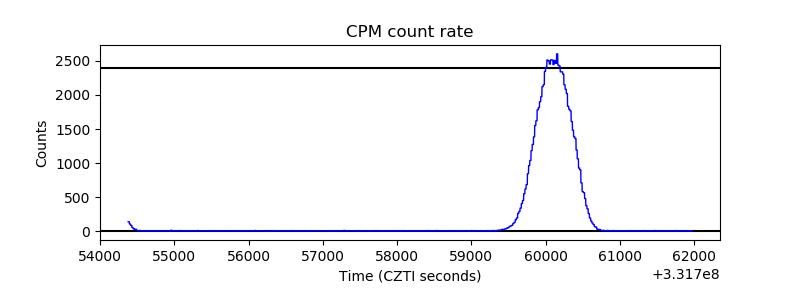 |
| CZT Counter | 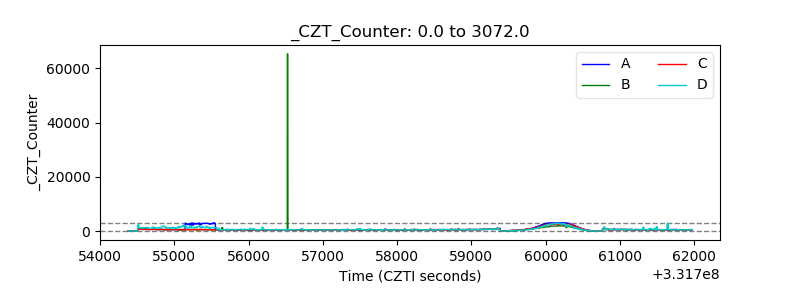 |
| +2.5 Volts monitor |  |
| +5 Volts monitor |  |
| _ROLL_ROT | 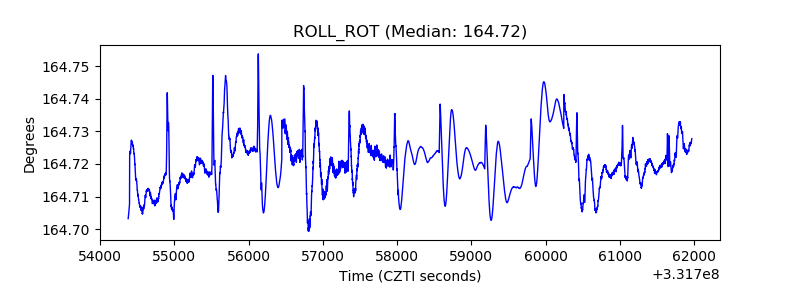 |
| _Roll_DEC | 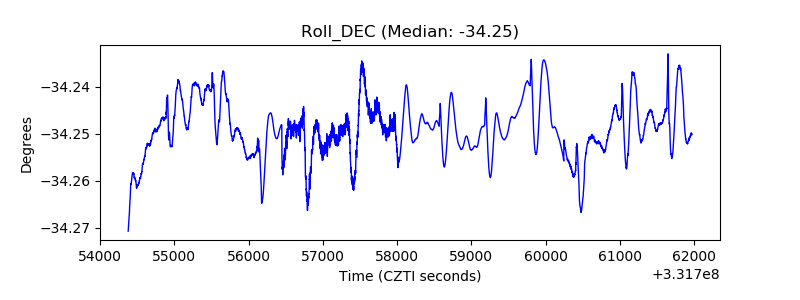 |
| _Roll_RA | 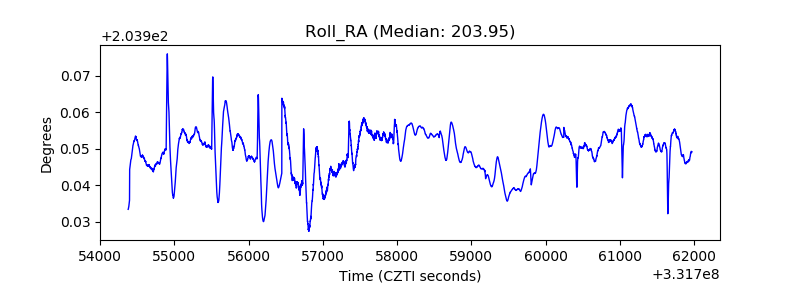 |
| Veto Counter | 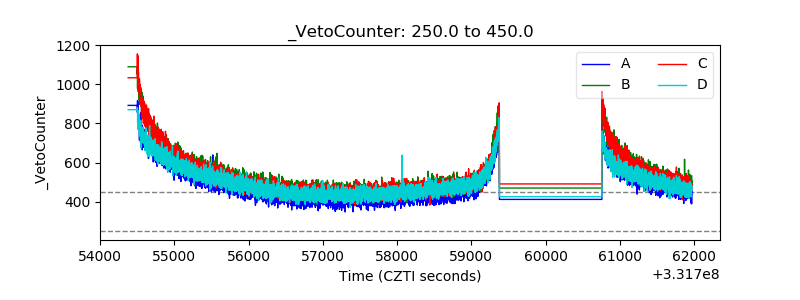 |