| Param | Original file | Final file |
|---|---|---|
| Filename | modeM0/AS1A07_068T01_9000003756_25810cztM0_level2.evt | modeM0/AS1A07_068T01_9000003756_25810cztM0_level2_quad_clean.evt |
| Size (bytes) | 446,129,280 | 92,710,080 |
| Size | 425.5 MB | 88.4 MB |
| Events in quadrant A | 3,248,622 | 610,760 |
| Events in quadrant B | 3,172,948 | 621,285 |
| Events in quadrant C | 3,088,963 | 577,341 |
| Events in quadrant D | 3,581,374 | 567,462 |
| Mode M0 | |||
|---|---|---|---|
| Quadrant | BADHDUFLAG | Total packets | Discarded packets |
| A | 0 | 13461 | 0 |
| B | 0 | 13194 | 0 |
| C | 0 | 13014 | 0 |
| D | 0 | 14727 | 0 |
| Mode M9 | |||
|---|---|---|---|
| Quadrant | BADHDUFLAG | Total packets | Discarded packets |
| A | 0 | 22 | 0 |
| B | 0 | 23 | 0 |
| C | 0 | 23 | 0 |
| D | 0 | 23 | 0 |
| Quadrant | Total seconds | Saturated seconds | Saturation percentage |
|---|---|---|---|
| A | 6169 | 47 | 0.761874% |
| B | 6169 | 55 | 0.891555% |
| C | 6169 | 80 | 1.296807% |
| D | 6169 | 75 | 1.215756% |
Noise dominated data is calculated using 1-second bins in cleaned event files. If a bin has >2000 counts, and if more than 50% of those come from <1% of pixels, then it is considered to be noise-dominated and hence unusable.
| Quadrant | # 1 sec bins | Bins with >0 counts | Bins with >2000 counts | High rate bins dominated by noise | Noise dominated (total time) | Noise dominated (detector-on time) | Marked lightcurve |
|---|---|---|---|---|---|---|---|
| A | 7429 | 6169 | 0 | 0 | 0.00% | 0.00% |  |
| B | 7429 | 6169 | 0 | 0 | 0.00% | 0.00% | 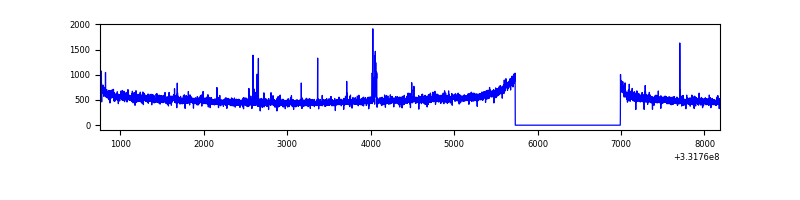 |
| C | 7429 | 6170 | 0 | 0 | 0.00% | 0.00% | 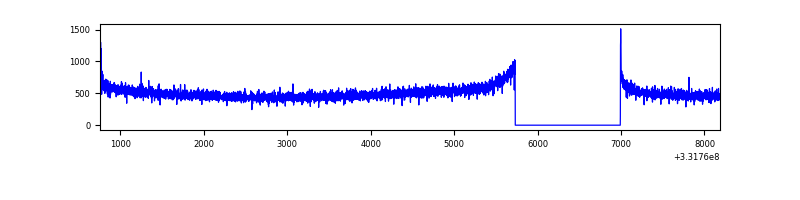 |
| D | 7429 | 6170 | 57 | 57 | 0.77% | 0.92% | 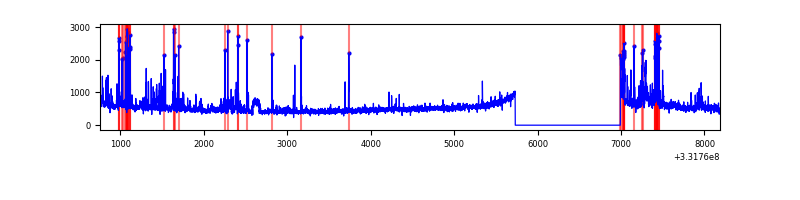 |
Top three noisy pixels from each quadrant. If the there are fewer than three noisy pixels in the level2.evt file, extra rows are filled as -1
| Pixel properties | Quadrant properties | ||||||
|---|---|---|---|---|---|---|---|
| Quadrant | DetID | PixID | Counts | Sigma | Mean | Median | Sigma |
| A | 0 | 13 | 162079 | 1005.9 | 801 | 787 | 160.3 |
| A | 13 | 254 | 8569 | 48.53 | 801 | 787 | 160.3 |
| A | 3 | 137 | 7333 | 40.82 | 801 | 787 | 160.3 |
| B | 10 | 247 | 26353 | 168.99 | 796 | 780 | 151.3 |
| B | 12 | 111 | 17763 | 112.22 | 796 | 780 | 151.3 |
| B | 11 | 111 | 15906 | 99.95 | 796 | 780 | 151.3 |
| C | 14 | 238 | 123404 | 696.79 | 756 | 762 | 176.0 |
| C | 3 | 233 | 11380 | 60.33 | 756 | 762 | 176.0 |
| C | 0 | 10 | 8424 | 43.53 | 756 | 762 | 176.0 |
| D | 1 | 52 | 452279 | 2496.37 | 757 | 739 | 180.9 |
| D | 7 | 223 | 115096 | 632.23 | 757 | 739 | 180.9 |
| D | 8 | 195 | 90103 | 494.06 | 757 | 739 | 180.9 |
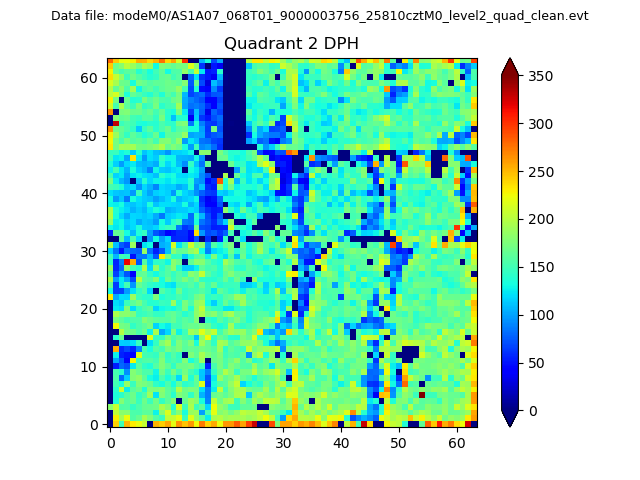
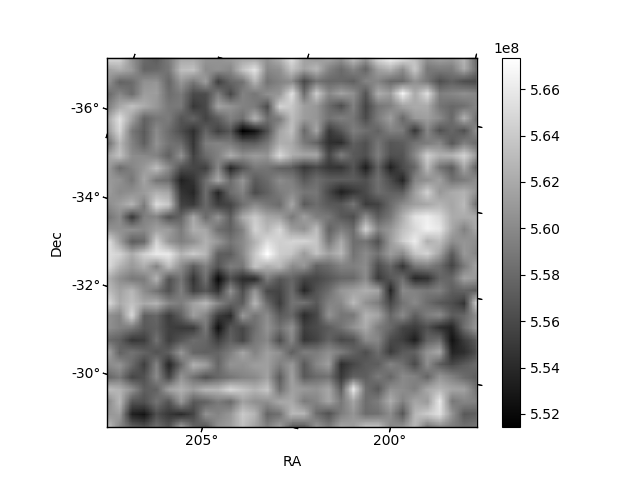
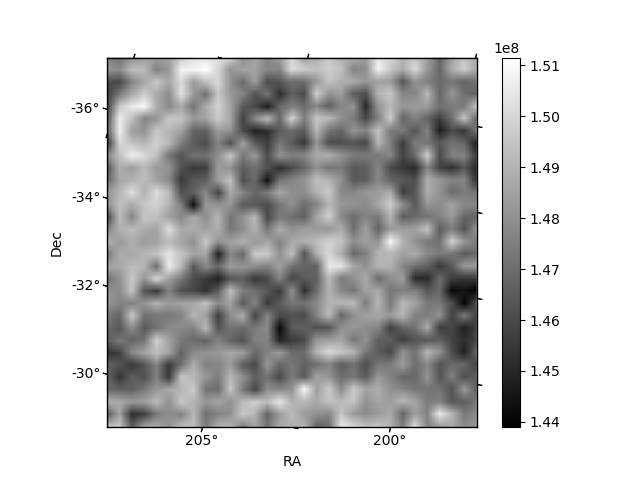
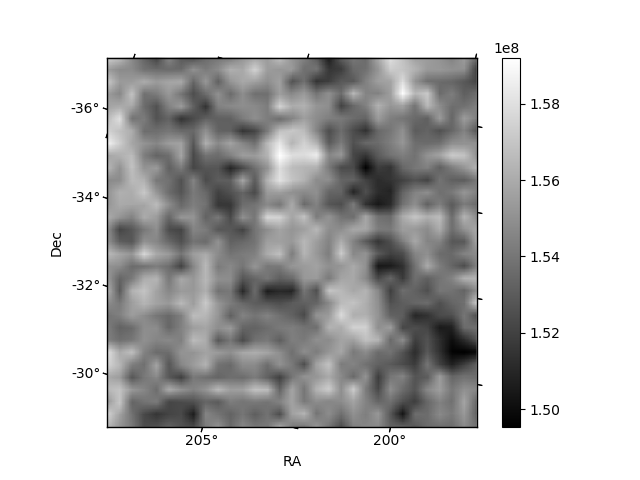
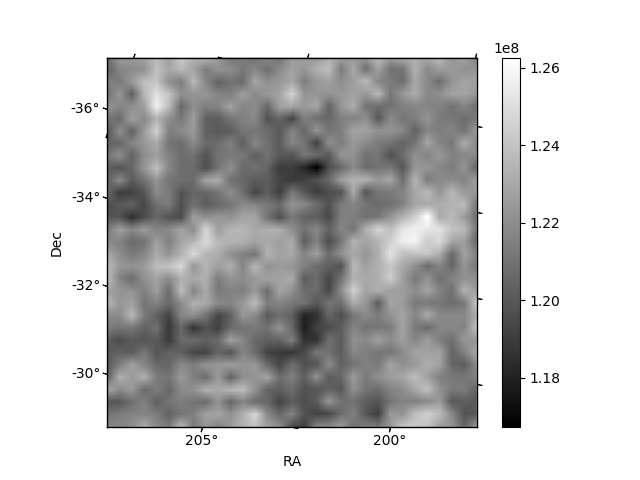
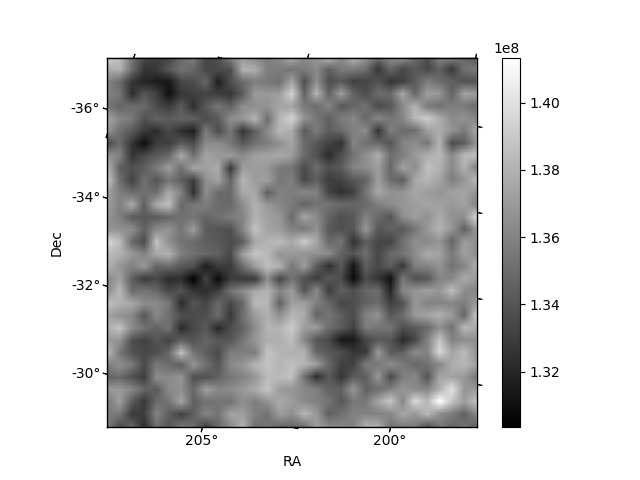
Histogram calculated using DETX and DETY for each event in the final _common_clean file
| Quadrant A |  |
 |
Quadrant B |
|---|---|---|---|
| Quadrant D |  |
 |
Quadrant C |
| Plot type | Count rate plots | Images |
|---|---|---|
| Comparison with Poisson distribution Blue bars denote a histogram of data divided into 1 sec bins. Red curve is a Poisson curve with rate = median count rate of data. |
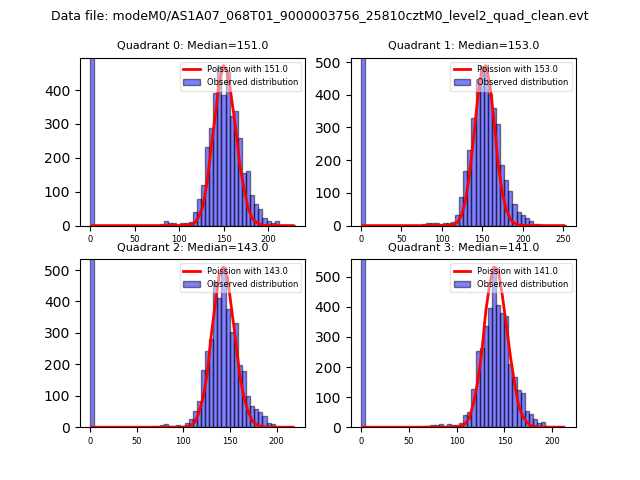 |
 |
| Quadrant-wise count rates Data is divided into 100 sec bins |
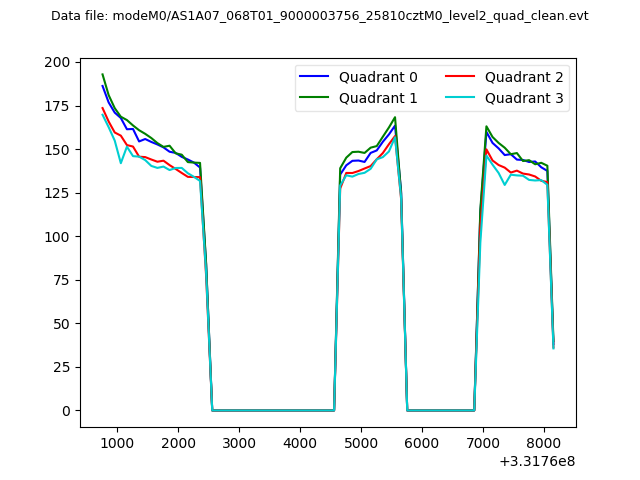 |
|
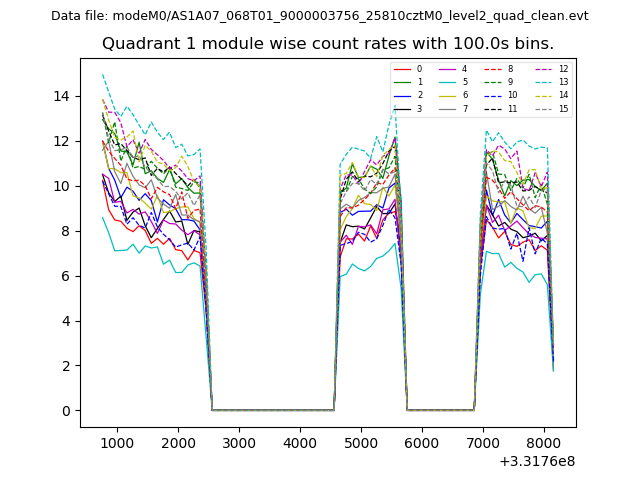
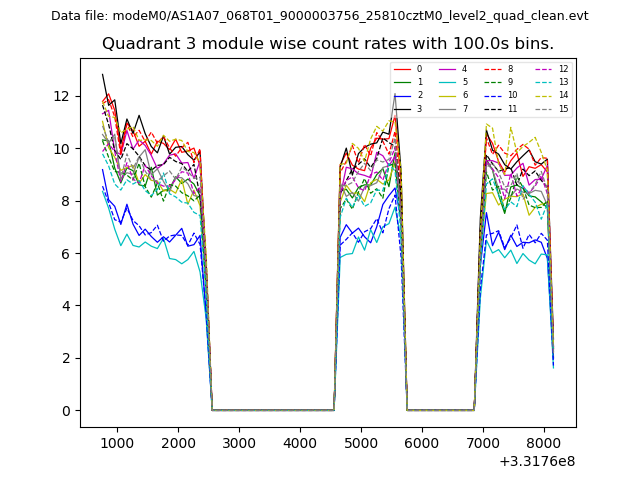
| Module-wise count rates for Quadrant A Data is divided into 100 sec bins |
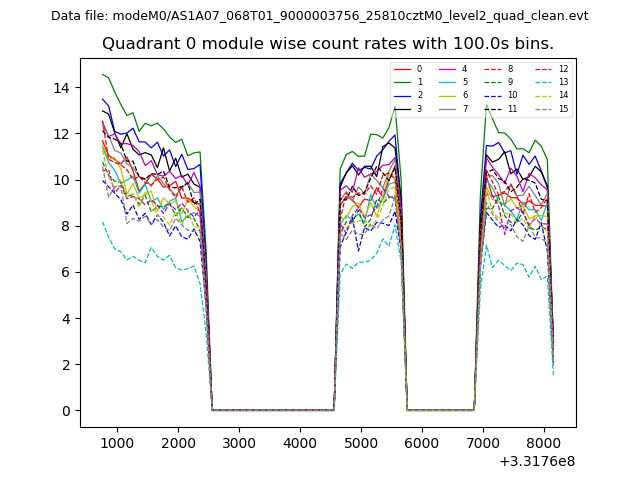 |
 |
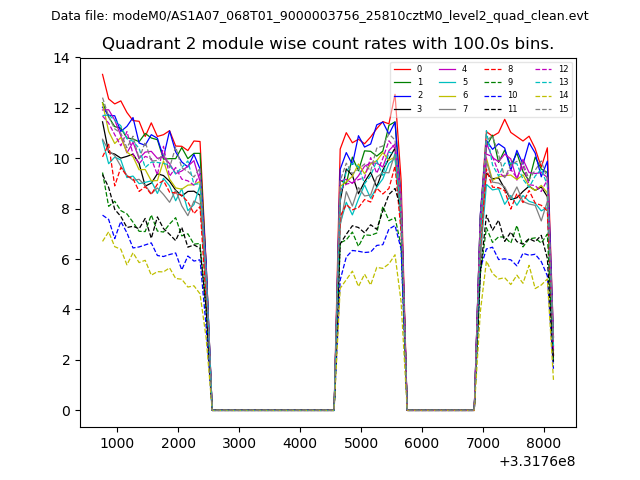
| Module-wise count rates for Quadrant B Data is divided into 100 sec bins |
 |
 |
| Module-wise count rates for Quadrant C Data is divided into 100 sec bins |
 |
 |
| Module-wise count rates for Quadrant D Data is divided into 100 sec bins |
 |
 |
| Parameter | Plot |
|---|---|
| CZT HV Monitor | 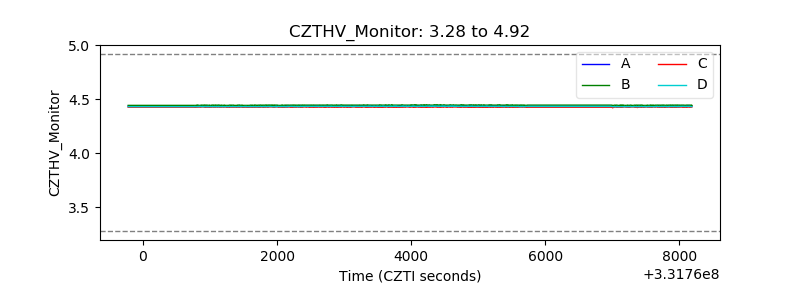 |
| D_VDD |  |
| Temperature 1 | 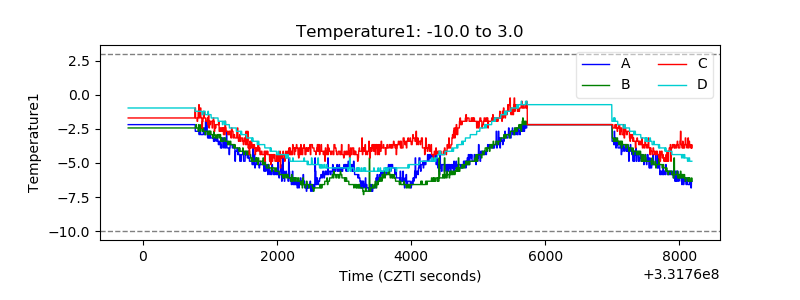 |
| Veto HV Monitor | 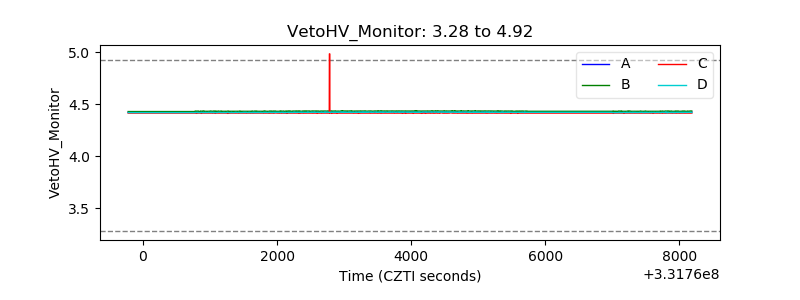 |
| Veto LLD |  |
| Alpha Counter | 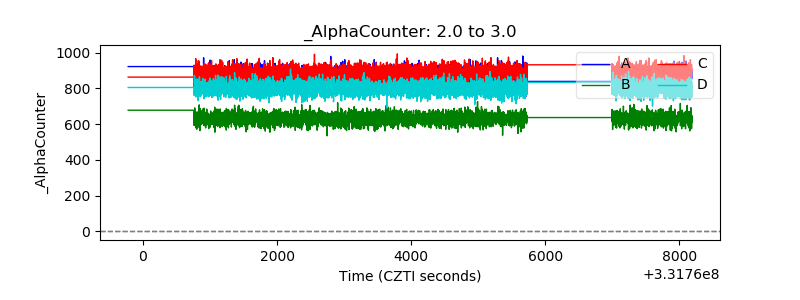 |
| _CPM_Rate | 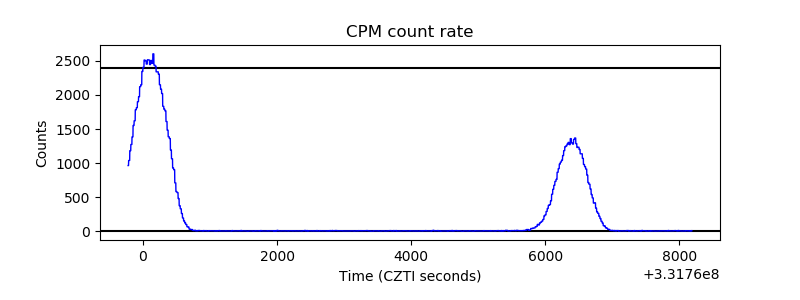 |
| CZT Counter | 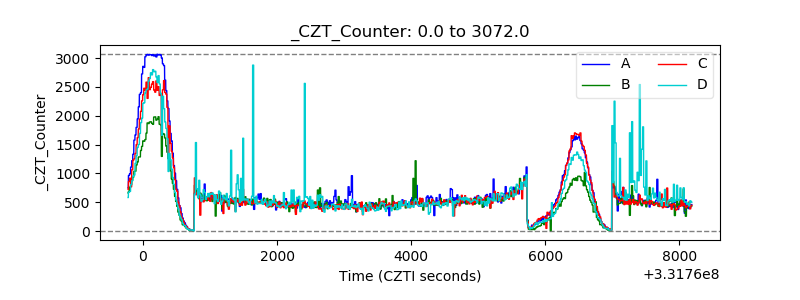 |
| +2.5 Volts monitor |  |
| +5 Volts monitor | 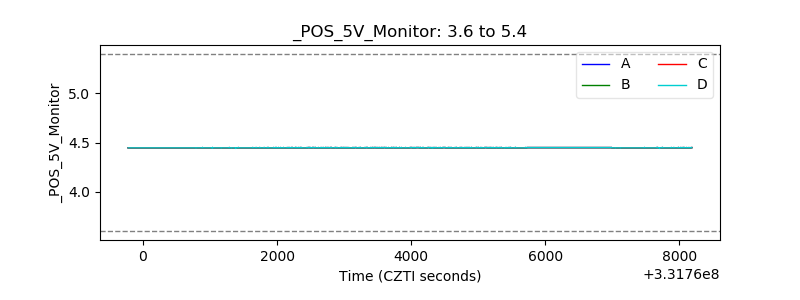 |
| _ROLL_ROT | 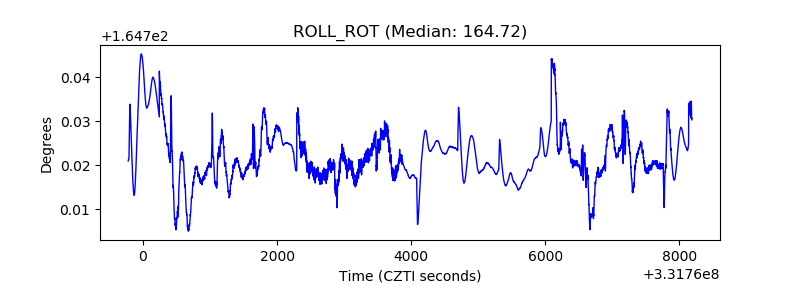 |
| _Roll_DEC | 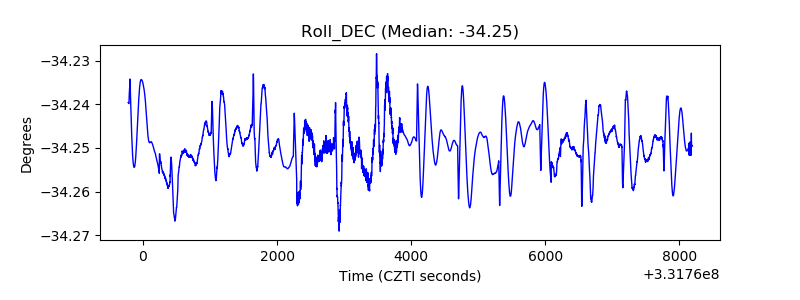 |
| _Roll_RA | 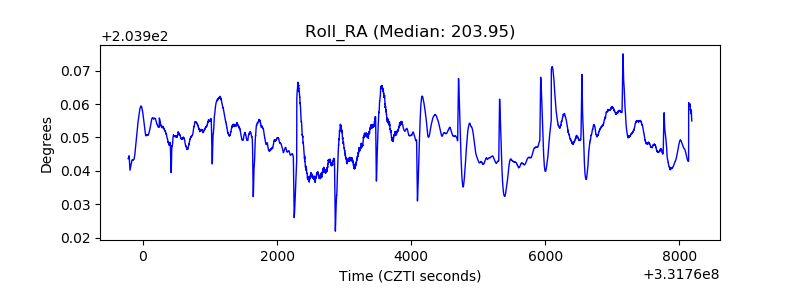 |
| Veto Counter | 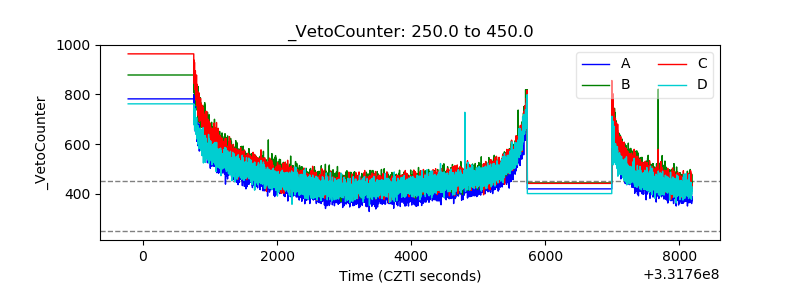 |