| Param | Original file | Final file |
|---|---|---|
| Filename | modeM0/AS1A07_068T01_9000003756_25811cztM0_level2.evt | modeM0/AS1A07_068T01_9000003756_25811cztM0_level2_quad_clean.evt |
| Size (bytes) | 472,916,160 | 90,334,080 |
| Size | 451.0 MB | 86.1 MB |
| Events in quadrant A | 3,327,839 | 583,771 |
| Events in quadrant B | 3,263,472 | 591,351 |
| Events in quadrant C | 3,201,802 | 553,052 |
| Events in quadrant D | 4,079,303 | 545,516 |
| Mode M0 | |||
|---|---|---|---|
| Quadrant | BADHDUFLAG | Total packets | Discarded packets |
| A | 0 | 14038 | 0 |
| B | 0 | 13749 | 0 |
| C | 0 | 13670 | 0 |
| D | 0 | 16446 | 0 |
| Mode M9 | |||
|---|---|---|---|
| Quadrant | BADHDUFLAG | Total packets | Discarded packets |
| A | 0 | 18 | 0 |
| B | 0 | 19 | 0 |
| C | 0 | 19 | 0 |
| D | 0 | 19 | 0 |
| Quadrant | Total seconds | Saturated seconds | Saturation percentage |
|---|---|---|---|
| A | 6627 | 28 | 0.422514% |
| B | 6627 | 25 | 0.377245% |
| C | 6627 | 52 | 0.784669% |
| D | 6626 | 90 | 1.358286% |
Noise dominated data is calculated using 1-second bins in cleaned event files. If a bin has >2000 counts, and if more than 50% of those come from <1% of pixels, then it is considered to be noise-dominated and hence unusable.
| Quadrant | # 1 sec bins | Bins with >0 counts | Bins with >2000 counts | High rate bins dominated by noise | Noise dominated (total time) | Noise dominated (detector-on time) | Marked lightcurve |
|---|---|---|---|---|---|---|---|
| A | 7602 | 6627 | 3 | 3 | 0.04% | 0.05% | 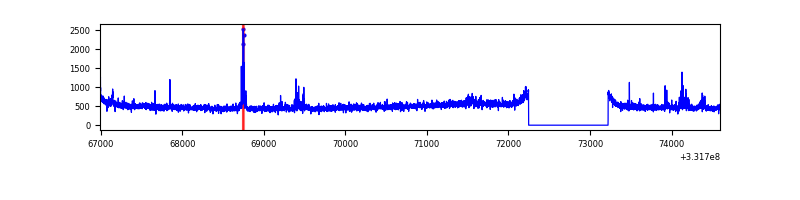 |
| B | 7602 | 6627 | 0 | 0 | 0.00% | 0.00% | 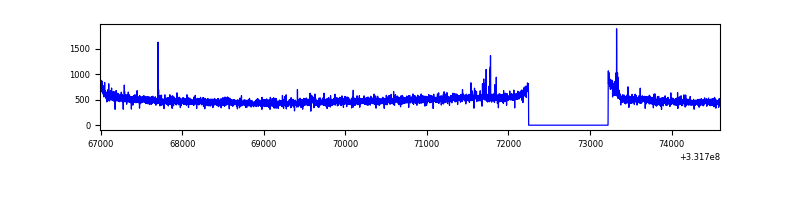 |
| C | 7602 | 6627 | 0 | 0 | 0.00% | 0.00% | 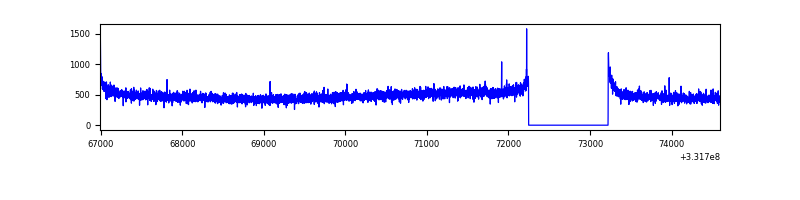 |
| D | 7601 | 6626 | 67 | 67 | 0.88% | 1.01% | 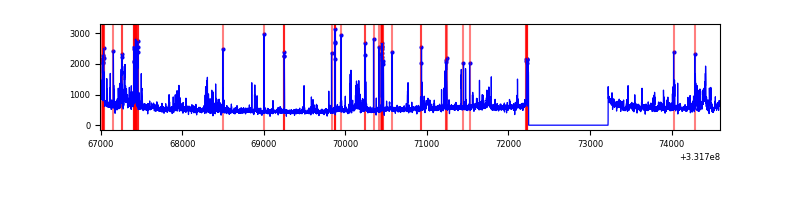 |
Top three noisy pixels from each quadrant. If the there are fewer than three noisy pixels in the level2.evt file, extra rows are filled as -1
| Pixel properties | Quadrant properties | ||||||
|---|---|---|---|---|---|---|---|
| Quadrant | DetID | PixID | Counts | Sigma | Mean | Median | Sigma |
| A | 0 | 13 | 148436 | 889.38 | 824 | 808 | 166.0 |
| A | 13 | 254 | 8535 | 46.55 | 824 | 808 | 166.0 |
| A | 3 | 137 | 7569 | 40.73 | 824 | 808 | 166.0 |
| B | 12 | 111 | 19209 | 118.22 | 819 | 803 | 155.7 |
| B | 11 | 111 | 16991 | 103.97 | 819 | 803 | 155.7 |
| B | 0 | 219 | 16629 | 101.65 | 819 | 803 | 155.7 |
| C | 14 | 238 | 125949 | 686.59 | 780 | 787 | 182.3 |
| C | 3 | 233 | 26981 | 143.69 | 780 | 787 | 182.3 |
| C | 4 | 175 | 5762 | 27.29 | 780 | 787 | 182.3 |
| D | 1 | 52 | 597423 | 3184.38 | 783 | 763 | 187.4 |
| D | 8 | 195 | 300377 | 1599.04 | 783 | 763 | 187.4 |
| D | 7 | 223 | 133168 | 706.65 | 783 | 763 | 187.4 |
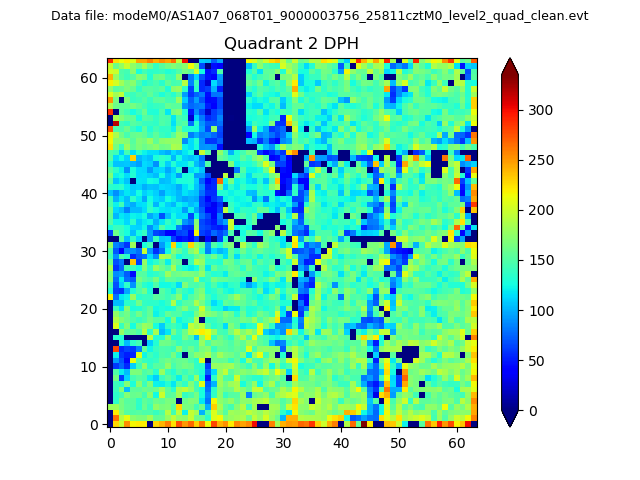
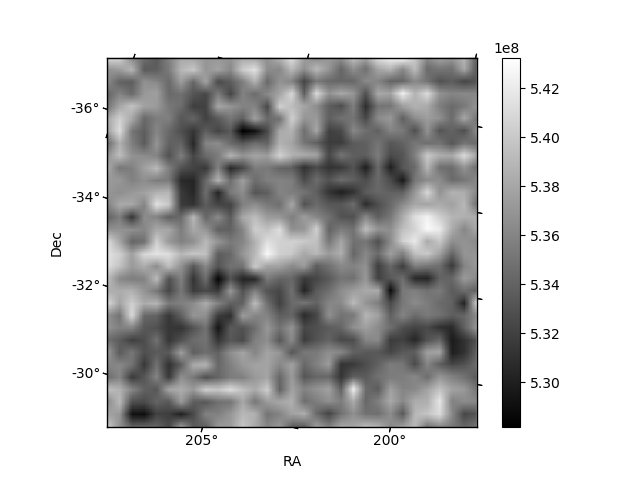
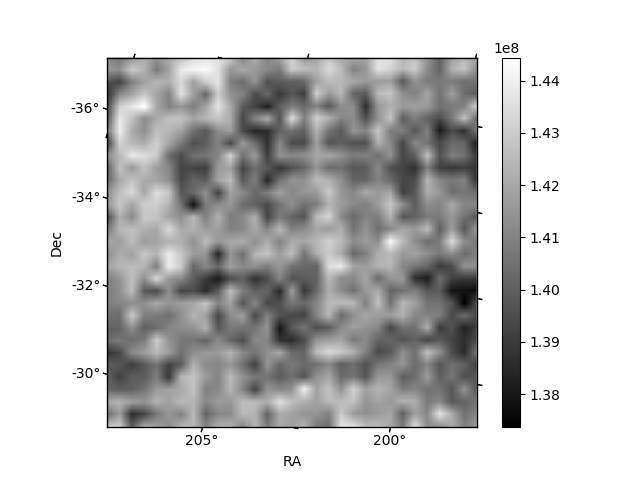
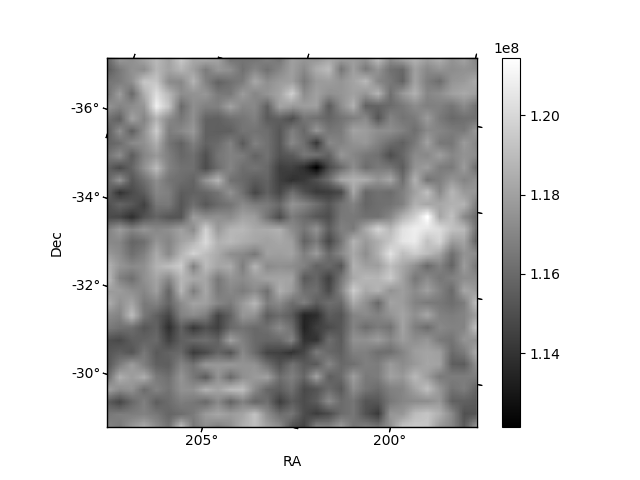
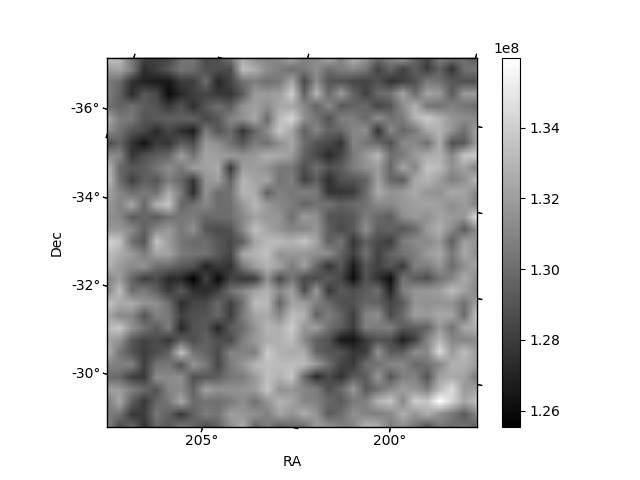
Histogram calculated using DETX and DETY for each event in the final _common_clean file
| Quadrant A | 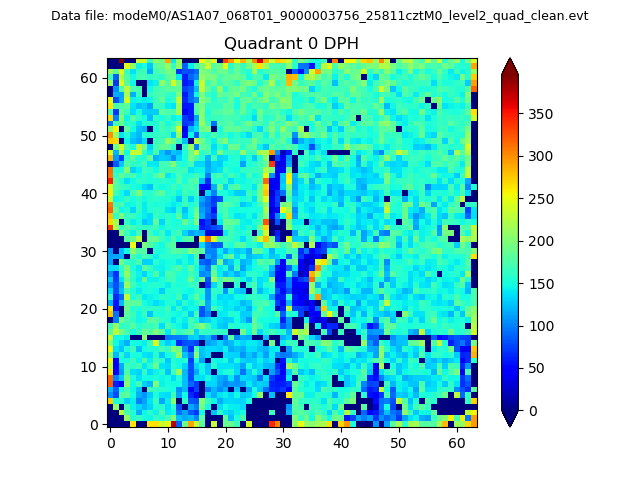 |
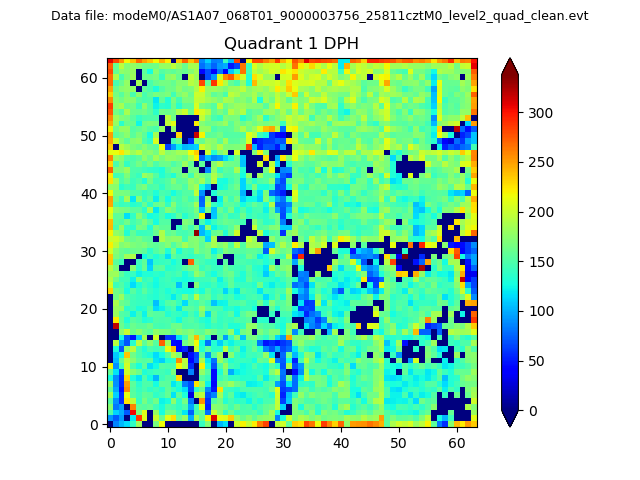 |
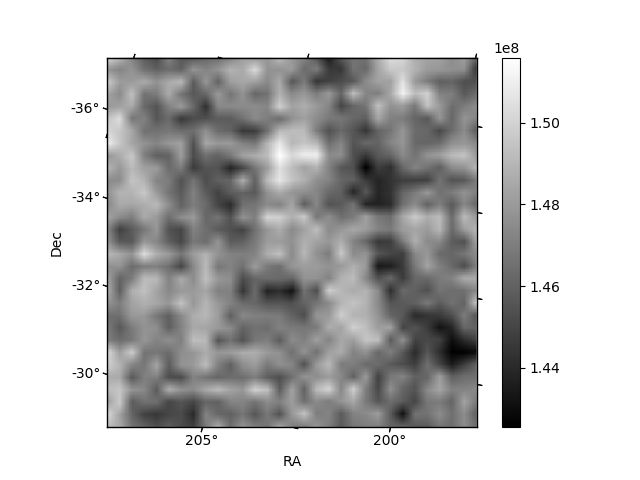
Quadrant B |
|---|---|---|---|
| Quadrant D | 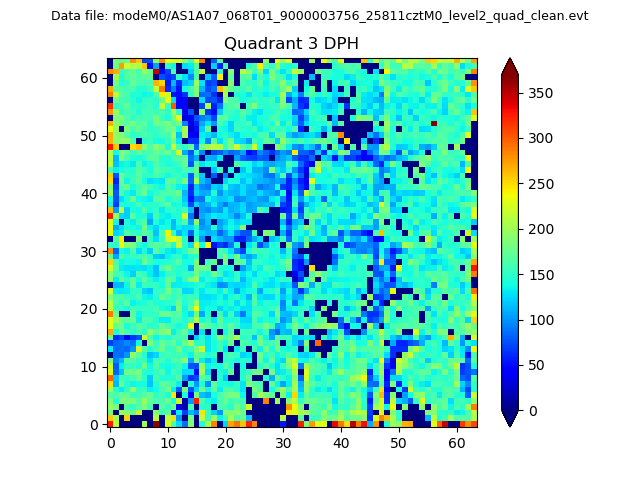 |
 |
Quadrant C |
| Plot type | Count rate plots | Images |
|---|---|---|
| Comparison with Poisson distribution Blue bars denote a histogram of data divided into 1 sec bins. Red curve is a Poisson curve with rate = median count rate of data. |
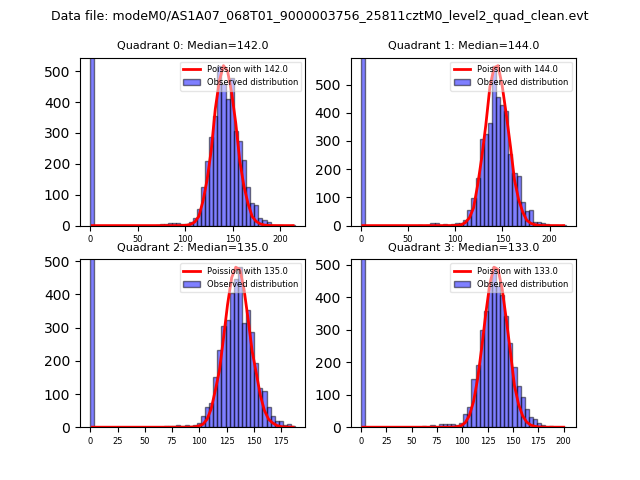 |
 |
| Quadrant-wise count rates Data is divided into 100 sec bins |
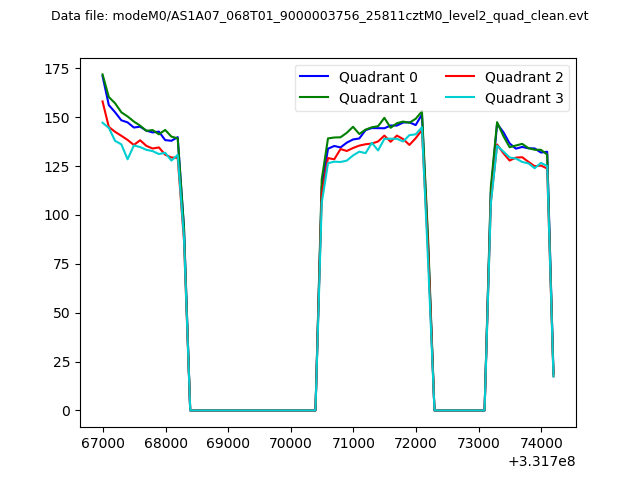 |
|
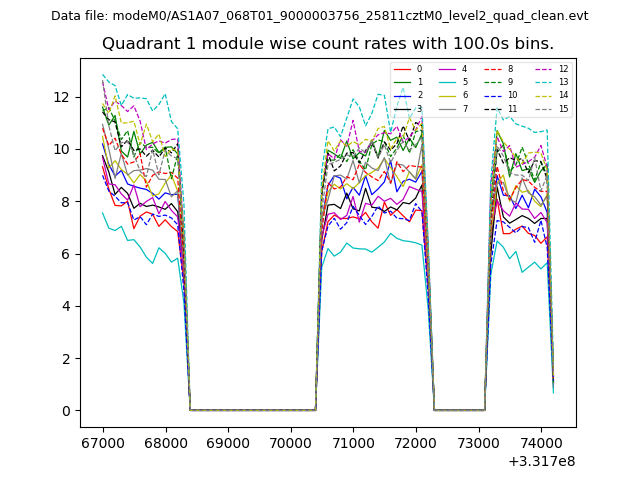
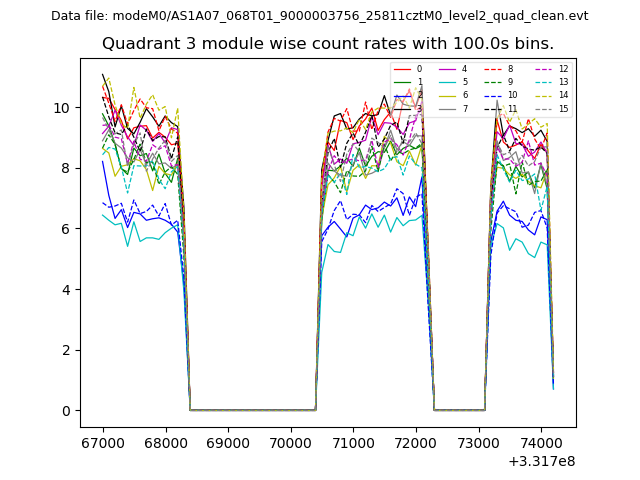
| Module-wise count rates for Quadrant A Data is divided into 100 sec bins |
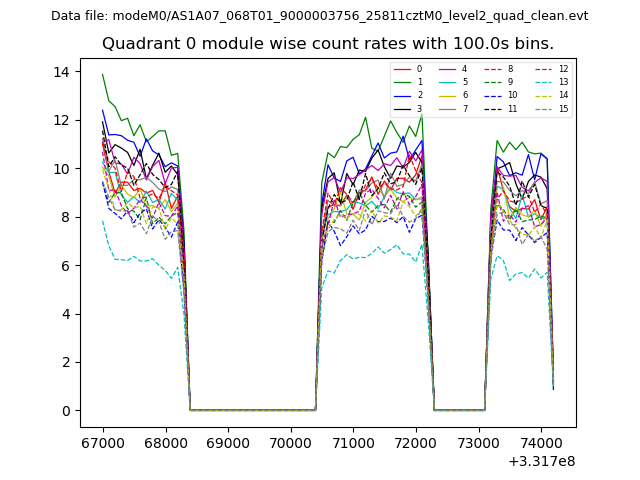 |
 |
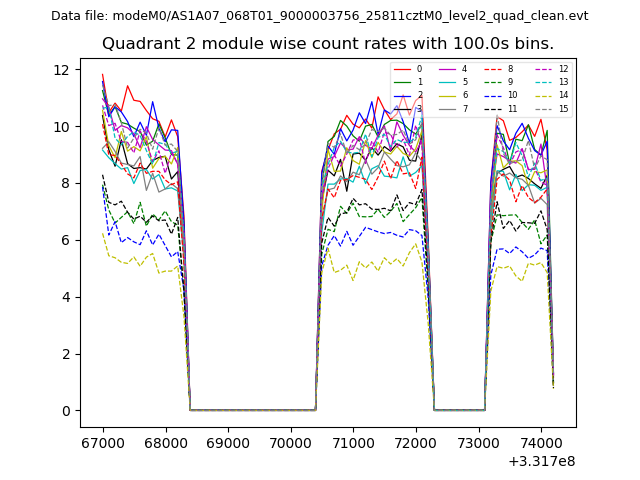
| Module-wise count rates for Quadrant B Data is divided into 100 sec bins |
 |
 |
| Module-wise count rates for Quadrant C Data is divided into 100 sec bins |
 |
 |
| Module-wise count rates for Quadrant D Data is divided into 100 sec bins |
 |
 |
| Parameter | Plot |
|---|---|
| CZT HV Monitor |  |
| D_VDD | 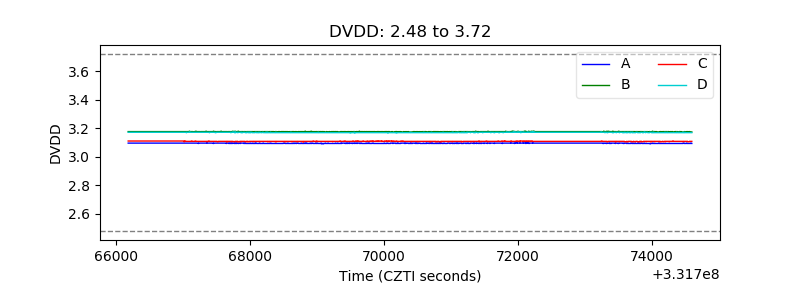 |
| Temperature 1 | 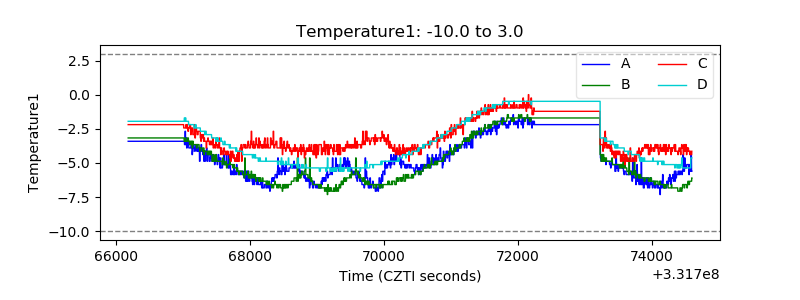 |
| Veto HV Monitor | 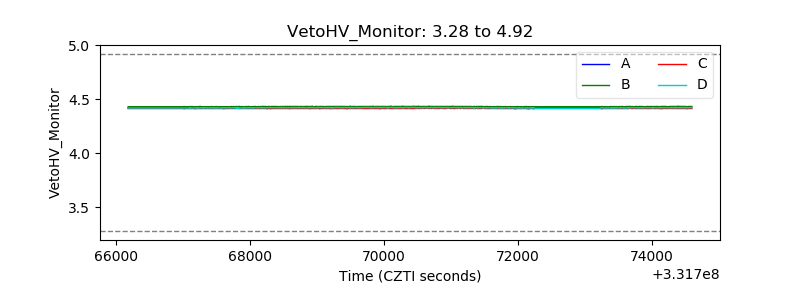 |
| Veto LLD | 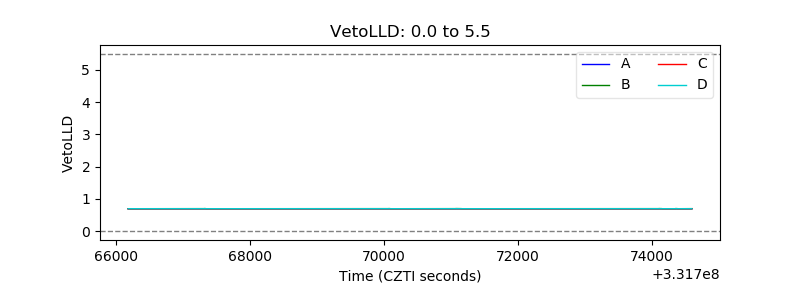 |
| Alpha Counter | 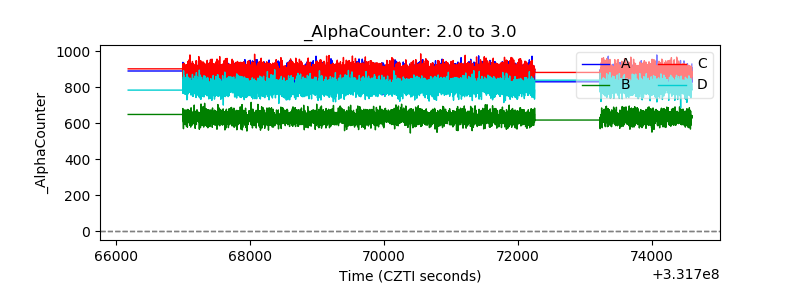 |
| _CPM_Rate | 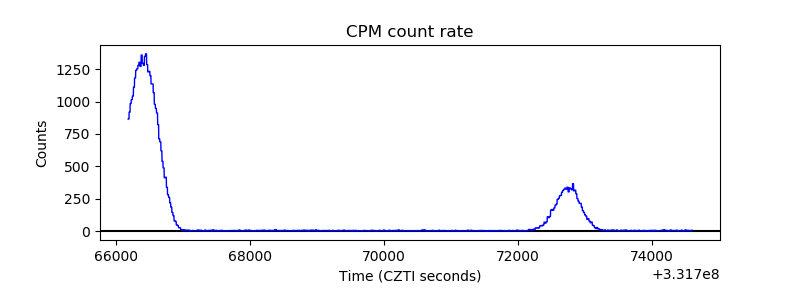 |
| CZT Counter | 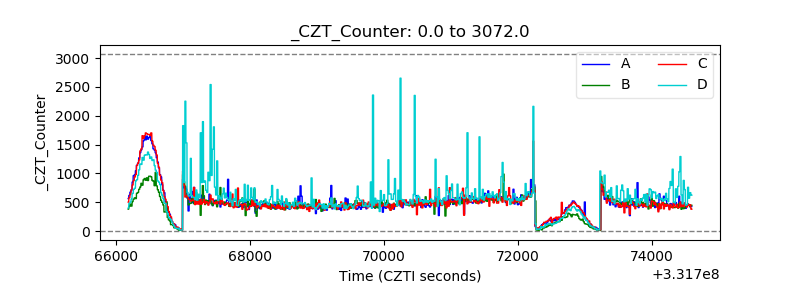 |
| +2.5 Volts monitor |  |
| +5 Volts monitor |  |
| _ROLL_ROT |  |
| _Roll_DEC | 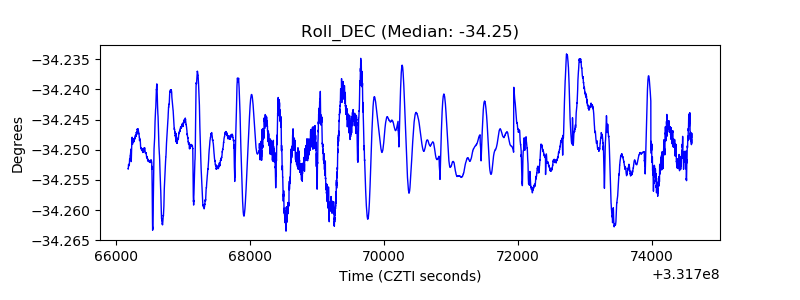 |
| _Roll_RA | 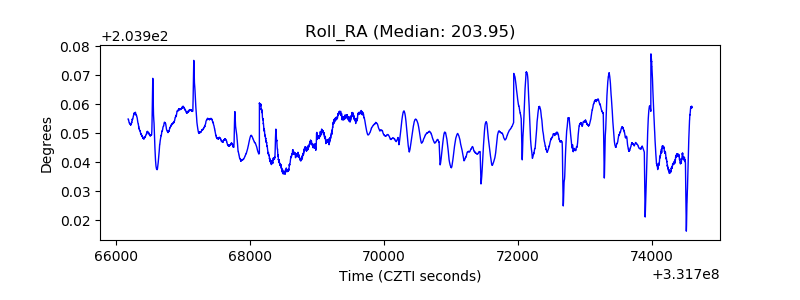 |
| Veto Counter |  |