| Param | Original file | Final file |
|---|---|---|
| Filename | modeM0/AS1A07_068T01_9000003756_25812cztM0_level2.evt | modeM0/AS1A07_068T01_9000003756_25812cztM0_level2_quad_clean.evt |
| Size (bytes) | 1,997,527,680 | 349,744,320 |
| Size | 1.9 GB | 333.5 MB |
| Events in quadrant A | 14,815,883 | 2,211,966 |
| Events in quadrant B | 13,591,909 | 2,290,335 |
| Events in quadrant C | 13,273,986 | 2,143,006 |
| Events in quadrant D | 17,003,282 | 2,102,250 |
| Mode M0 | |||
|---|---|---|---|
| Quadrant | BADHDUFLAG | Total packets | Discarded packets |
| A | 0 | 61011 | 0 |
| B | 0 | 56879 | 0 |
| C | 0 | 56209 | 0 |
| D | 0 | 68061 | 0 |
| Mode M9 | |||
|---|---|---|---|
| Quadrant | BADHDUFLAG | Total packets | Discarded packets |
| A | 0 | 57 | 0 |
| B | 0 | 57 | 0 |
| C | 0 | 57 | 0 |
| D | 0 | 57 | 0 |
| Quadrant | Total seconds | Saturated seconds | Saturation percentage |
|---|---|---|---|
| A | 26843 | 583 | 2.171888% |
| B | 26843 | 237 | 0.882912% |
| C | 26843 | 330 | 1.229371% |
| D | 26844 | 446 | 1.661451% |
Noise dominated data is calculated using 1-second bins in cleaned event files. If a bin has >2000 counts, and if more than 50% of those come from <1% of pixels, then it is considered to be noise-dominated and hence unusable.
| Quadrant | # 1 sec bins | Bins with >0 counts | Bins with >2000 counts | High rate bins dominated by noise | Noise dominated (total time) | Noise dominated (detector-on time) | Marked lightcurve |
|---|---|---|---|---|---|---|---|
| A | 32388 | 26845 | 411 | 411 | 1.27% | 1.53% | 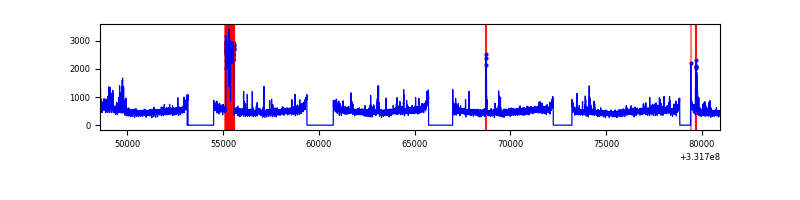 |
| B | 32388 | 26843 | 2 | 2 | 0.01% | 0.01% | 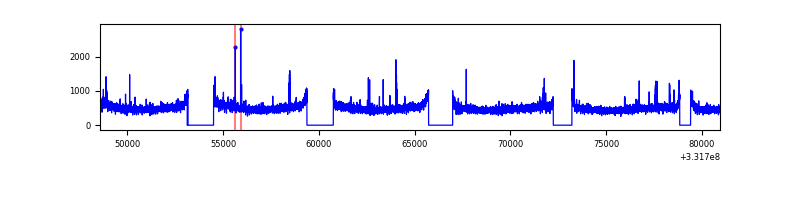 |
| C | 32388 | 26844 | 0 | 0 | 0.00% | 0.00% | 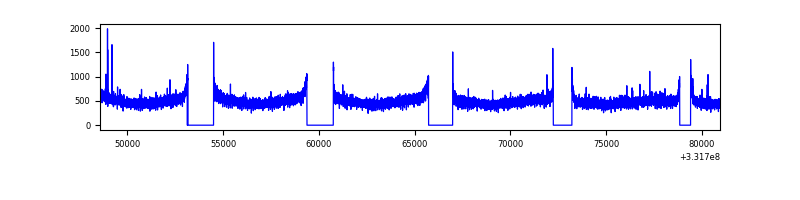 |
| D | 32389 | 26846 | 333 | 333 | 1.03% | 1.24% | 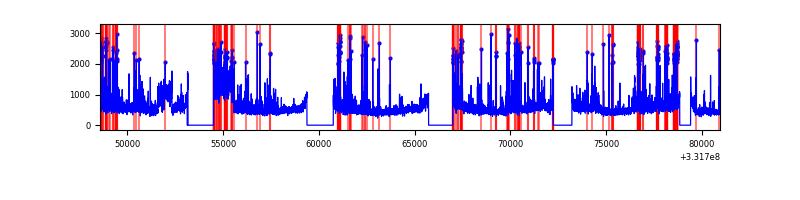 |
Top three noisy pixels from each quadrant. If the there are fewer than three noisy pixels in the level2.evt file, extra rows are filled as -1
| Pixel properties | Quadrant properties | ||||||
|---|---|---|---|---|---|---|---|
| Quadrant | DetID | PixID | Counts | Sigma | Mean | Median | Sigma |
| A | 0 | 13 | 1737627 | 2573.08 | 3392 | 3332 | 674.0 |
| A | 13 | 254 | 35475 | 47.69 | 3392 | 3332 | 674.0 |
| A | 3 | 137 | 30683 | 40.58 | 3392 | 3332 | 674.0 |
| B | 12 | 111 | 78154 | 117.03 | 3408 | 3334 | 639.3 |
| B | 11 | 111 | 69733 | 103.86 | 3408 | 3334 | 639.3 |
| B | 0 | 219 | 64929 | 96.35 | 3408 | 3334 | 639.3 |
| C | 14 | 238 | 524872 | 699.13 | 3239 | 3265 | 746.1 |
| C | 3 | 233 | 92569 | 119.7 | 3239 | 3265 | 746.1 |
| C | 13 | 61 | 22292 | 25.5 | 3239 | 3265 | 746.1 |
| D | 1 | 52 | 2162828 | 2799.47 | 3254 | 3178 | 771.5 |
| D | 7 | 223 | 1323523 | 1711.51 | 3254 | 3178 | 771.5 |
| D | 8 | 195 | 714058 | 921.48 | 3254 | 3178 | 771.5 |
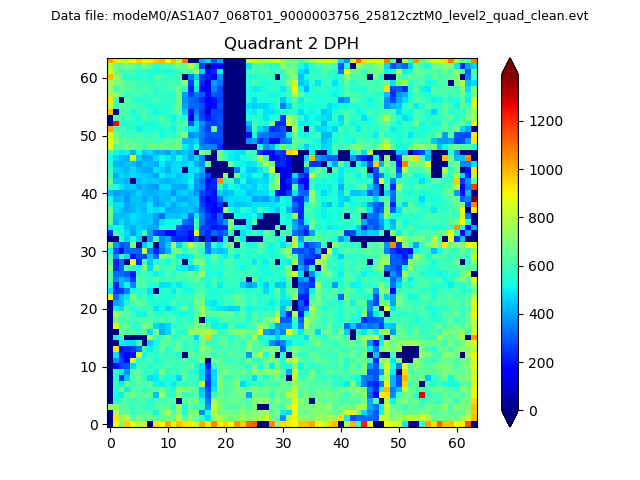
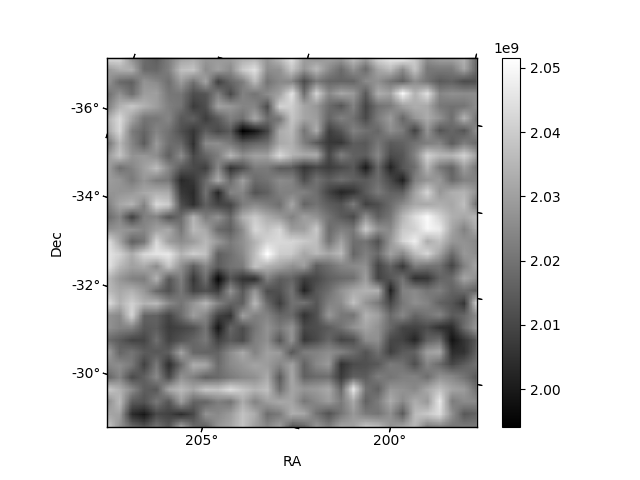
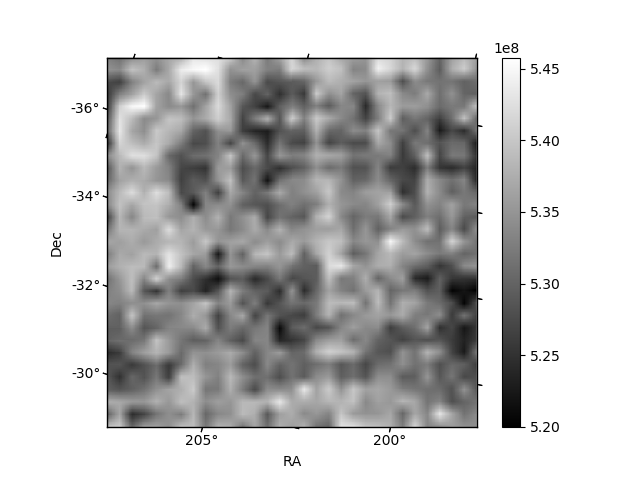
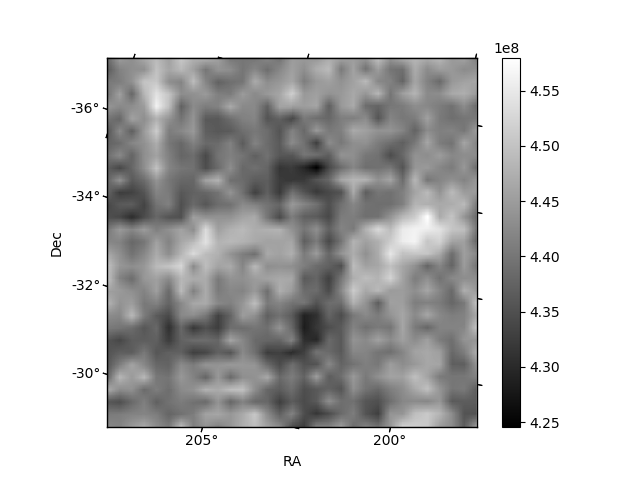
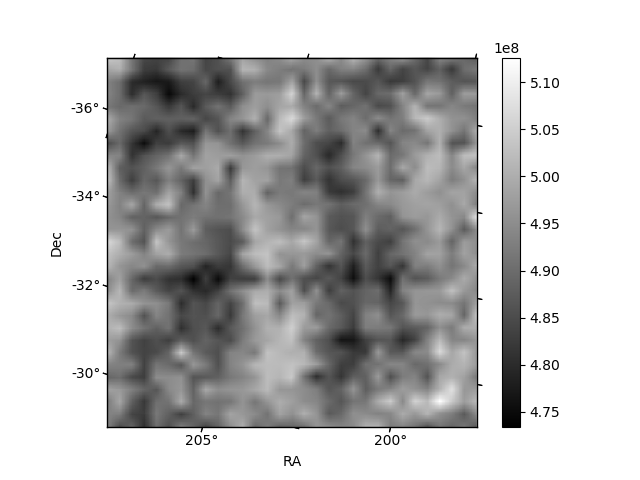
Histogram calculated using DETX and DETY for each event in the final _common_clean file
| Quadrant A | 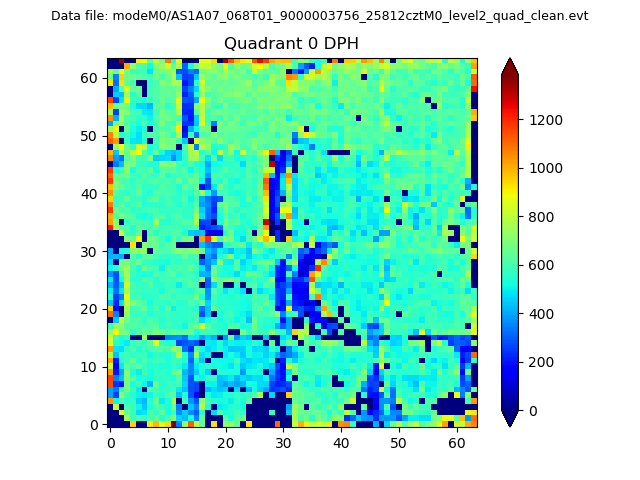 |
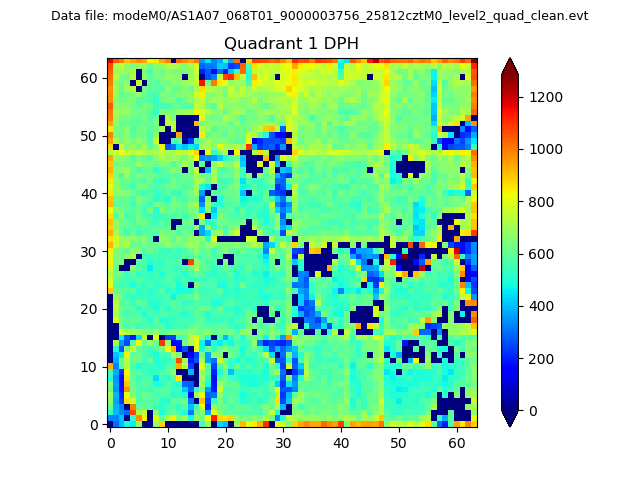 |
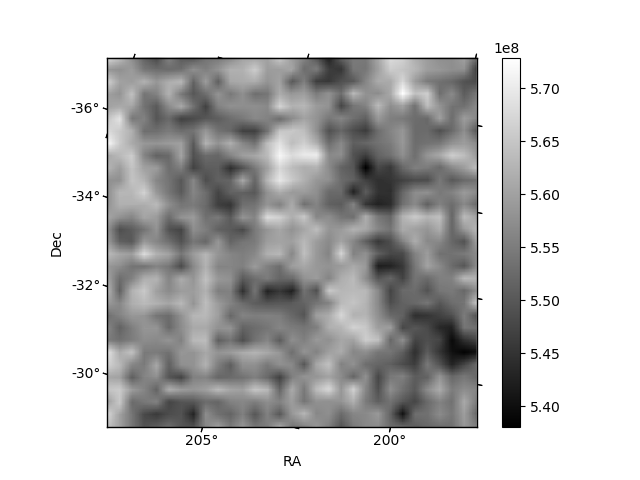
Quadrant B |
|---|---|---|---|
| Quadrant D | 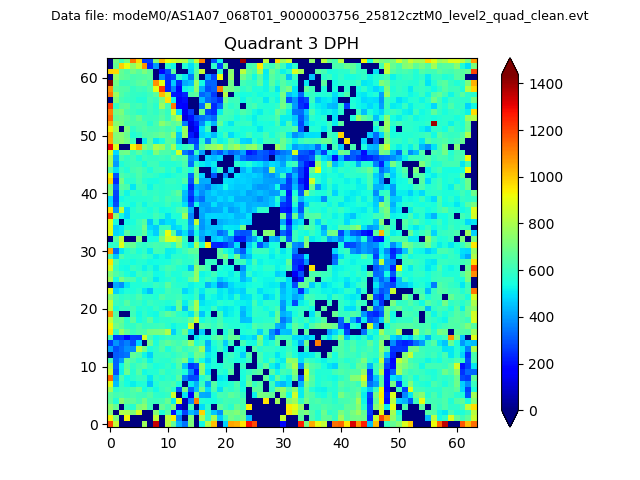 |
 |
Quadrant C |
| Plot type | Count rate plots | Images |
|---|---|---|
| Comparison with Poisson distribution Blue bars denote a histogram of data divided into 1 sec bins. Red curve is a Poisson curve with rate = median count rate of data. |
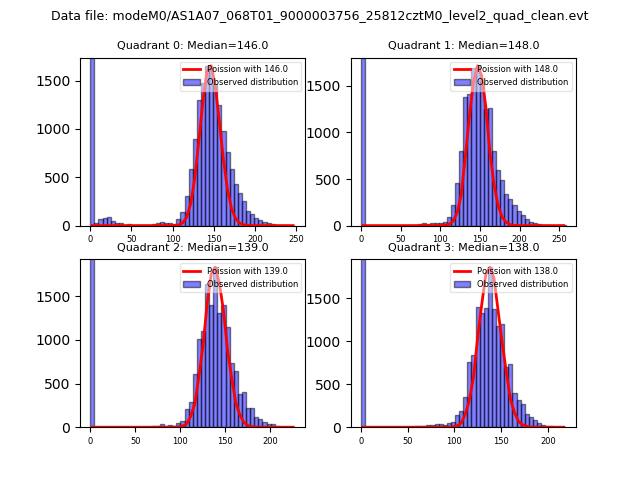 |
 |
| Quadrant-wise count rates Data is divided into 100 sec bins |
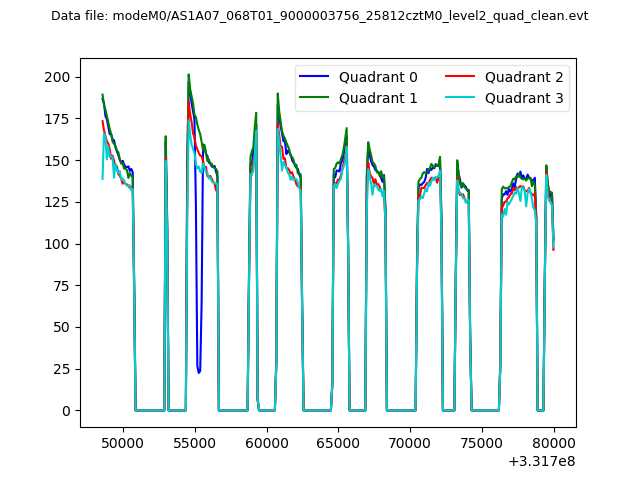 |
|
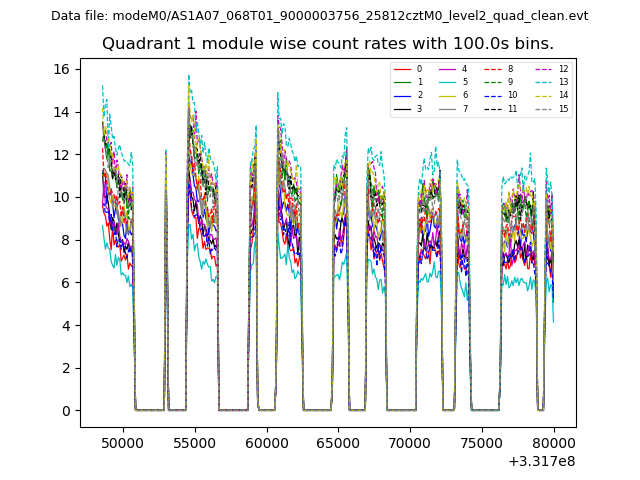
| Module-wise count rates for Quadrant A Data is divided into 100 sec bins |
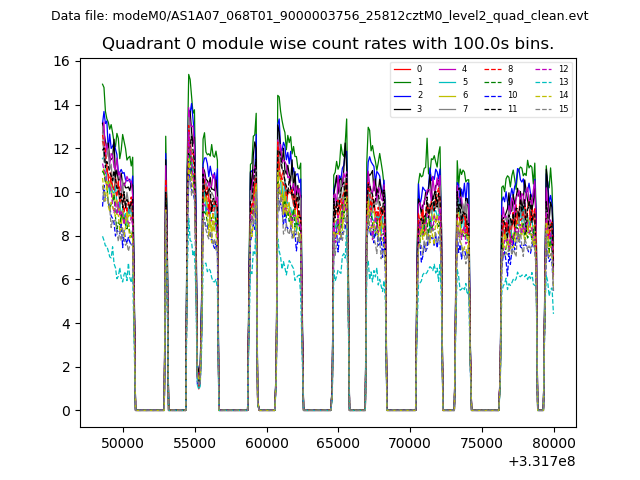 |
 |
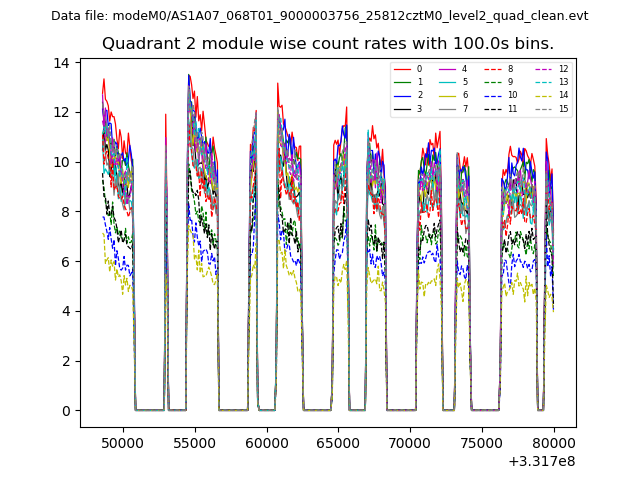
| Module-wise count rates for Quadrant B Data is divided into 100 sec bins |
 |
 |
| Module-wise count rates for Quadrant C Data is divided into 100 sec bins |
 |
 |
| Module-wise count rates for Quadrant D Data is divided into 100 sec bins |
 |
 |
| Parameter | Plot |
|---|---|
| CZT HV Monitor | 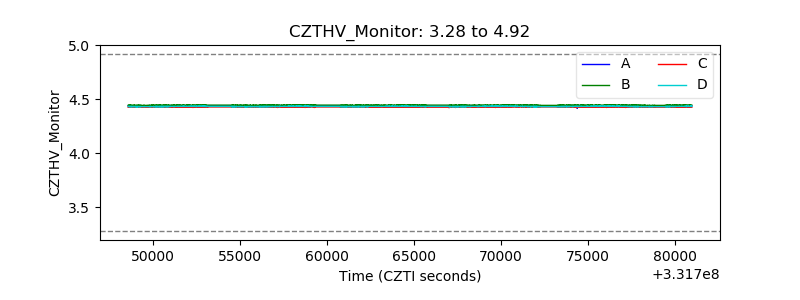 |
| D_VDD | 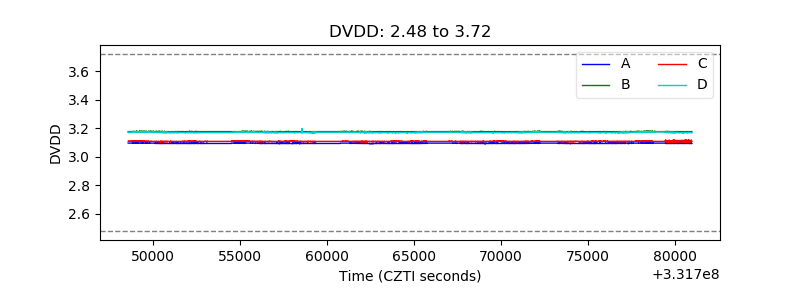 |
| Temperature 1 | 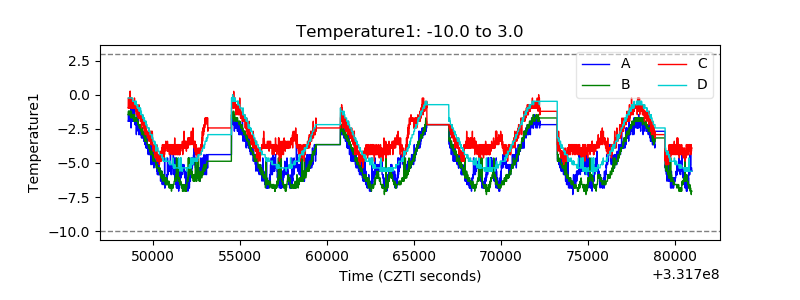 |
| Veto HV Monitor | 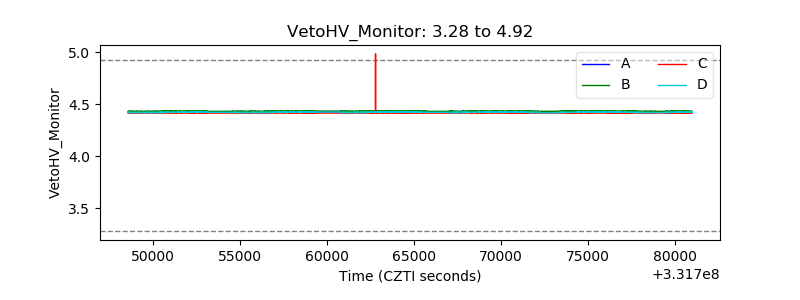 |
| Veto LLD |  |
| Alpha Counter | 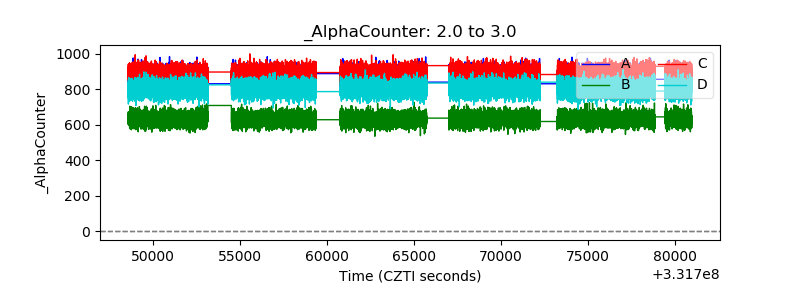 |
| _CPM_Rate | 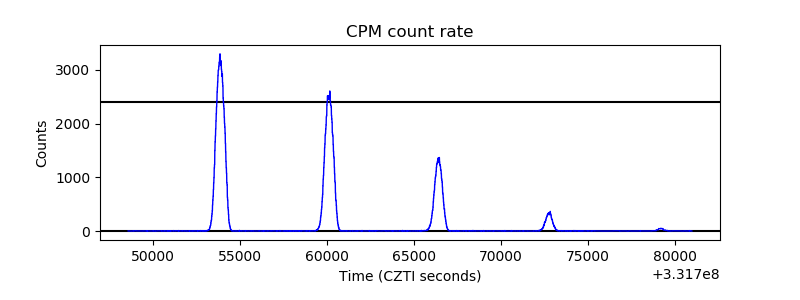 |
| CZT Counter | 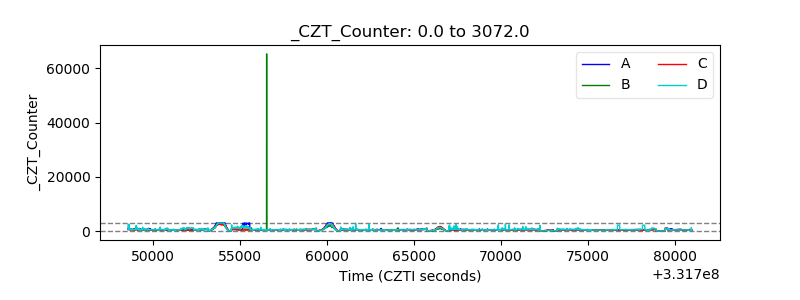 |
| +2.5 Volts monitor |  |
| +5 Volts monitor |  |
| _ROLL_ROT |  |
| _Roll_DEC | 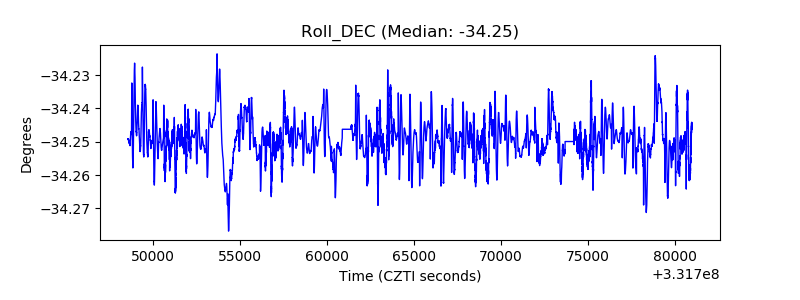 |
| _Roll_RA | 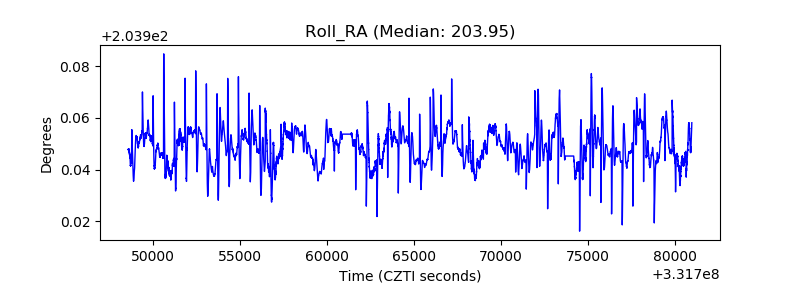 |
| Veto Counter | 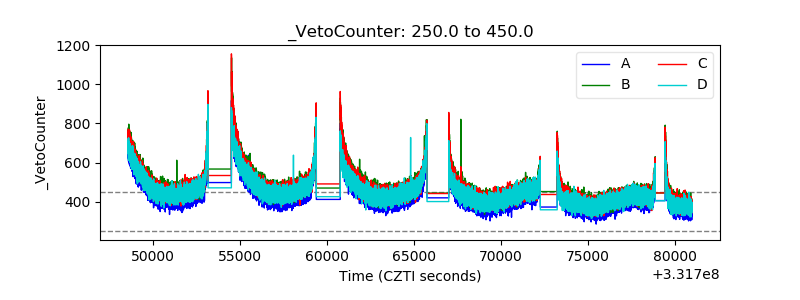 |