| Param | Original file | Final file |
|---|---|---|
| Filename | modeM0/AS1A07_068T01_9000003756_25817cztM0_level2.evt | modeM0/AS1A07_068T01_9000003756_25817cztM0_level2_quad_clean.evt |
| Size (bytes) | 1,259,380,800 | 242,455,680 |
| Size | 1.2 GB | 231.2 MB |
| Events in quadrant A | 9,033,378 | 1,553,148 |
| Events in quadrant B | 8,874,880 | 1,562,576 |
| Events in quadrant C | 8,848,982 | 1,484,166 |
| Events in quadrant D | 10,141,765 | 1,478,661 |
| Mode M0 | |||
|---|---|---|---|
| Quadrant | BADHDUFLAG | Total packets | Discarded packets |
| A | 0 | 38426 | 0 |
| B | 0 | 37801 | 0 |
| C | 0 | 37775 | 0 |
| D | 0 | 41015 | 0 |
| Mode M9 | |||
|---|---|---|---|
| Quadrant | BADHDUFLAG | Total packets | Discarded packets |
| A | 0 | 20 | 0 |
| B | 0 | 20 | 0 |
| C | 0 | 20 | 0 |
| D | 0 | 20 | 0 |
| Quadrant | Total seconds | Saturated seconds | Saturation percentage |
|---|---|---|---|
| A | 18364 | 209 | 1.138096% |
| B | 18364 | 211 | 1.148987% |
| C | 18365 | 295 | 1.606316% |
| D | 18365 | 215 | 1.170705% |
Noise dominated data is calculated using 1-second bins in cleaned event files. If a bin has >2000 counts, and if more than 50% of those come from <1% of pixels, then it is considered to be noise-dominated and hence unusable.
| Quadrant | # 1 sec bins | Bins with >0 counts | Bins with >2000 counts | High rate bins dominated by noise | Noise dominated (total time) | Noise dominated (detector-on time) | Marked lightcurve |
|---|---|---|---|---|---|---|---|
| A | 20269 | 18364 | 0 | 0 | 0.00% | 0.00% | 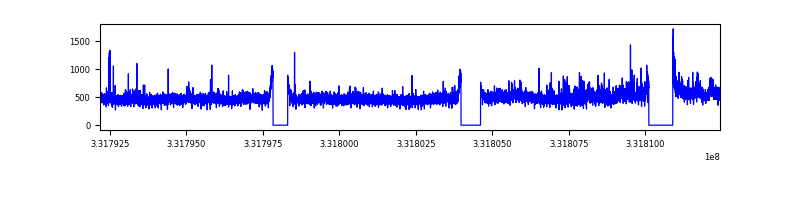 |
| B | 20269 | 18364 | 14 | 14 | 0.07% | 0.08% | 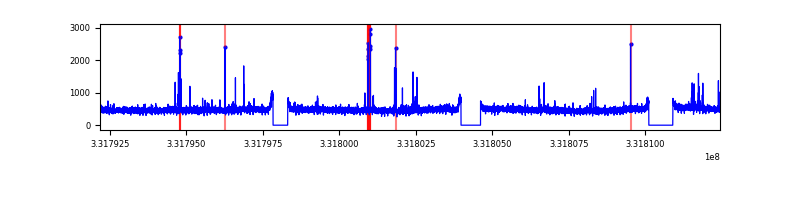 |
| C | 20270 | 18365 | 8 | 8 | 0.04% | 0.04% | 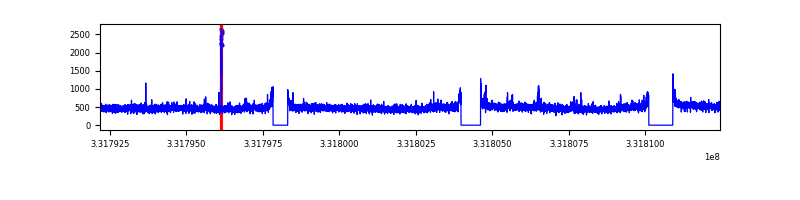 |
| D | 20270 | 18365 | 64 | 64 | 0.32% | 0.35% | 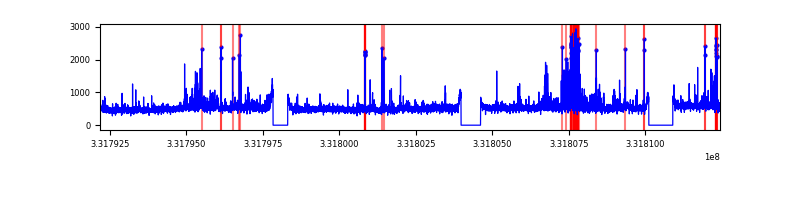 |
Top three noisy pixels from each quadrant. If the there are fewer than three noisy pixels in the level2.evt file, extra rows are filled as -1
| Pixel properties | Quadrant properties | ||||||
|---|---|---|---|---|---|---|---|
| Quadrant | DetID | PixID | Counts | Sigma | Mean | Median | Sigma |
| A | 0 | 13 | 392756 | 871.67 | 2234 | 2187 | 448.1 |
| A | 13 | 254 | 25205 | 51.37 | 2234 | 2187 | 448.1 |
| A | 9 | 130 | 21646 | 43.43 | 2234 | 2187 | 448.1 |
| B | 4 | 171 | 82814 | 191.06 | 2209 | 2152 | 422.2 |
| B | 12 | 111 | 53774 | 122.27 | 2209 | 2152 | 422.2 |
| B | 11 | 111 | 48120 | 108.88 | 2209 | 2152 | 422.2 |
| C | 14 | 238 | 340122 | 677.33 | 2126 | 2140 | 499.0 |
| C | 3 | 233 | 190125 | 376.73 | 2126 | 2140 | 499.0 |
| C | 0 | 207 | 31240 | 58.32 | 2126 | 2140 | 499.0 |
| D | 8 | 195 | 993153 | 1925.96 | 2155 | 2100 | 514.6 |
| D | 7 | 80 | 557726 | 1079.77 | 2155 | 2100 | 514.6 |
| D | 1 | 52 | 375078 | 724.83 | 2155 | 2100 | 514.6 |
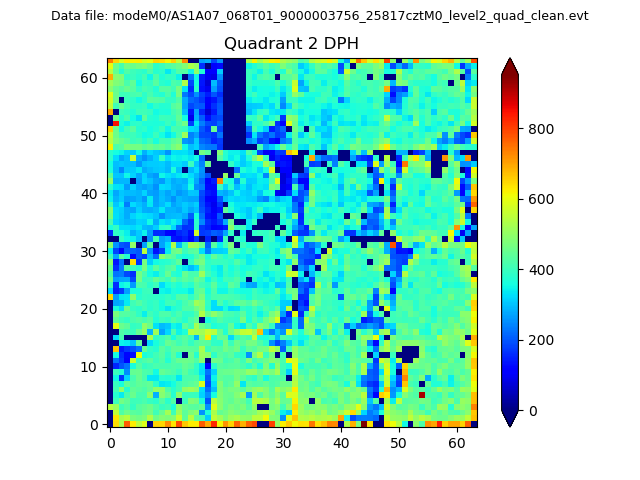
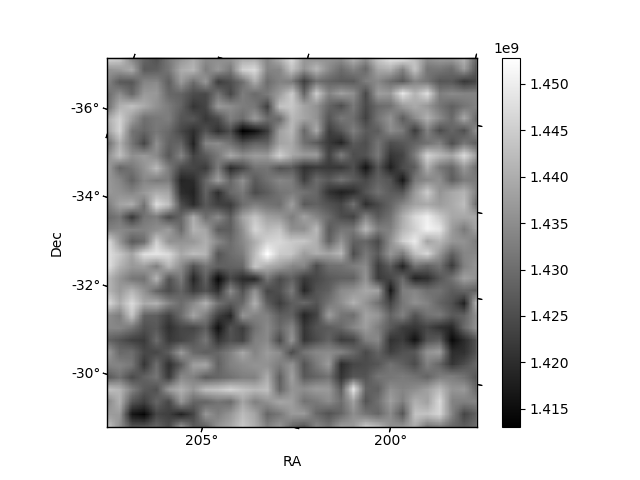
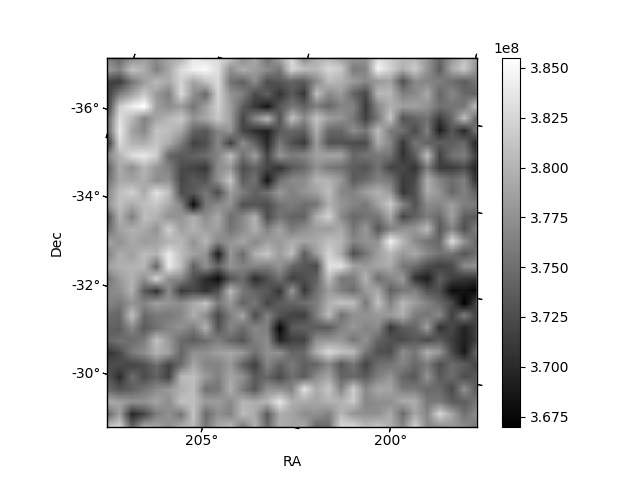
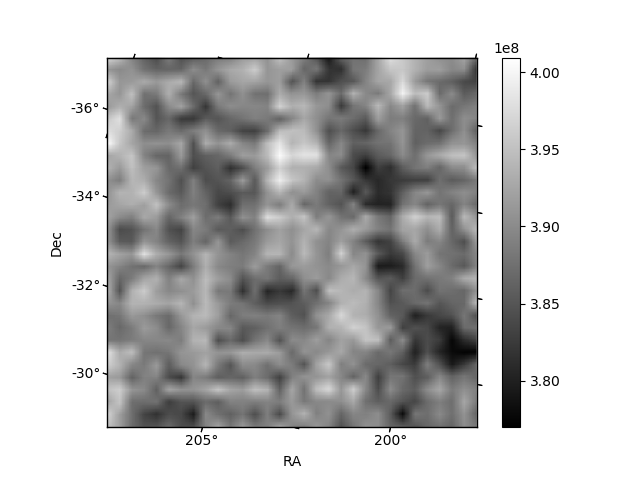
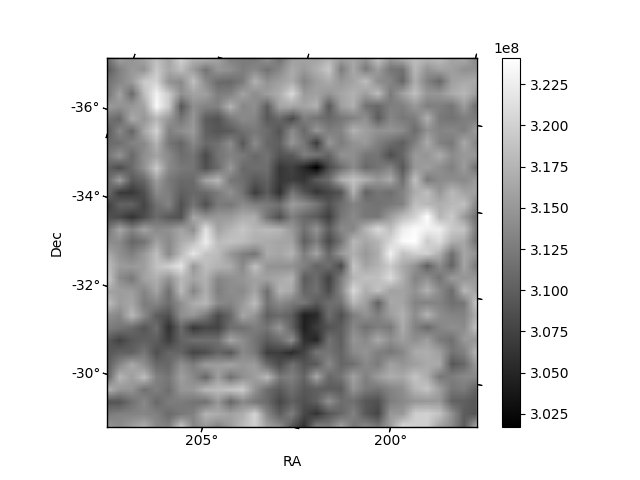
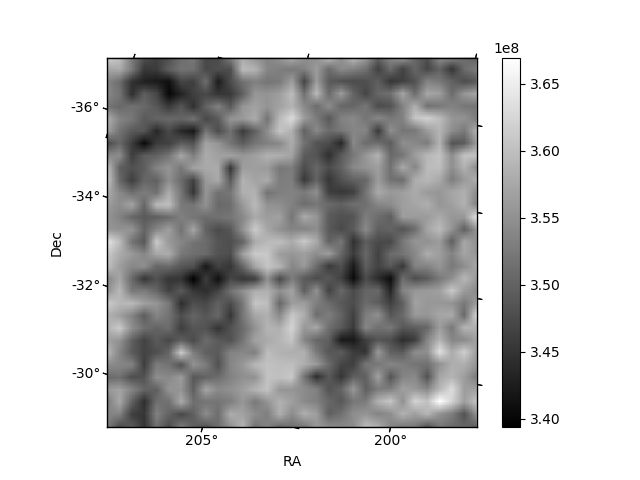
Histogram calculated using DETX and DETY for each event in the final _common_clean file
| Quadrant A | 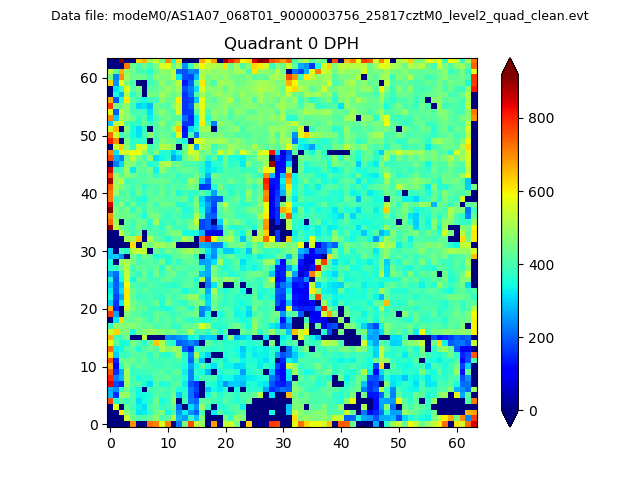 |
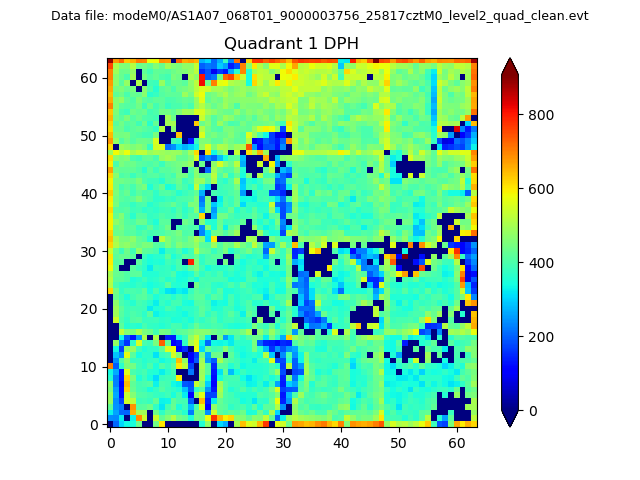 |
Quadrant B |
|---|---|---|---|
| Quadrant D | 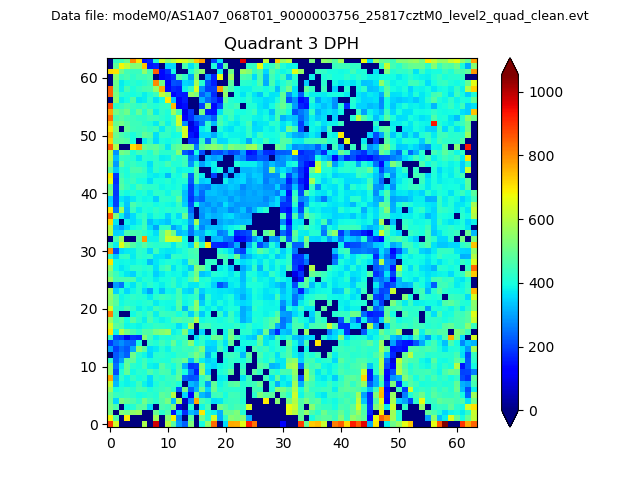 |
 |
Quadrant C |
| Plot type | Count rate plots | Images |
|---|---|---|
| Comparison with Poisson distribution Blue bars denote a histogram of data divided into 1 sec bins. Red curve is a Poisson curve with rate = median count rate of data. |
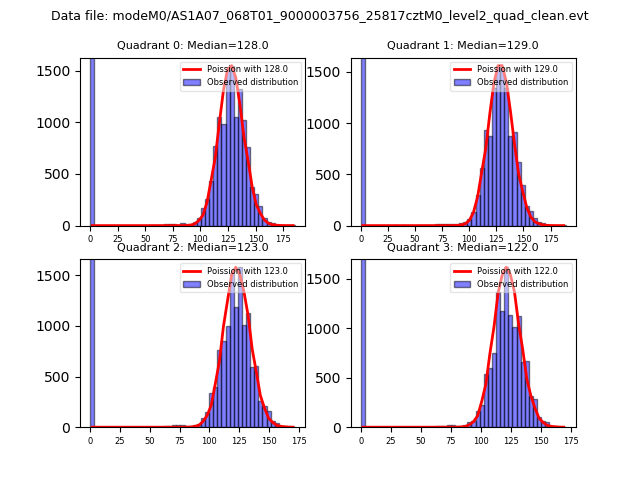 |
 |
| Quadrant-wise count rates Data is divided into 100 sec bins |
 |
|
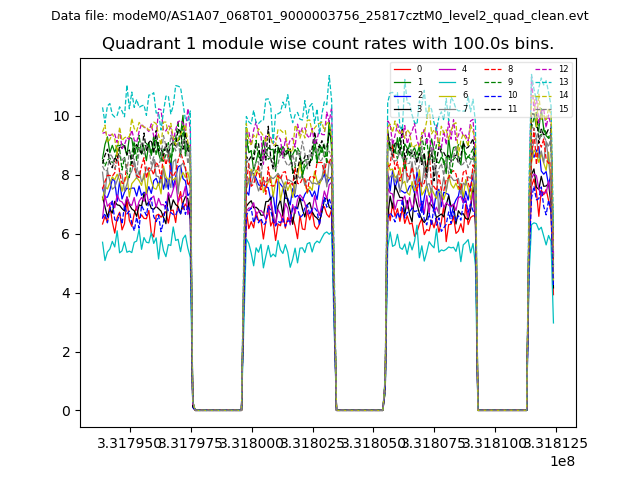
| Module-wise count rates for Quadrant A Data is divided into 100 sec bins |
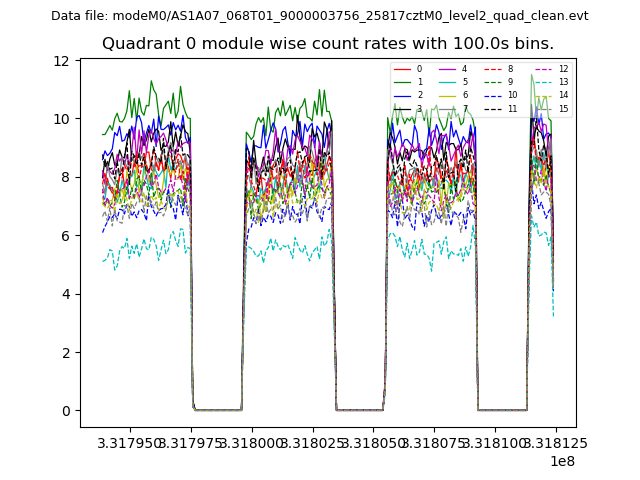 |
 |
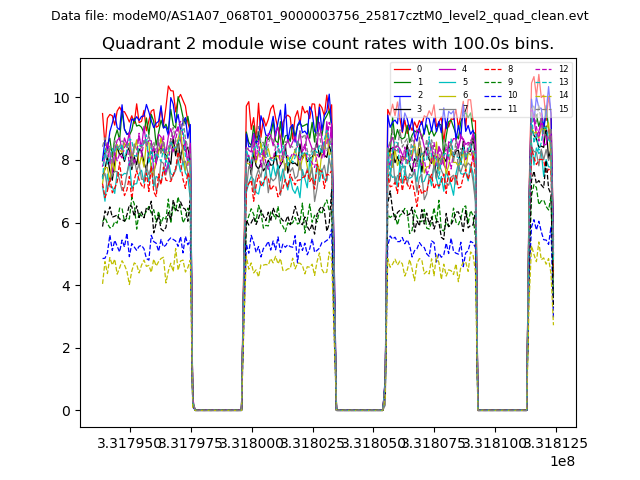
| Module-wise count rates for Quadrant B Data is divided into 100 sec bins |
 |
 |
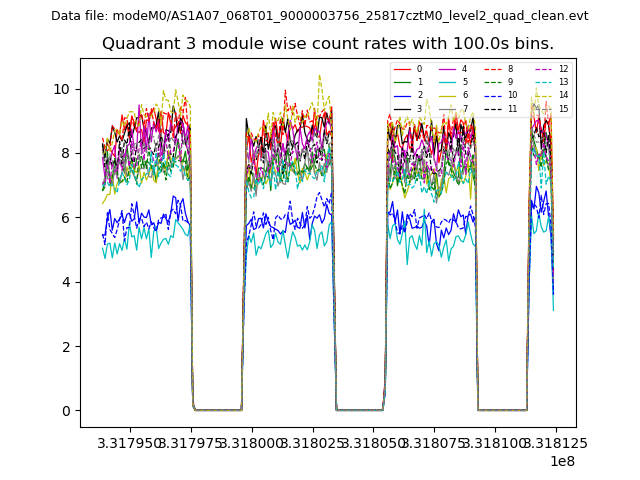
| Module-wise count rates for Quadrant C Data is divided into 100 sec bins |
 |
 |
| Module-wise count rates for Quadrant D Data is divided into 100 sec bins |
 |
 |
| Parameter | Plot |
|---|---|
| CZT HV Monitor | 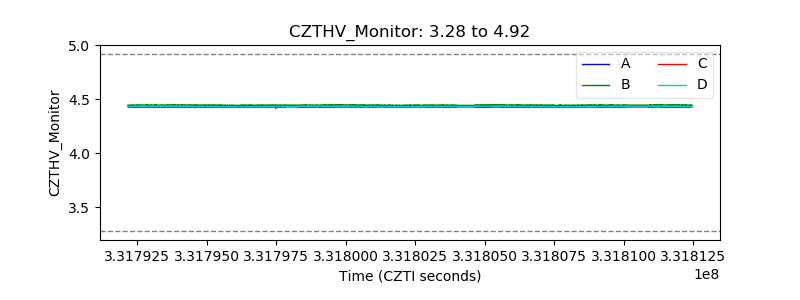 |
| D_VDD | 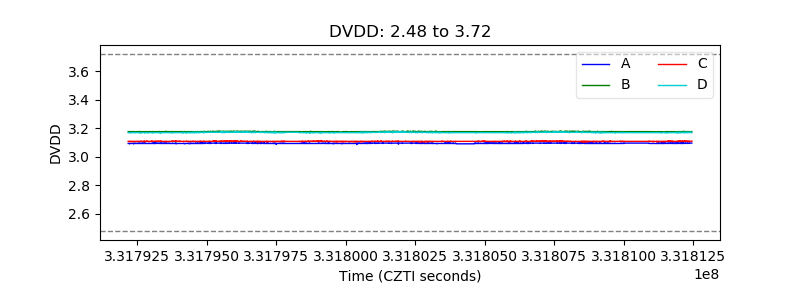 |
| Temperature 1 | 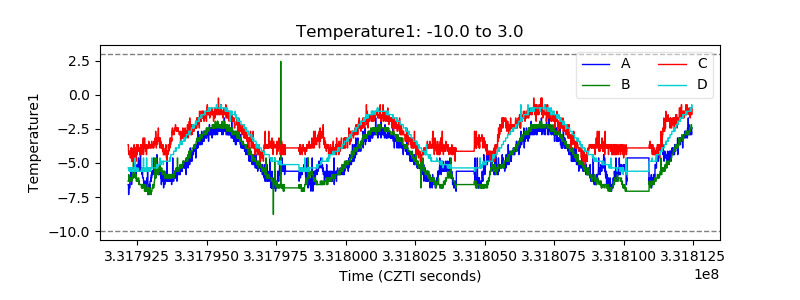 |
| Veto HV Monitor | 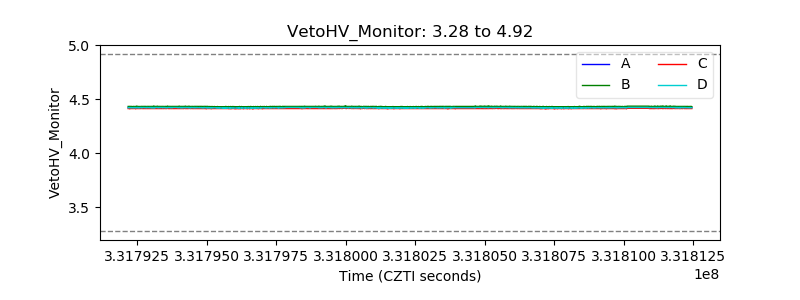 |
| Veto LLD | 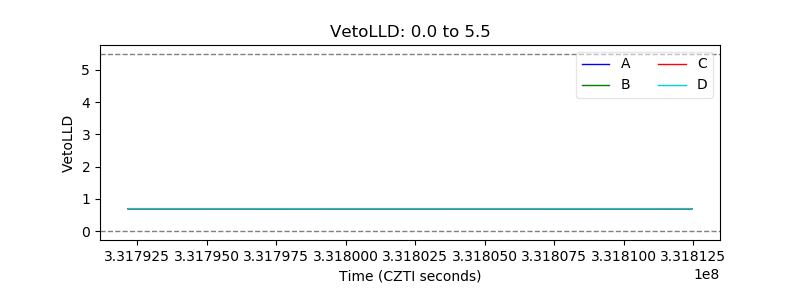 |
| Alpha Counter | 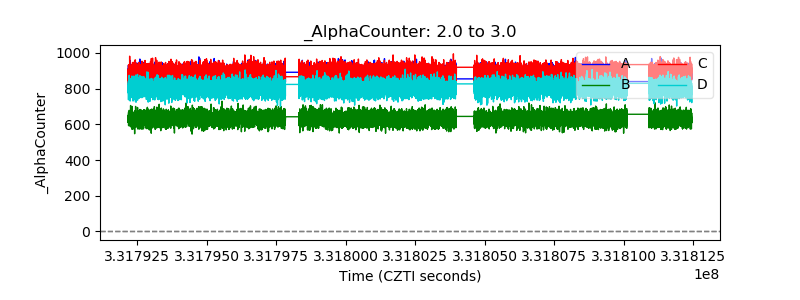 |
| _CPM_Rate | 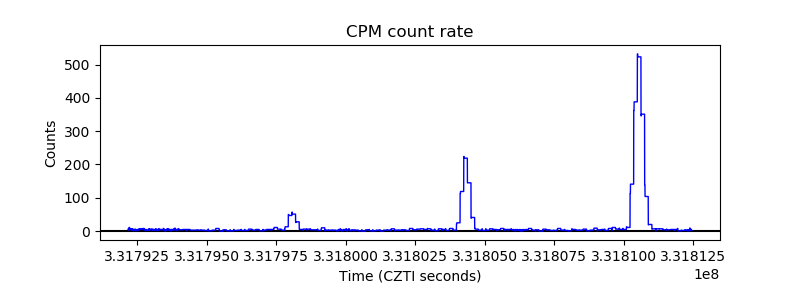 |
| CZT Counter | 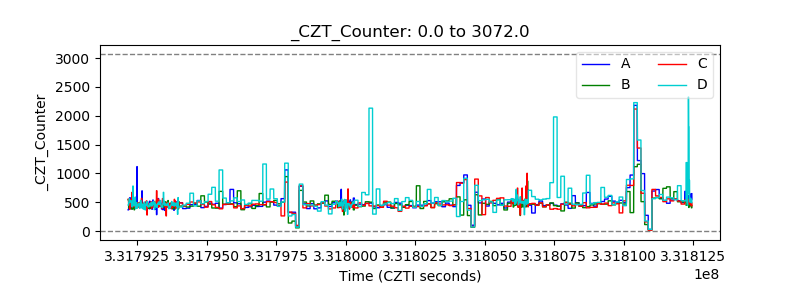 |
| +2.5 Volts monitor |  |
| +5 Volts monitor |  |
| _ROLL_ROT | 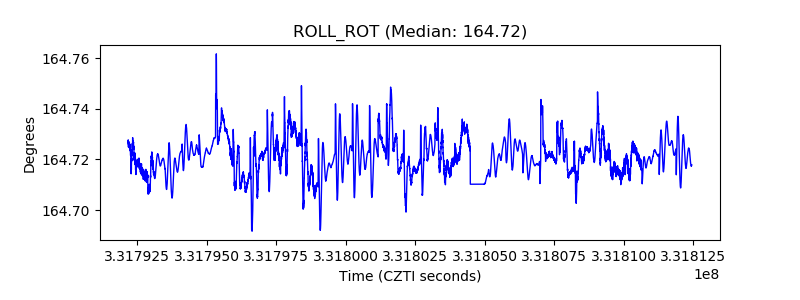 |
| _Roll_DEC | 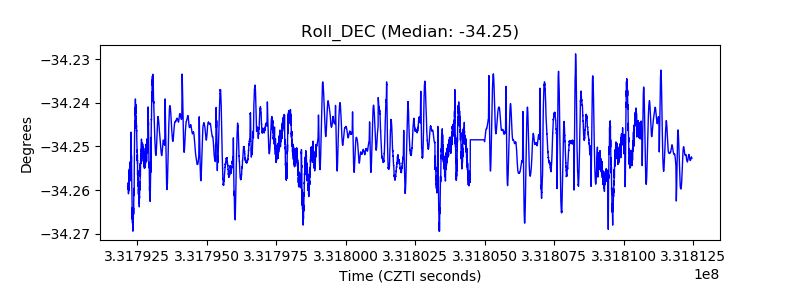 |
| _Roll_RA | 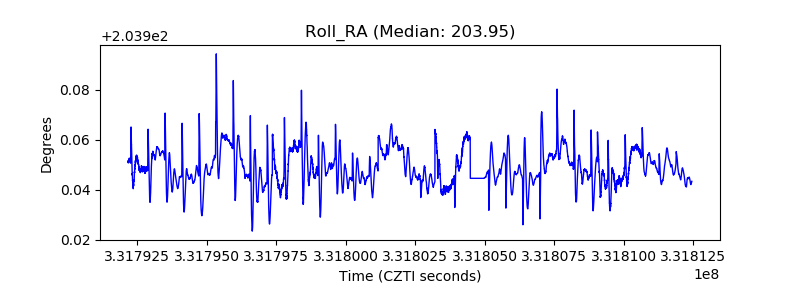 |
| Veto Counter | 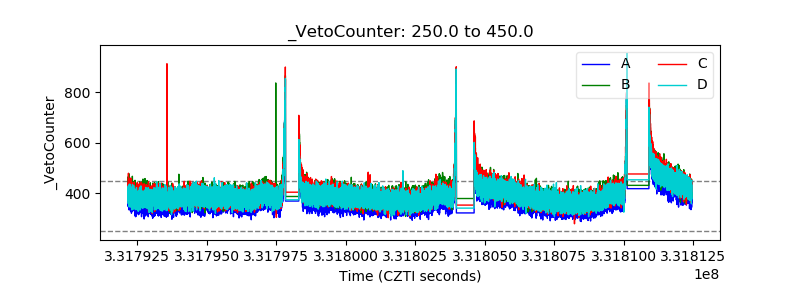 |