| Param | Original file | Final file |
|---|---|---|
| Filename | modeM0/AS1A07_068T01_9000003756_25818cztM0_level2.evt | modeM0/AS1A07_068T01_9000003756_25818cztM0_level2_quad_clean.evt |
| Size (bytes) | 544,055,040 | 108,555,840 |
| Size | 518.9 MB | 103.5 MB |
| Events in quadrant A | 3,767,717 | 719,582 |
| Events in quadrant B | 3,486,370 | 725,192 |
| Events in quadrant C | 4,152,750 | 677,256 |
| Events in quadrant D | 4,598,217 | 680,659 |
| Mode M0 | |||
|---|---|---|---|
| Quadrant | BADHDUFLAG | Total packets | Discarded packets |
| A | 0 | 15648 | 0 |
| B | 0 | 14644 | 0 |
| C | 0 | 16739 | 0 |
| D | 0 | 18285 | 0 |
| Mode M9 | |||
|---|---|---|---|
| Quadrant | BADHDUFLAG | Total packets | Discarded packets |
| A | 0 | 10 | 0 |
| B | 0 | 11 | 0 |
| C | 0 | 11 | 0 |
| D | 0 | 11 | 0 |
| Quadrant | Total seconds | Saturated seconds | Saturation percentage |
|---|---|---|---|
| A | 6966 | 83 | 1.191502% |
| B | 6966 | 63 | 0.904393% |
| C | 6966 | 167 | 2.397359% |
| D | 6966 | 107 | 1.536032% |
Noise dominated data is calculated using 1-second bins in cleaned event files. If a bin has >2000 counts, and if more than 50% of those come from <1% of pixels, then it is considered to be noise-dominated and hence unusable.
| Quadrant | # 1 sec bins | Bins with >0 counts | Bins with >2000 counts | High rate bins dominated by noise | Noise dominated (total time) | Noise dominated (detector-on time) | Marked lightcurve |
|---|---|---|---|---|---|---|---|
| A | 7935 | 6965 | 4 | 4 | 0.05% | 0.06% | 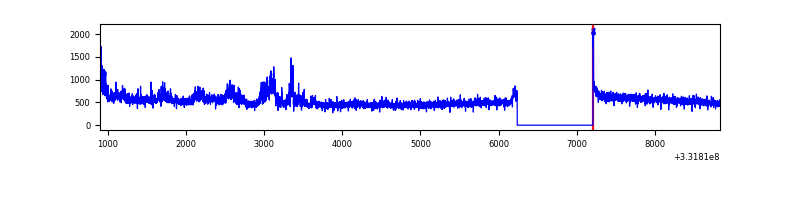 |
| B | 7936 | 6966 | 0 | 0 | 0.00% | 0.00% | 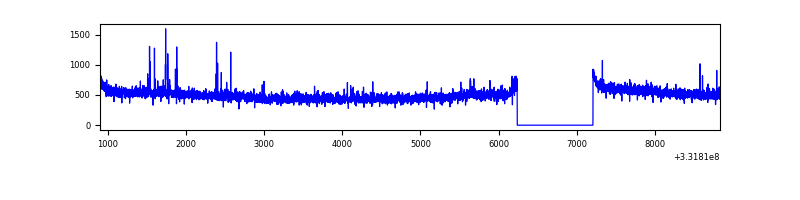 |
| C | 7936 | 6966 | 26 | 26 | 0.33% | 0.37% | 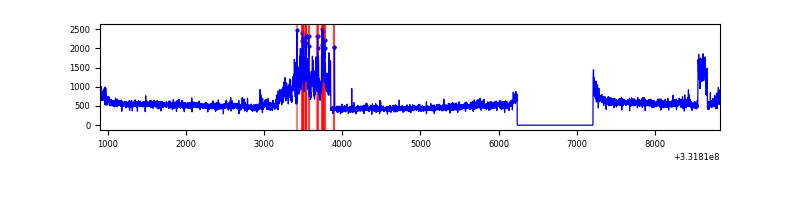 |
| D | 7936 | 6966 | 44 | 44 | 0.55% | 0.63% | 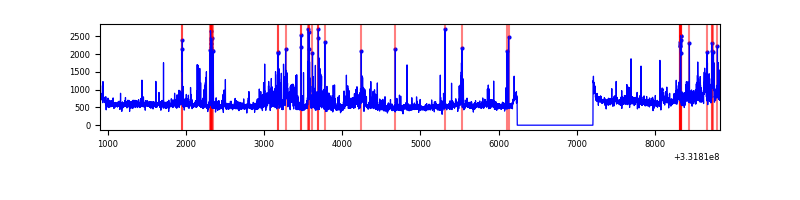 |
Top three noisy pixels from each quadrant. If the there are fewer than three noisy pixels in the level2.evt file, extra rows are filled as -1
| Pixel properties | Quadrant properties | ||||||
|---|---|---|---|---|---|---|---|
| Quadrant | DetID | PixID | Counts | Sigma | Mean | Median | Sigma |
| A | 0 | 13 | 336490 | 1878.1 | 890 | 872 | 178.7 |
| A | 13 | 254 | 9697 | 49.38 | 890 | 872 | 178.7 |
| A | 3 | 137 | 8272 | 41.41 | 890 | 872 | 178.7 |
| B | 0 | 219 | 21776 | 125.22 | 873 | 852 | 167.1 |
| B | 4 | 171 | 20814 | 119.46 | 873 | 852 | 167.1 |
| B | 12 | 111 | 20685 | 118.69 | 873 | 852 | 167.1 |
| C | 3 | 233 | 733730 | 3727.65 | 839 | 846 | 196.6 |
| C | 14 | 238 | 134732 | 680.98 | 839 | 846 | 196.6 |
| C | 0 | 207 | 10935 | 51.32 | 839 | 846 | 196.6 |
| D | 7 | 80 | 674689 | 3331.38 | 857 | 837 | 202.3 |
| D | 8 | 195 | 478666 | 2362.29 | 857 | 837 | 202.3 |
| D | 1 | 52 | 127686 | 627.11 | 857 | 837 | 202.3 |
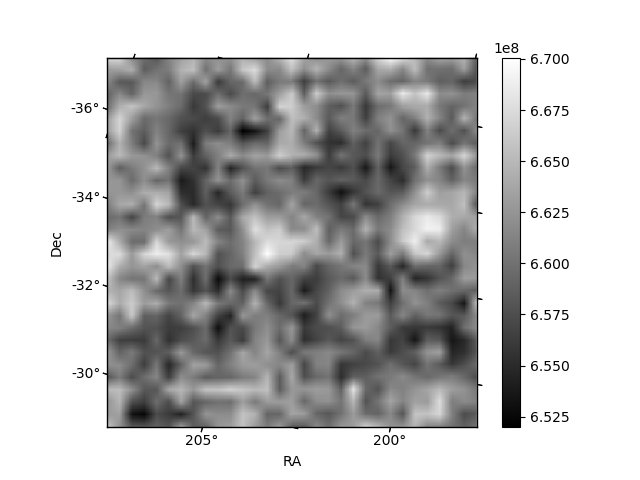
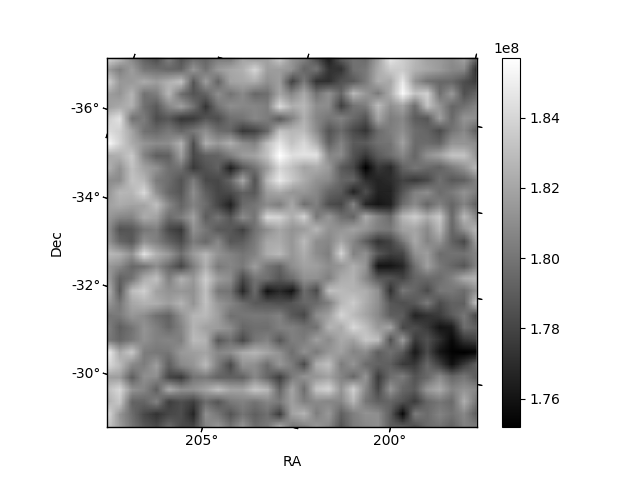
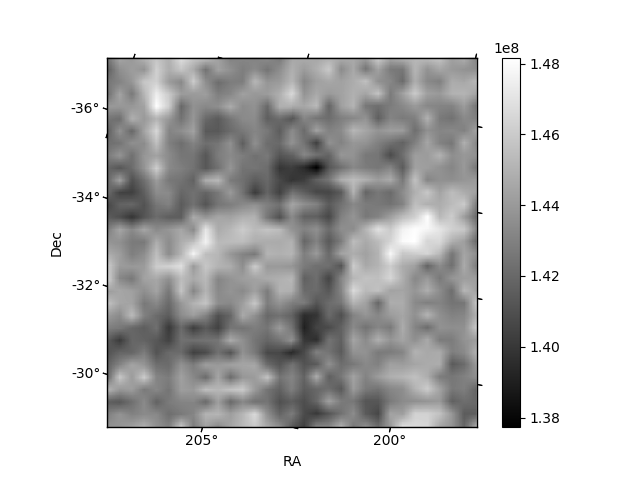
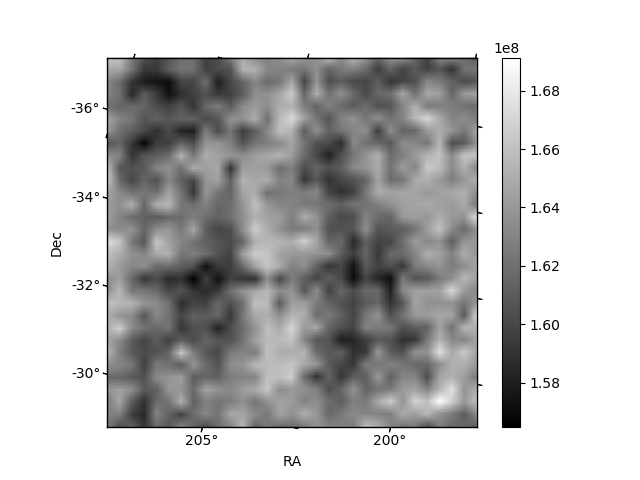
Histogram calculated using DETX and DETY for each event in the final _common_clean file
| Quadrant A | 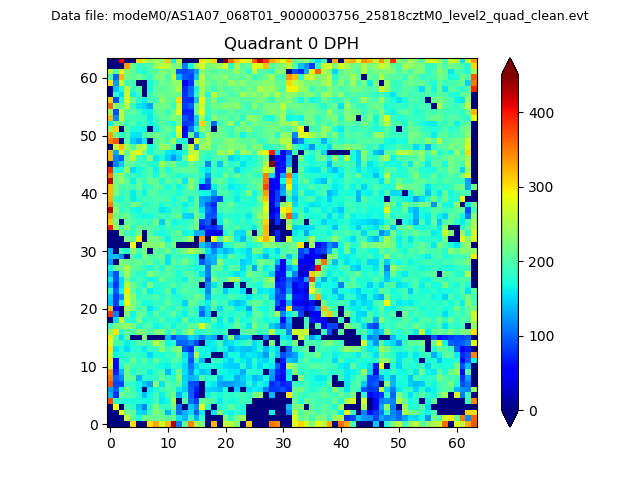 |
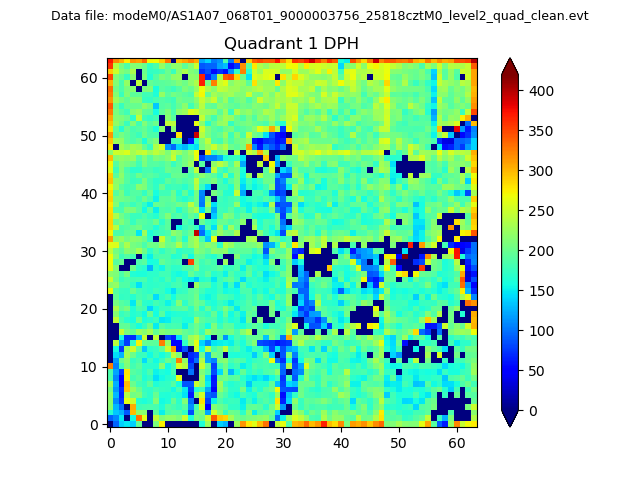 |
Quadrant B |
|---|---|---|---|
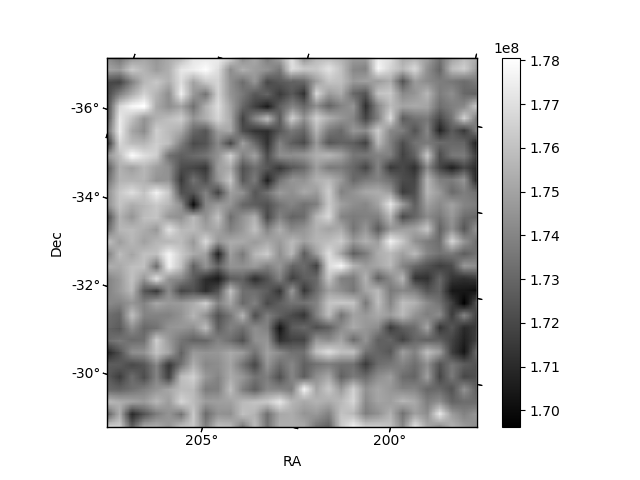
| Quadrant D |  |
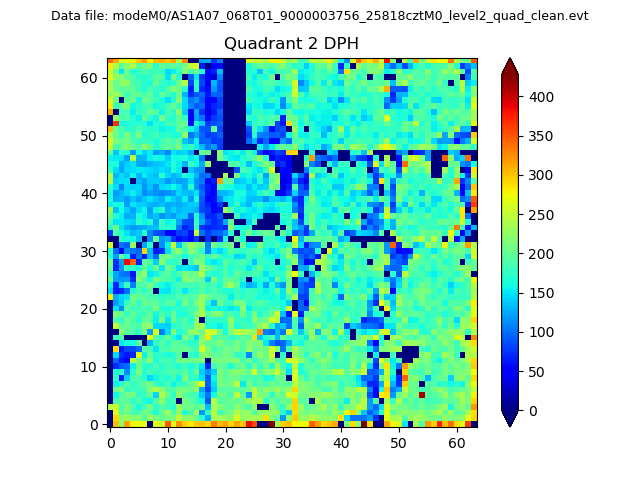 |
Quadrant C |
| Plot type | Count rate plots | Images |
|---|---|---|
| Comparison with Poisson distribution Blue bars denote a histogram of data divided into 1 sec bins. Red curve is a Poisson curve with rate = median count rate of data. |
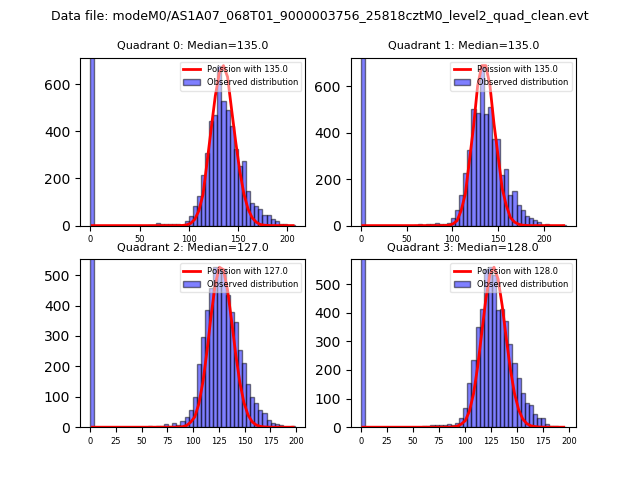 |
 |
| Quadrant-wise count rates Data is divided into 100 sec bins |
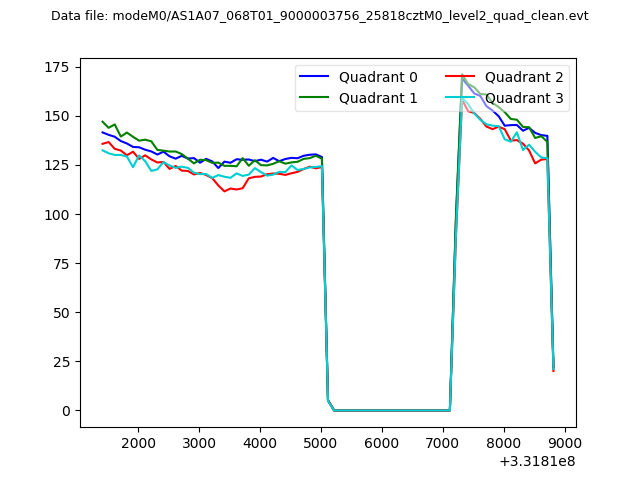 |
|
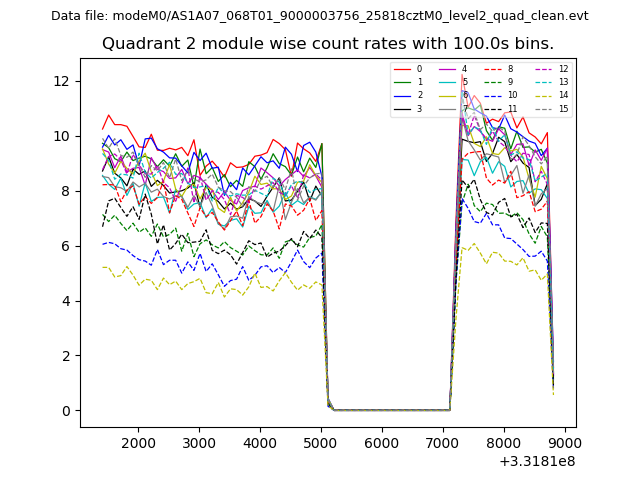
| Module-wise count rates for Quadrant A Data is divided into 100 sec bins |
 |
 |
| Module-wise count rates for Quadrant B Data is divided into 100 sec bins |
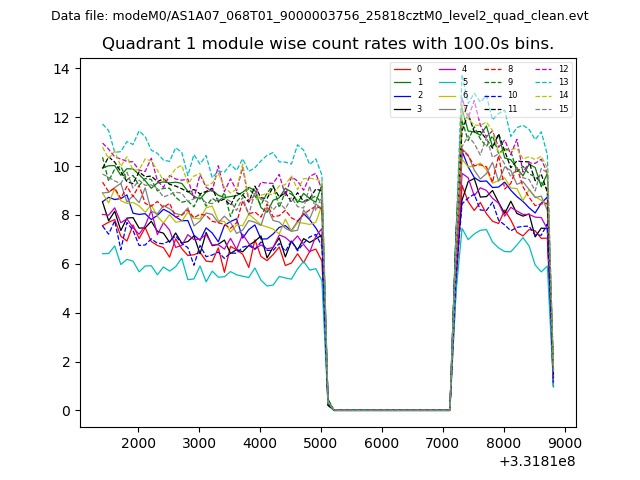 |
 |
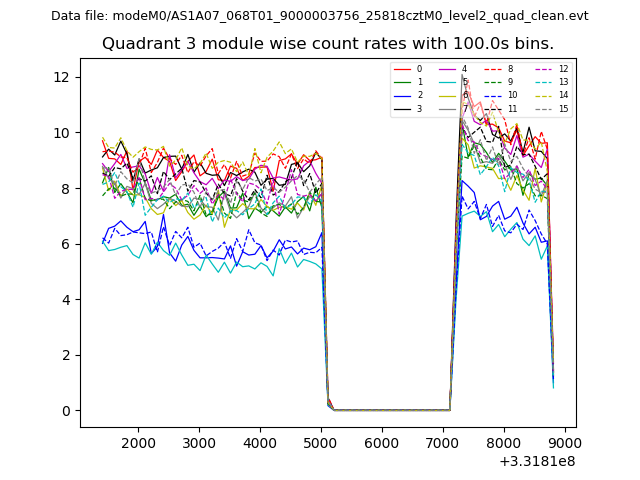
| Module-wise count rates for Quadrant C Data is divided into 100 sec bins |
 |
 |
| Module-wise count rates for Quadrant D Data is divided into 100 sec bins |
 |
 |
| Parameter | Plot |
|---|---|
| CZT HV Monitor | 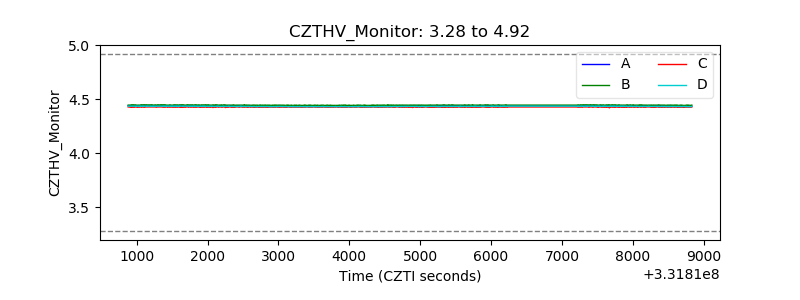 |
| D_VDD | 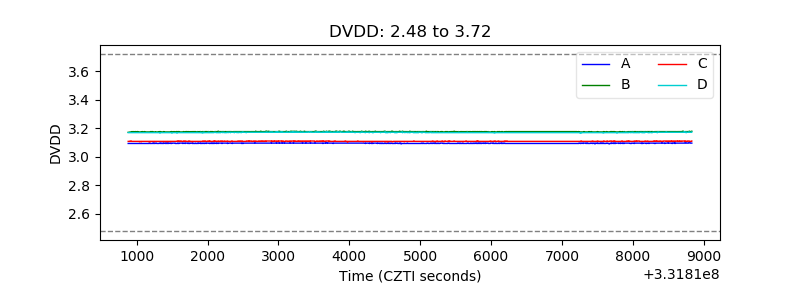 |
| Temperature 1 | 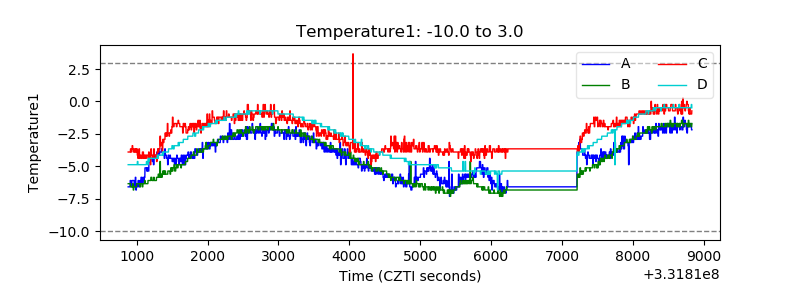 |
| Veto HV Monitor | 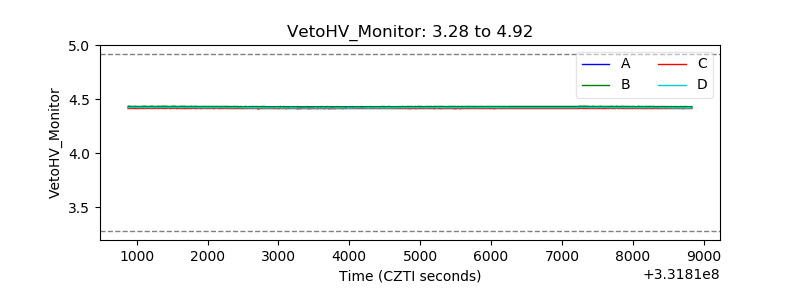 |
| Veto LLD |  |
| Alpha Counter | 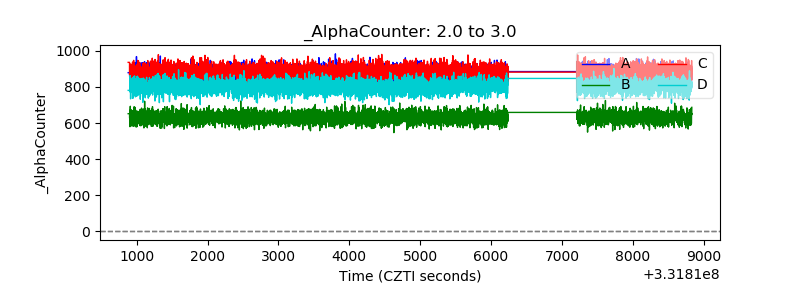 |
| _CPM_Rate | 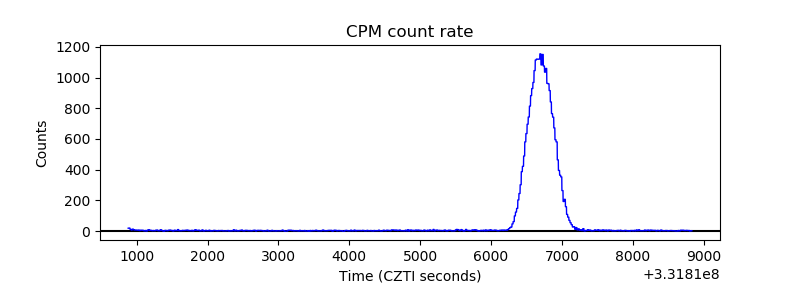 |
| CZT Counter | 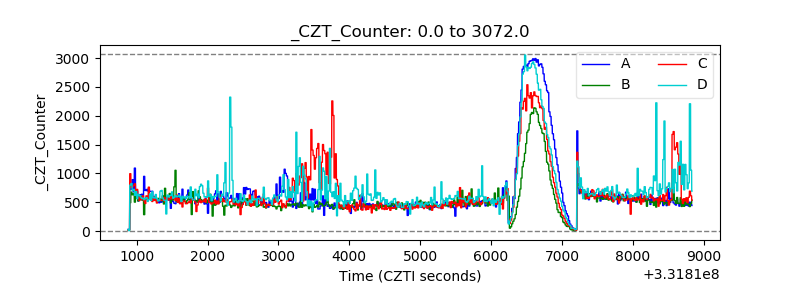 |
| +2.5 Volts monitor | 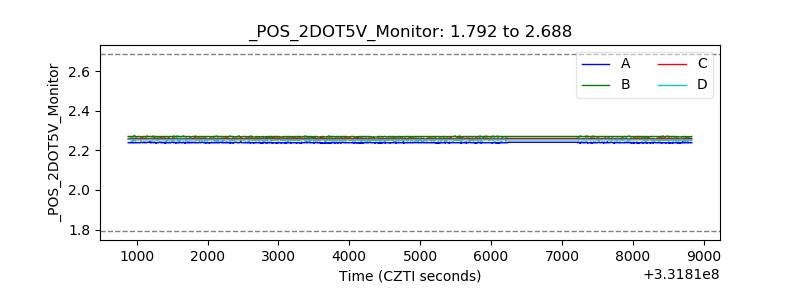 |
| +5 Volts monitor |  |
| _ROLL_ROT |  |
| _Roll_DEC | 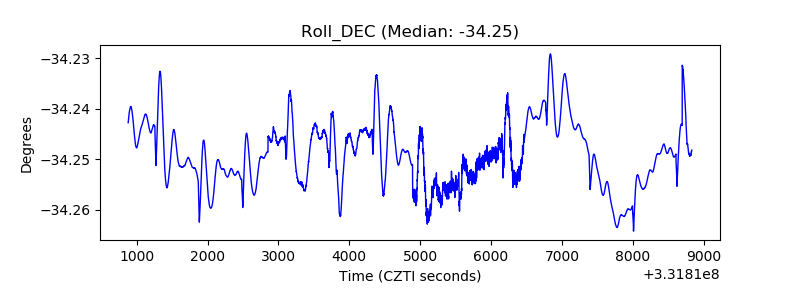 |
| _Roll_RA | 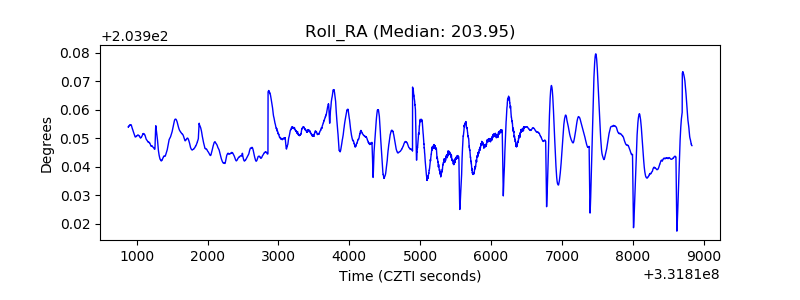 |
| Veto Counter | 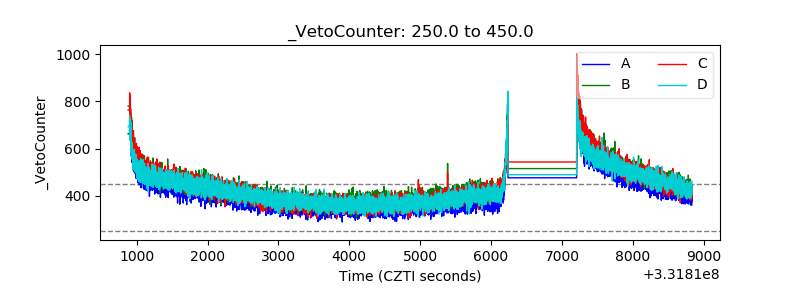 |