| Param | Original file | Final file |
|---|---|---|
| Filename | modeM0/AS1A07_068T01_9000003756_25820cztM0_level2.evt | modeM0/AS1A07_068T01_9000003756_25820cztM0_level2_quad_clean.evt |
| Size (bytes) | 613,290,240 | 103,282,560 |
| Size | 584.9 MB | 98.5 MB |
| Events in quadrant A | 3,297,999 | 715,681 |
| Events in quadrant B | 3,203,168 | 712,521 |
| Events in quadrant C | 3,390,493 | 665,628 |
| Events in quadrant D | 8,255,668 | 594,723 |
| Mode M0 | |||
|---|---|---|---|
| Quadrant | BADHDUFLAG | Total packets | Discarded packets |
| A | 0 | 13724 | 0 |
| B | 0 | 13476 | 0 |
| C | 0 | 14119 | 0 |
| D | 0 | 28930 | 0 |
| Mode M9 | |||
|---|---|---|---|
| Quadrant | BADHDUFLAG | Total packets | Discarded packets |
| A | 0 | 11 | 0 |
| B | 0 | 11 | 0 |
| C | 0 | 11 | 0 |
| D | 0 | 11 | 0 |
| Quadrant | Total seconds | Saturated seconds | Saturation percentage |
|---|---|---|---|
| A | 6292 | 61 | 0.969485% |
| B | 6291 | 61 | 0.969639% |
| C | 6292 | 112 | 1.780038% |
| D | 6292 | 1826 | 29.020979% |
Noise dominated data is calculated using 1-second bins in cleaned event files. If a bin has >2000 counts, and if more than 50% of those come from <1% of pixels, then it is considered to be noise-dominated and hence unusable.
| Quadrant | # 1 sec bins | Bins with >0 counts | Bins with >2000 counts | High rate bins dominated by noise | Noise dominated (total time) | Noise dominated (detector-on time) | Marked lightcurve |
|---|---|---|---|---|---|---|---|
| A | 7387 | 6292 | 0 | 0 | 0.00% | 0.00% | 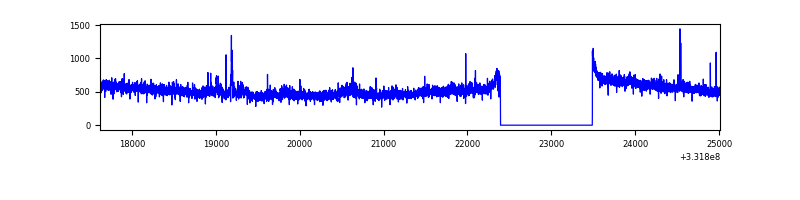 |
| B | 7386 | 6291 | 0 | 0 | 0.00% | 0.00% | 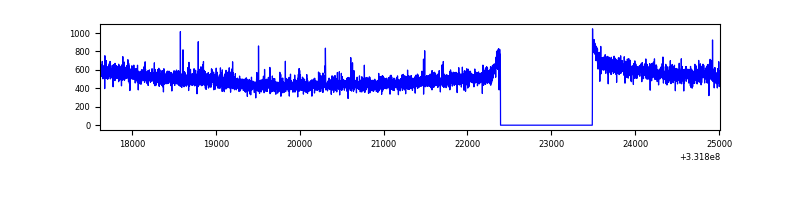 |
| C | 7387 | 6292 | 0 | 0 | 0.00% | 0.00% | 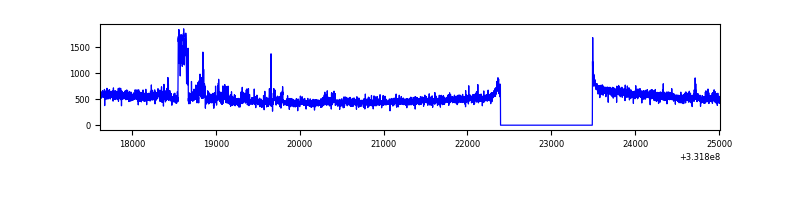 |
| D | 7387 | 6292 | 1771 | 1771 | 23.97% | 28.15% | 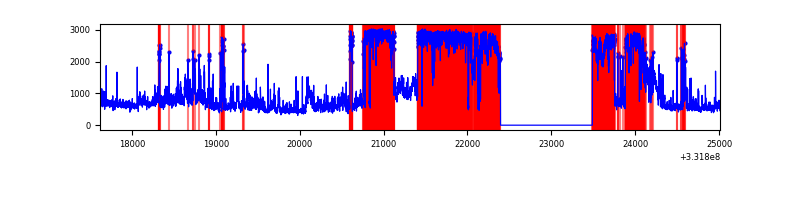 |
Top three noisy pixels from each quadrant. If the there are fewer than three noisy pixels in the level2.evt file, extra rows are filled as -1
| Pixel properties | Quadrant properties | ||||||
|---|---|---|---|---|---|---|---|
| Quadrant | DetID | PixID | Counts | Sigma | Mean | Median | Sigma |
| A | 0 | 13 | 128565 | 772.9 | 822 | 807 | 165.3 |
| A | 13 | 254 | 7948 | 43.2 | 822 | 807 | 165.3 |
| A | 0 | 226 | 7410 | 39.95 | 822 | 807 | 165.3 |
| B | 0 | 219 | 27037 | 170.34 | 801 | 783 | 154.1 |
| B | 15 | 33 | 18484 | 114.85 | 801 | 783 | 154.1 |
| B | 12 | 111 | 18351 | 113.98 | 801 | 783 | 154.1 |
| C | 3 | 233 | 277373 | 1546.92 | 765 | 770 | 178.8 |
| C | 14 | 238 | 123163 | 684.49 | 765 | 770 | 178.8 |
| C | 4 | 175 | 9501 | 48.83 | 765 | 770 | 178.8 |
| D | 7 | 223 | 4656738 | 30712.67 | 636 | 622 | 151.6 |
| D | 7 | 80 | 709921 | 4678.68 | 636 | 622 | 151.6 |
| D | 1 | 52 | 210069 | 1381.55 | 636 | 622 | 151.6 |
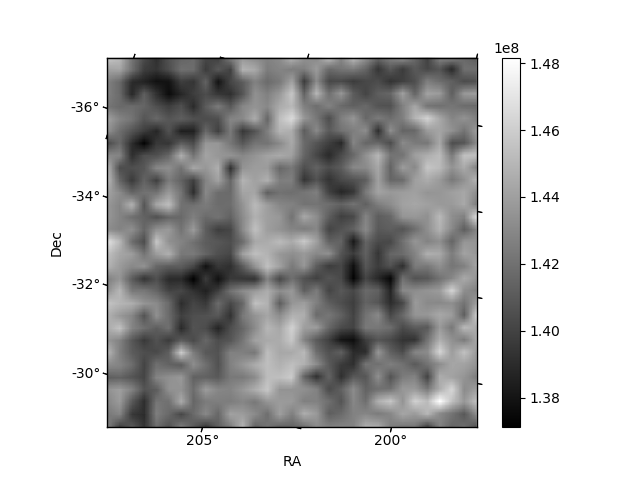
Histogram calculated using DETX and DETY for each event in the final _common_clean file
| Quadrant A |  |
 |
Quadrant B |
|---|---|---|---|
| Quadrant D |  |
 |
Quadrant C |
| Plot type | Count rate plots | Images |
|---|---|---|
| Comparison with Poisson distribution Blue bars denote a histogram of data divided into 1 sec bins. Red curve is a Poisson curve with rate = median count rate of data. |
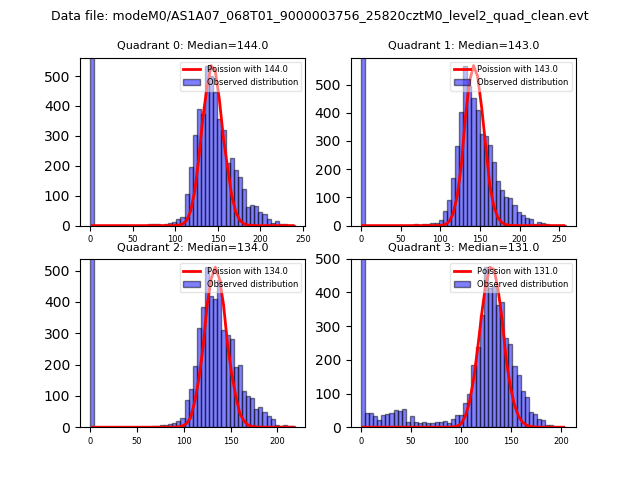 |
 |
| Quadrant-wise count rates Data is divided into 100 sec bins |
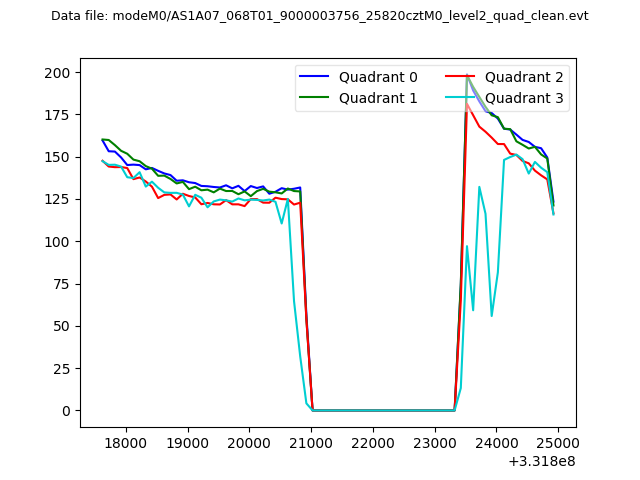 |
|
| Module-wise count rates for Quadrant A Data is divided into 100 sec bins |
 |
 |
| Module-wise count rates for Quadrant B Data is divided into 100 sec bins |
 |
 |
| Module-wise count rates for Quadrant C Data is divided into 100 sec bins |
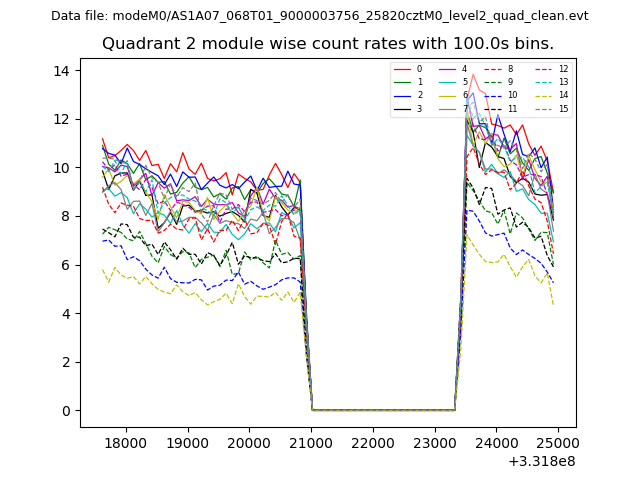 |
 |
| Module-wise count rates for Quadrant D Data is divided into 100 sec bins |
 |
 |
| Parameter | Plot |
|---|---|
| CZT HV Monitor |  |
| D_VDD |  |
| Temperature 1 |  |
| Veto HV Monitor |  |
| Veto LLD |  |
| Alpha Counter | 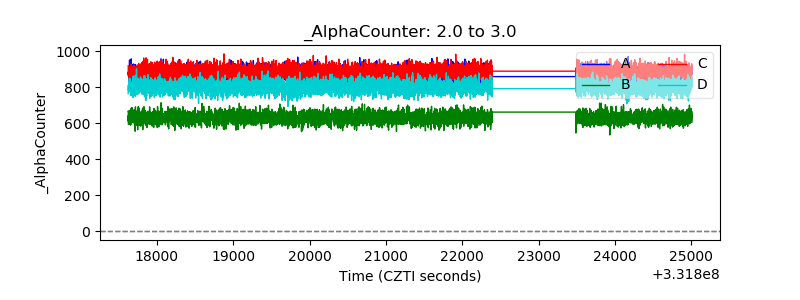 |
| _CPM_Rate | 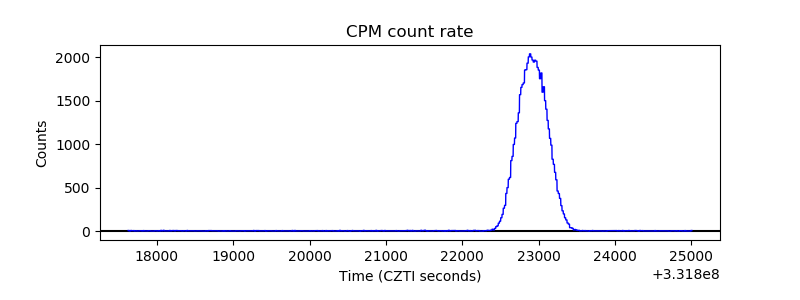 |
| CZT Counter |  |
| +2.5 Volts monitor |  |
| +5 Volts monitor |  |
| _ROLL_ROT |  |
| _Roll_DEC |  |
| _Roll_RA |  |
| Veto Counter |  |