| Param | Original file | Final file |
|---|---|---|
| Filename | modeM0/AS1A07_068T01_9000003756_25821cztM0_level2.evt | modeM0/AS1A07_068T01_9000003756_25821cztM0_level2_quad_clean.evt |
| Size (bytes) | 608,731,200 | 95,944,320 |
| Size | 580.5 MB | 91.5 MB |
| Events in quadrant A | 3,271,251 | 670,153 |
| Events in quadrant B | 3,331,102 | 663,033 |
| Events in quadrant C | 3,082,583 | 615,109 |
| Events in quadrant D | 8,344,674 | 538,733 |
| Mode M0 | |||
|---|---|---|---|
| Quadrant | BADHDUFLAG | Total packets | Discarded packets |
| A | 0 | 13561 | 0 |
| B | 0 | 13777 | 0 |
| C | 0 | 12953 | 0 |
| D | 0 | 28622 | 0 |
| Mode M9 | |||
|---|---|---|---|
| Quadrant | BADHDUFLAG | Total packets | Discarded packets |
| A | 0 | 12 | 0 |
| B | 0 | 12 | 0 |
| C | 0 | 12 | 0 |
| D | 0 | 12 | 0 |
| Quadrant | Total seconds | Saturated seconds | Saturation percentage |
|---|---|---|---|
| A | 5988 | 63 | 1.052104% |
| B | 5988 | 73 | 1.219105% |
| C | 5988 | 87 | 1.452906% |
| D | 5989 | 2162 | 36.099516% |
Noise dominated data is calculated using 1-second bins in cleaned event files. If a bin has >2000 counts, and if more than 50% of those come from <1% of pixels, then it is considered to be noise-dominated and hence unusable.
| Quadrant | # 1 sec bins | Bins with >0 counts | Bins with >2000 counts | High rate bins dominated by noise | Noise dominated (total time) | Noise dominated (detector-on time) | Marked lightcurve |
|---|---|---|---|---|---|---|---|
| A | 7197 | 5987 | 0 | 0 | 0.00% | 0.00% | 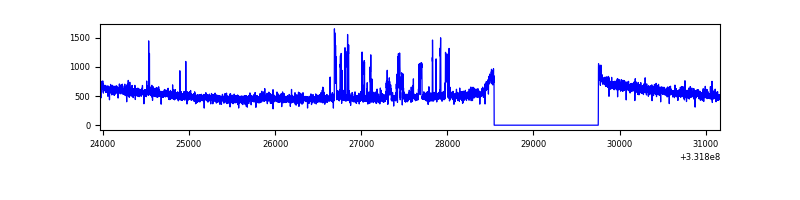 |
| B | 7197 | 5987 | 6 | 6 | 0.08% | 0.10% | 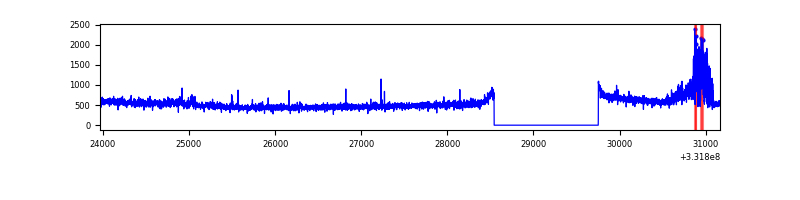 |
| C | 7197 | 5987 | 0 | 0 | 0.00% | 0.00% | 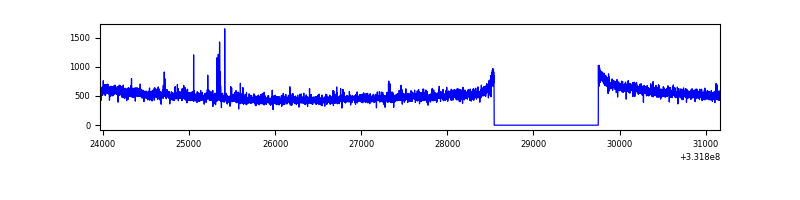 |
| D | 7198 | 5988 | 2112 | 2112 | 29.34% | 35.27% | 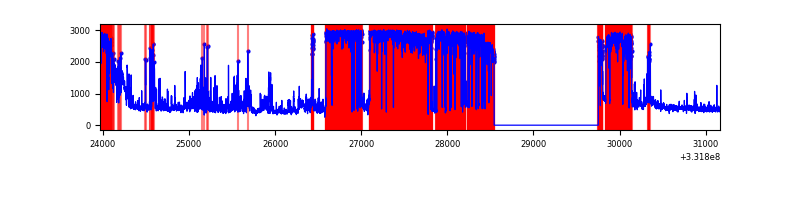 |
Top three noisy pixels from each quadrant. If the there are fewer than three noisy pixels in the level2.evt file, extra rows are filled as -1
| Pixel properties | Quadrant properties | ||||||
|---|---|---|---|---|---|---|---|
| Quadrant | DetID | PixID | Counts | Sigma | Mean | Median | Sigma |
| A | 0 | 13 | 188410 | 1176.98 | 799 | 788 | 159.4 |
| A | 13 | 254 | 7994 | 45.2 | 799 | 788 | 159.4 |
| A | 0 | 226 | 7080 | 39.47 | 799 | 788 | 159.4 |
| B | 15 | 33 | 229301 | 1544.51 | 779 | 761 | 148.0 |
| B | 0 | 219 | 32121 | 211.94 | 779 | 761 | 148.0 |
| B | 12 | 111 | 17213 | 111.19 | 779 | 761 | 148.0 |
| C | 14 | 238 | 119499 | 699.46 | 738 | 745 | 169.8 |
| C | 3 | 233 | 53144 | 308.63 | 738 | 745 | 169.8 |
| C | 4 | 175 | 17623 | 99.41 | 738 | 745 | 169.8 |
| D | 7 | 223 | 5490717 | 40626.76 | 565 | 551 | 135.1 |
| D | 1 | 52 | 429468 | 3173.95 | 565 | 551 | 135.1 |
| D | 12 | 233 | 108037 | 795.38 | 565 | 551 | 135.1 |
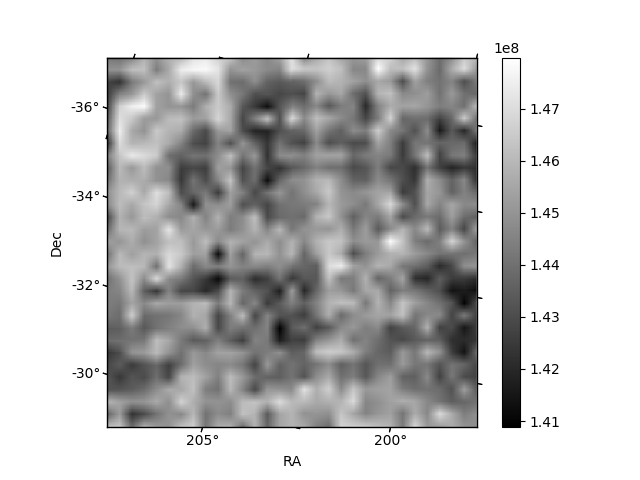
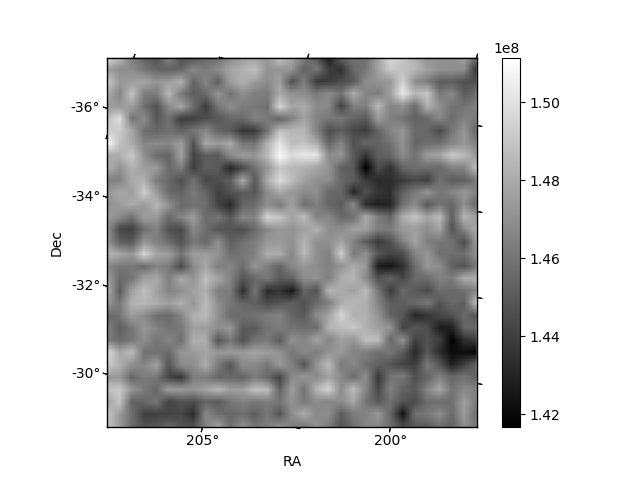
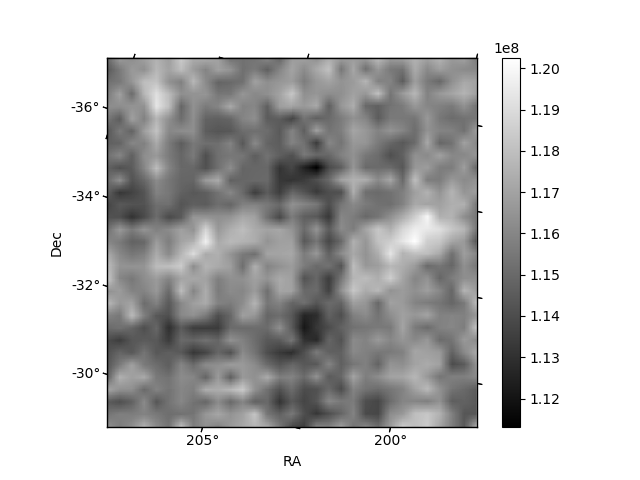
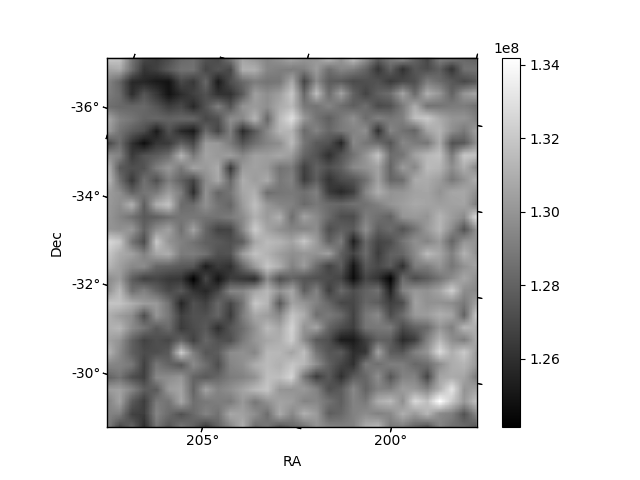
Histogram calculated using DETX and DETY for each event in the final _common_clean file
| Quadrant A | 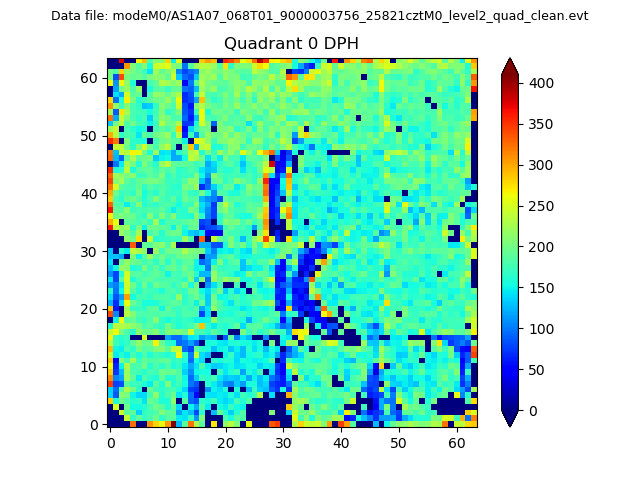 |
 |
Quadrant B |
|---|---|---|---|
| Quadrant D | 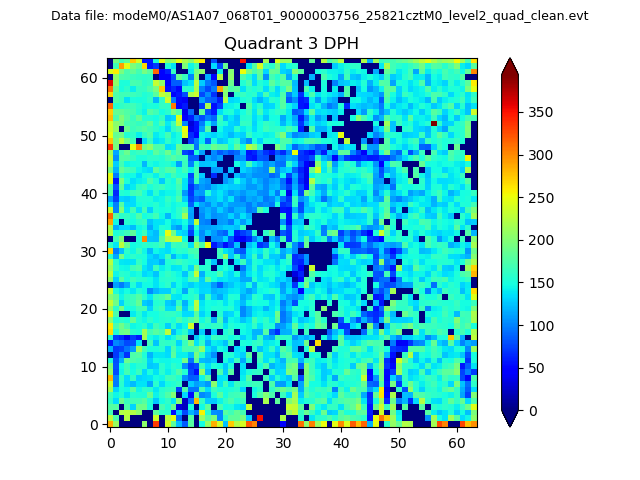 |
 |
Quadrant C |
| Plot type | Count rate plots | Images |
|---|---|---|
| Comparison with Poisson distribution Blue bars denote a histogram of data divided into 1 sec bins. Red curve is a Poisson curve with rate = median count rate of data. |
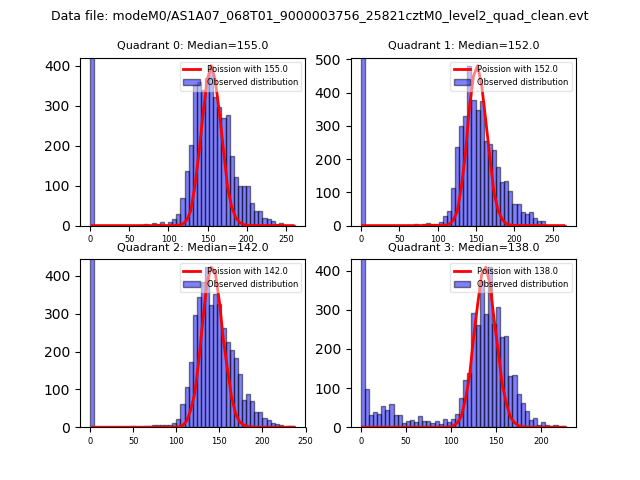 |
 |
| Quadrant-wise count rates Data is divided into 100 sec bins |
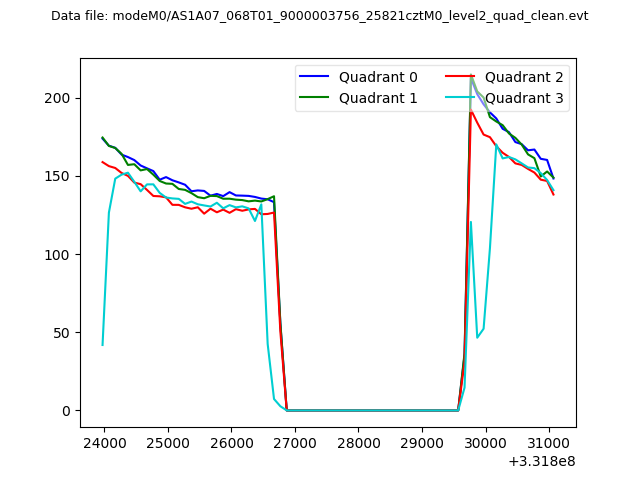 |
|
| Module-wise count rates for Quadrant A Data is divided into 100 sec bins |
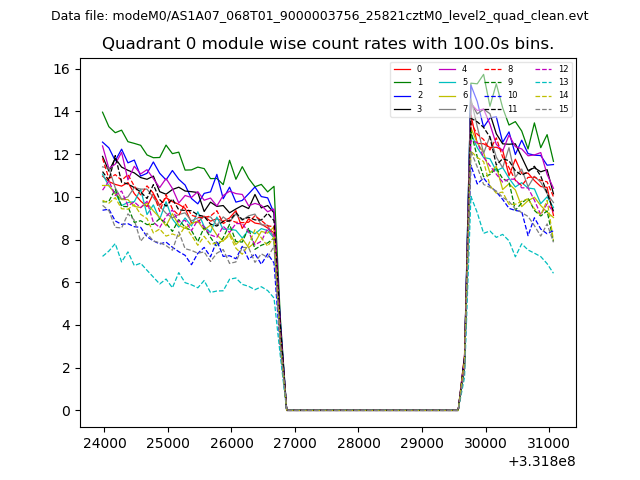 |
 |
| Module-wise count rates for Quadrant B Data is divided into 100 sec bins |
 |
 |
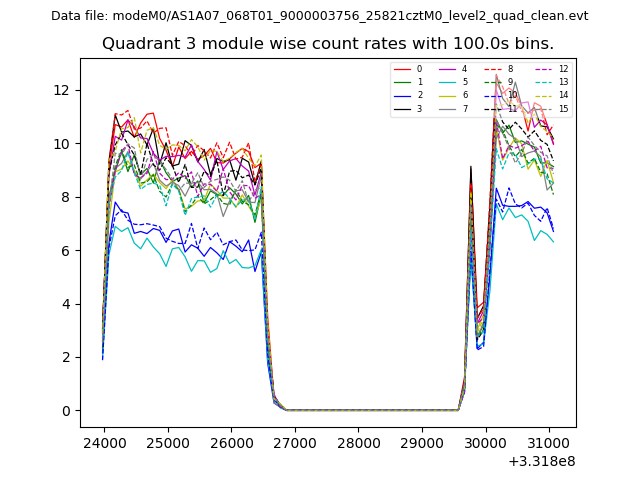
| Module-wise count rates for Quadrant C Data is divided into 100 sec bins |
 |
 |
| Module-wise count rates for Quadrant D Data is divided into 100 sec bins |
 |
 |
| Parameter | Plot |
|---|---|
| CZT HV Monitor | 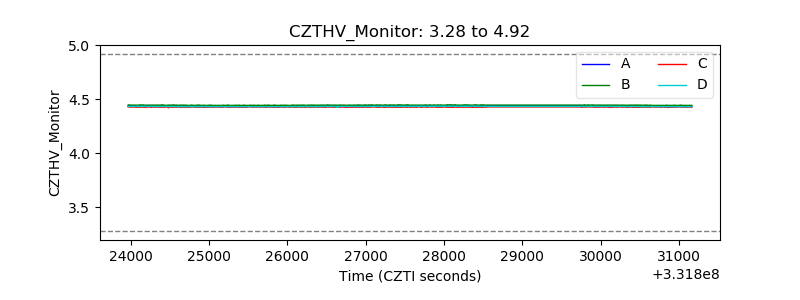 |
| D_VDD | 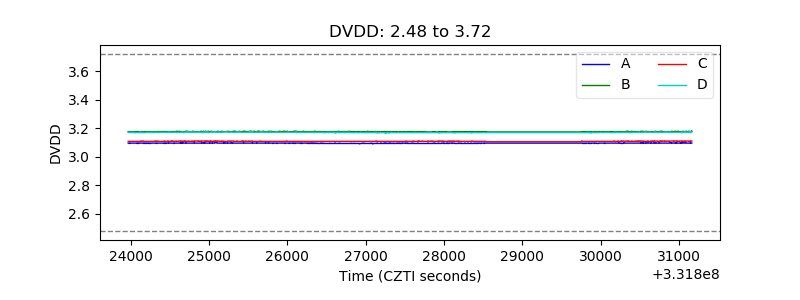 |
| Temperature 1 | 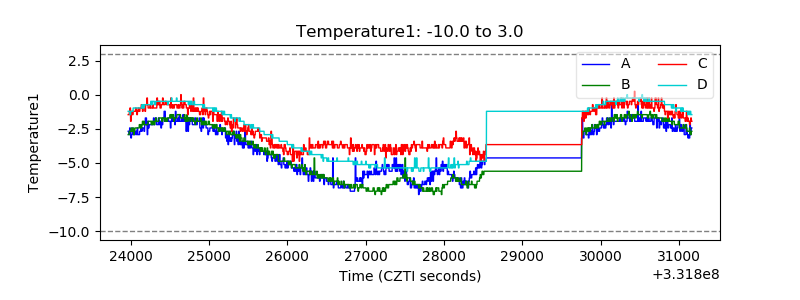 |
| Veto HV Monitor | 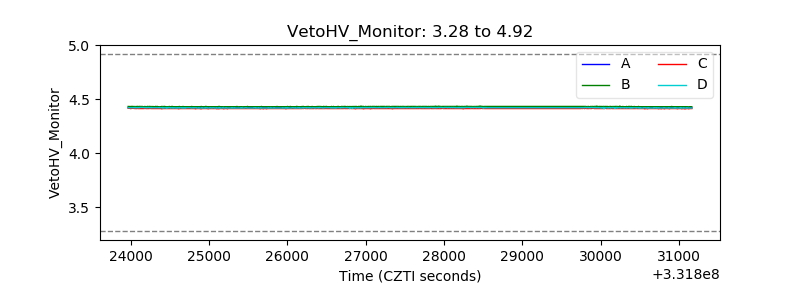 |
| Veto LLD | 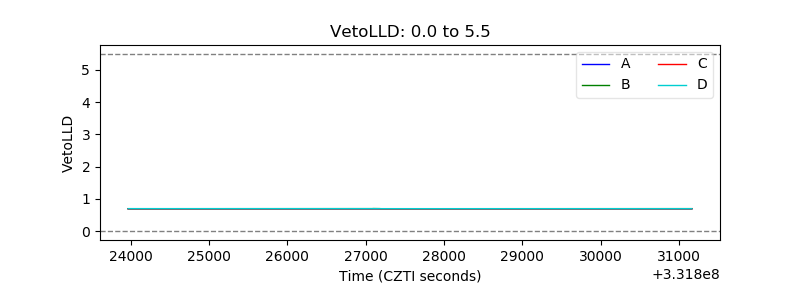 |
| Alpha Counter | 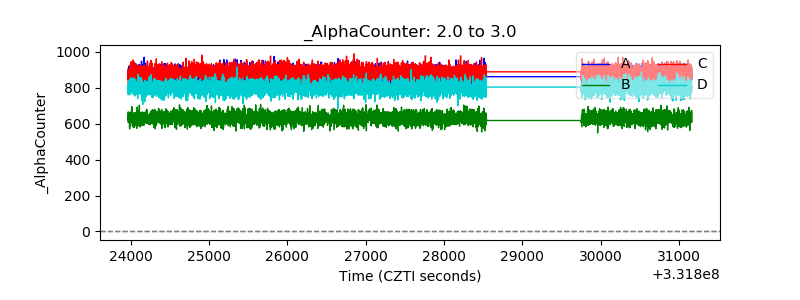 |
| _CPM_Rate | 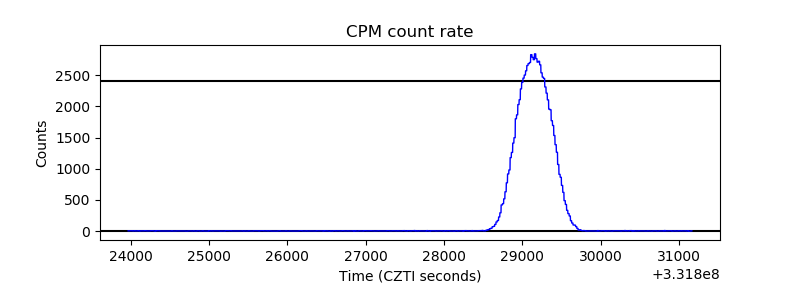 |
| CZT Counter | 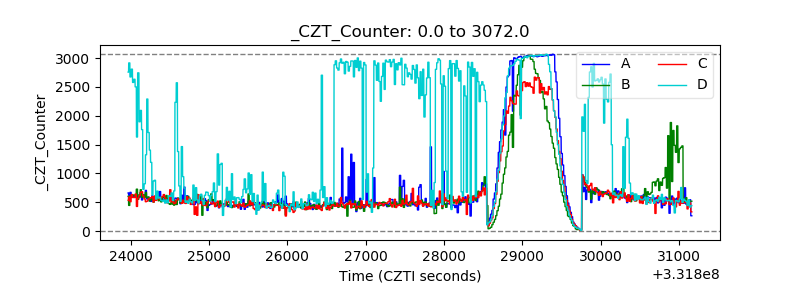 |
| +2.5 Volts monitor |  |
| +5 Volts monitor | 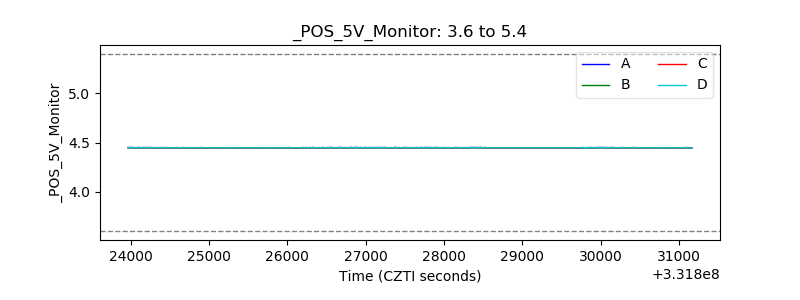 |
| _ROLL_ROT | 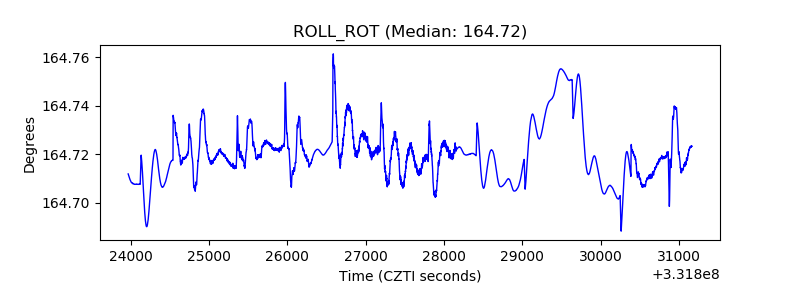 |
| _Roll_DEC | 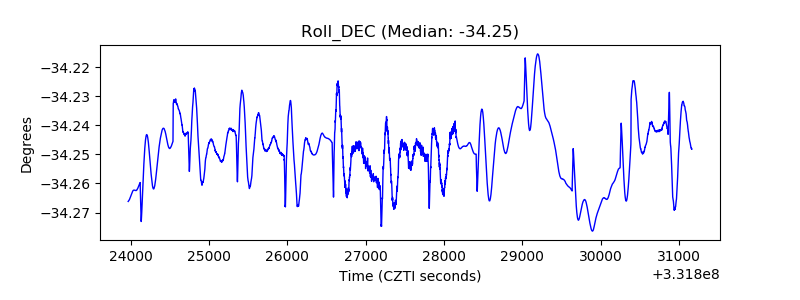 |
| _Roll_RA | 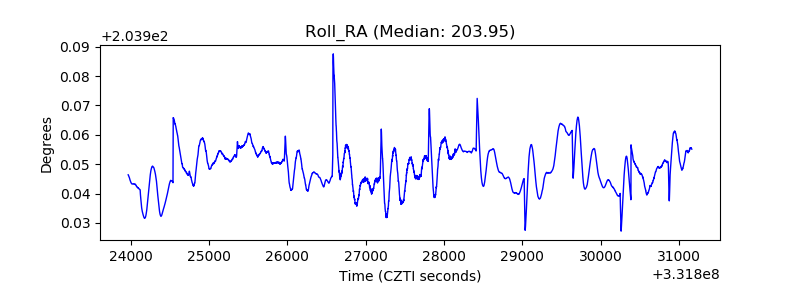 |
| Veto Counter | 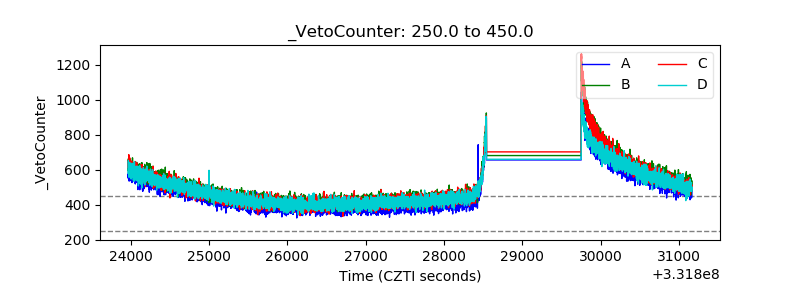 |