| Param | Original file | Final file |
|---|---|---|
| Filename | modeM0/AS1A07_068T01_9000003756_25822cztM0_level2.evt | modeM0/AS1A07_068T01_9000003756_25822cztM0_level2_quad_clean.evt |
| Size (bytes) | 602,190,720 | 101,514,240 |
| Size | 574.3 MB | 96.8 MB |
| Events in quadrant A | 3,359,387 | 709,969 |
| Events in quadrant B | 3,648,861 | 704,978 |
| Events in quadrant C | 3,311,776 | 651,421 |
| Events in quadrant D | 7,491,429 | 568,763 |
| Mode M0 | |||
|---|---|---|---|
| Quadrant | BADHDUFLAG | Total packets | Discarded packets |
| A | 0 | 14004 | 0 |
| B | 0 | 15002 | 0 |
| C | 0 | 13814 | 0 |
| D | 0 | 26288 | 0 |
| Mode M9 | |||
|---|---|---|---|
| Quadrant | BADHDUFLAG | Total packets | Discarded packets |
| A | 0 | 14 | 0 |
| B | 0 | 14 | 0 |
| C | 0 | 15 | 0 |
| D | 0 | 15 | 0 |
| Quadrant | Total seconds | Saturated seconds | Saturation percentage |
|---|---|---|---|
| A | 6287 | 64 | 1.017974% |
| B | 6287 | 85 | 1.351996% |
| C | 6287 | 103 | 1.638301% |
| D | 6287 | 1609 | 25.592492% |
Noise dominated data is calculated using 1-second bins in cleaned event files. If a bin has >2000 counts, and if more than 50% of those come from <1% of pixels, then it is considered to be noise-dominated and hence unusable.
| Quadrant | # 1 sec bins | Bins with >0 counts | Bins with >2000 counts | High rate bins dominated by noise | Noise dominated (total time) | Noise dominated (detector-on time) | Marked lightcurve |
|---|---|---|---|---|---|---|---|
| A | 7606 | 6286 | 0 | 0 | 0.00% | 0.00% | 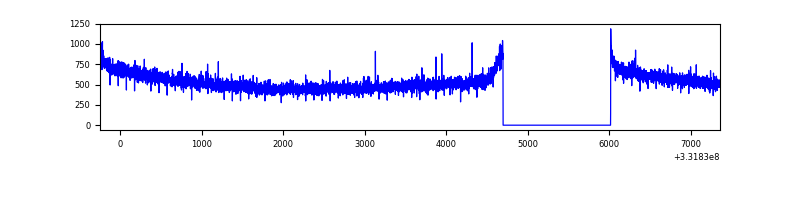 |
| B | 7606 | 6287 | 9 | 9 | 0.12% | 0.14% | 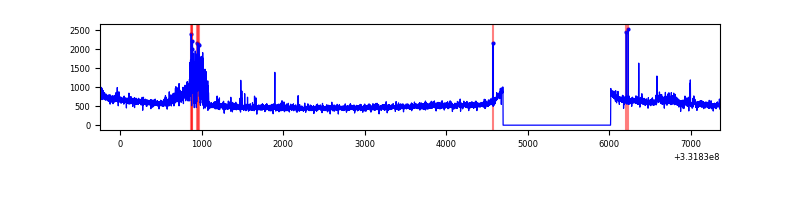 |
| C | 7606 | 6286 | 1 | 1 | 0.01% | 0.02% | 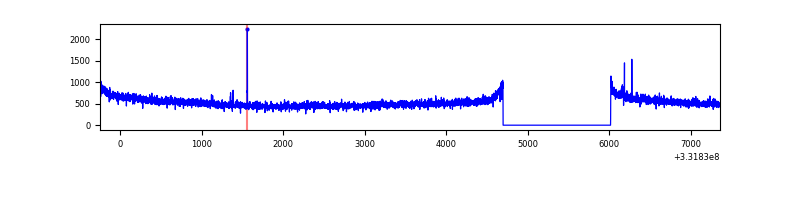 |
| D | 7606 | 6286 | 1579 | 1579 | 20.76% | 25.12% | 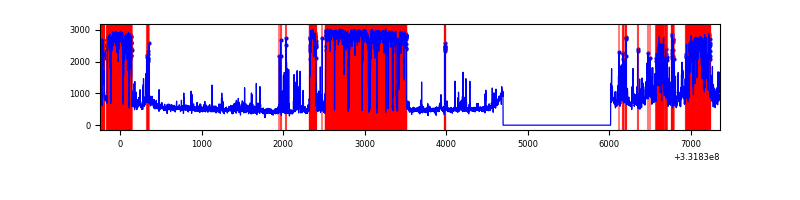 |
Top three noisy pixels from each quadrant. If the there are fewer than three noisy pixels in the level2.evt file, extra rows are filled as -1
| Pixel properties | Quadrant properties | ||||||
|---|---|---|---|---|---|---|---|
| Quadrant | DetID | PixID | Counts | Sigma | Mean | Median | Sigma |
| A | 13 | 254 | 9051 | 47.26 | 870 | 857 | 173.4 |
| A | 0 | 226 | 7726 | 39.62 | 870 | 857 | 173.4 |
| A | 3 | 137 | 7350 | 37.45 | 870 | 857 | 173.4 |
| B | 15 | 33 | 233039 | 1456.1 | 849 | 830 | 159.5 |
| B | 0 | 219 | 42815 | 263.27 | 849 | 830 | 159.5 |
| B | 0 | 190 | 31166 | 190.23 | 849 | 830 | 159.5 |
| C | 14 | 238 | 129918 | 699.22 | 802 | 808 | 184.6 |
| C | 3 | 233 | 29200 | 153.76 | 802 | 808 | 184.6 |
| C | 4 | 175 | 17857 | 92.33 | 802 | 808 | 184.6 |
| D | 7 | 223 | 3355017 | 19970.32 | 702 | 687 | 168.0 |
| D | 7 | 80 | 638222 | 3795.62 | 702 | 687 | 168.0 |
| D | 12 | 233 | 627734 | 3733.18 | 702 | 687 | 168.0 |
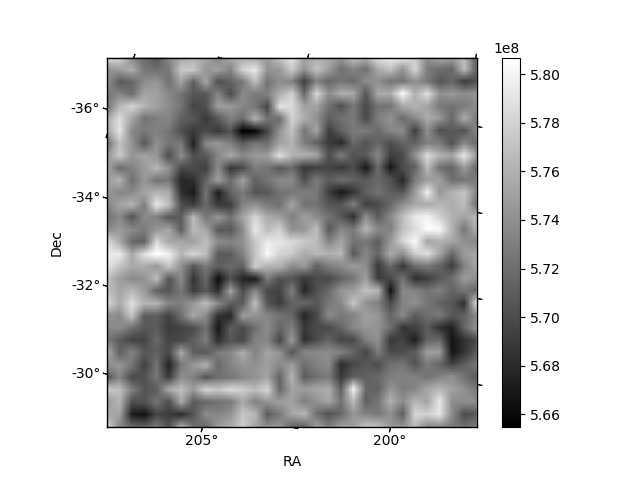
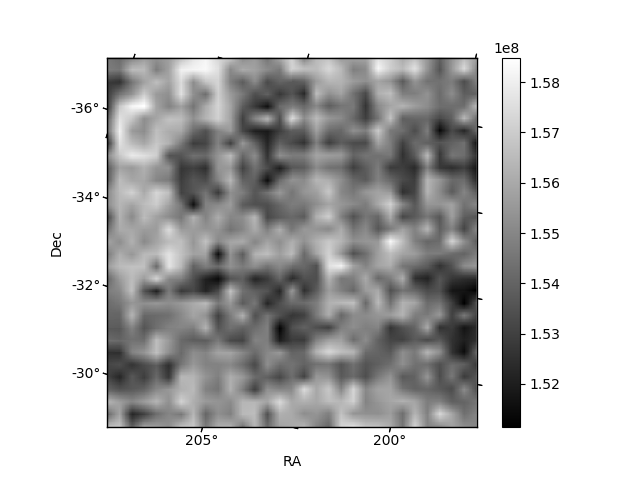
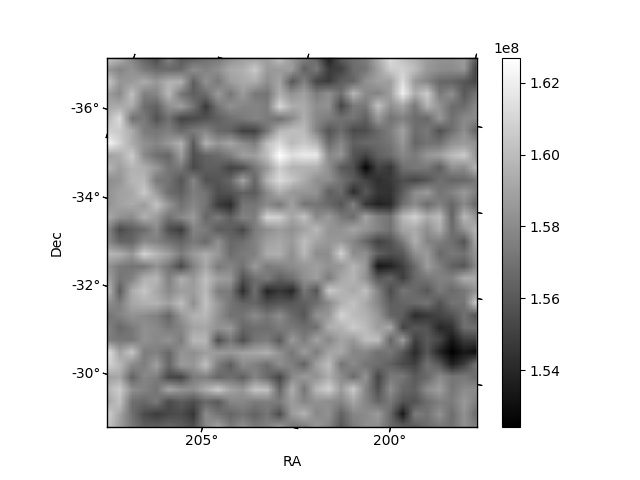
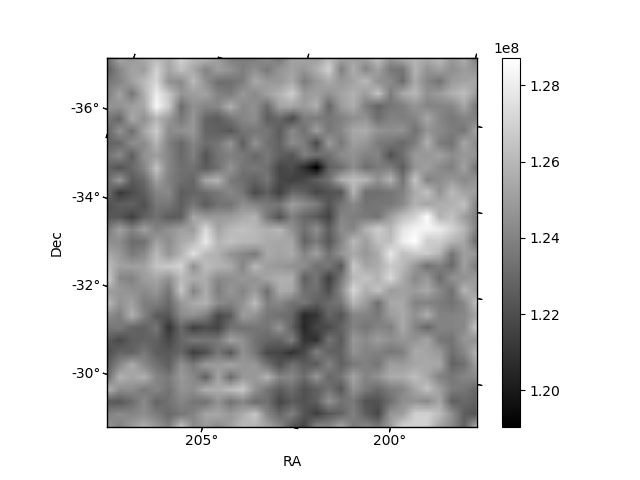
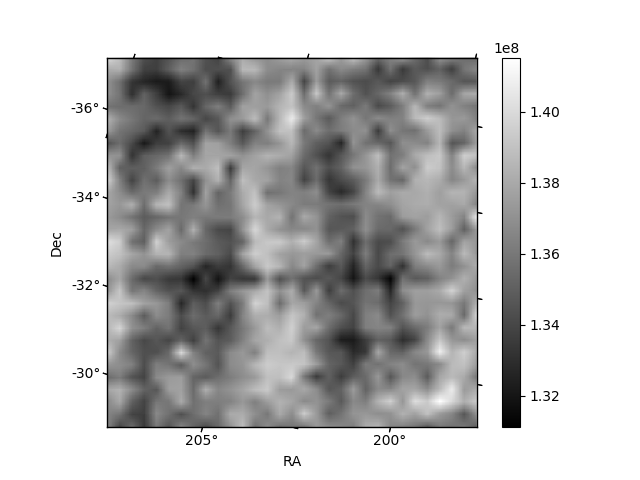
Histogram calculated using DETX and DETY for each event in the final _common_clean file
| Quadrant A | 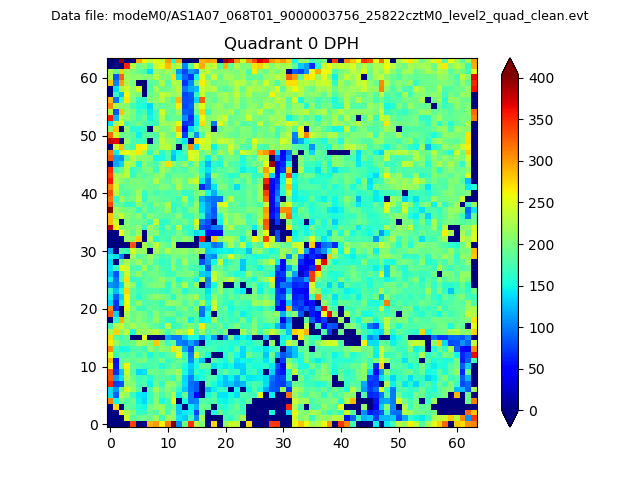 |
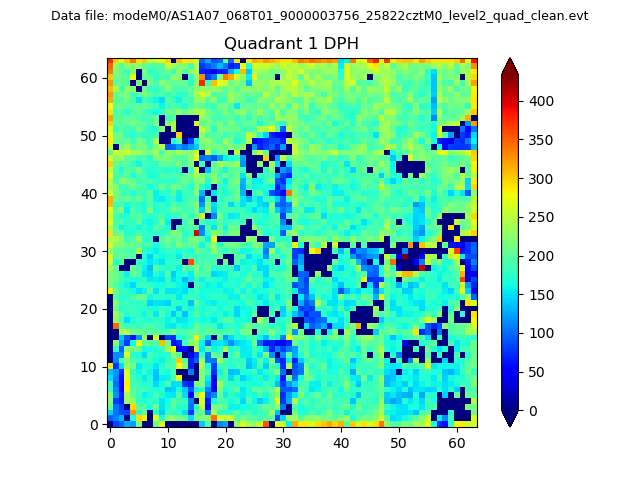 |
Quadrant B |
|---|---|---|---|
| Quadrant D | 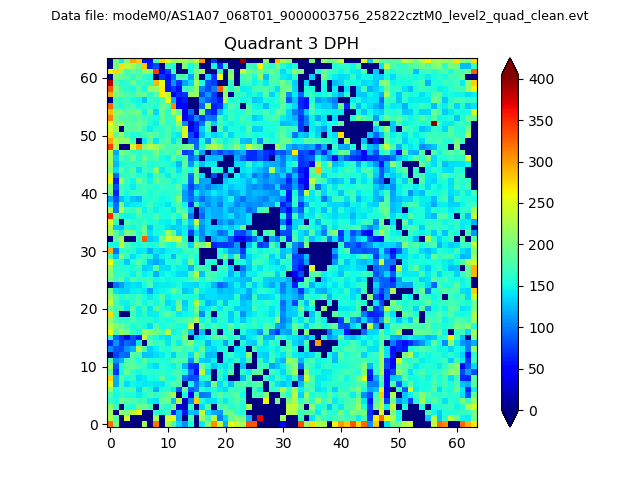 |
 |
Quadrant C |
| Plot type | Count rate plots | Images |
|---|---|---|
| Comparison with Poisson distribution Blue bars denote a histogram of data divided into 1 sec bins. Red curve is a Poisson curve with rate = median count rate of data. |
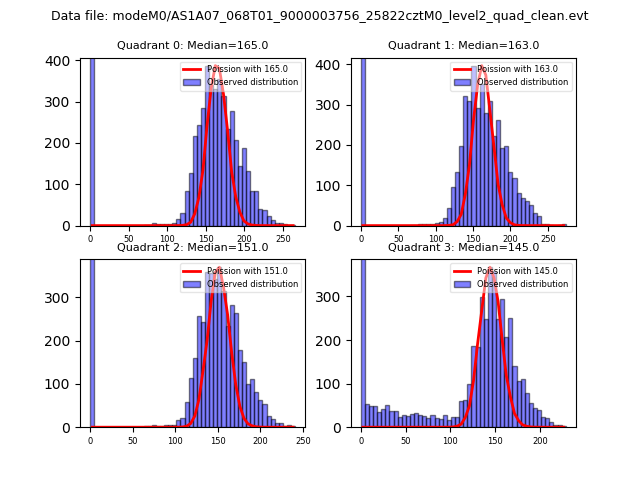 |
 |
| Quadrant-wise count rates Data is divided into 100 sec bins |
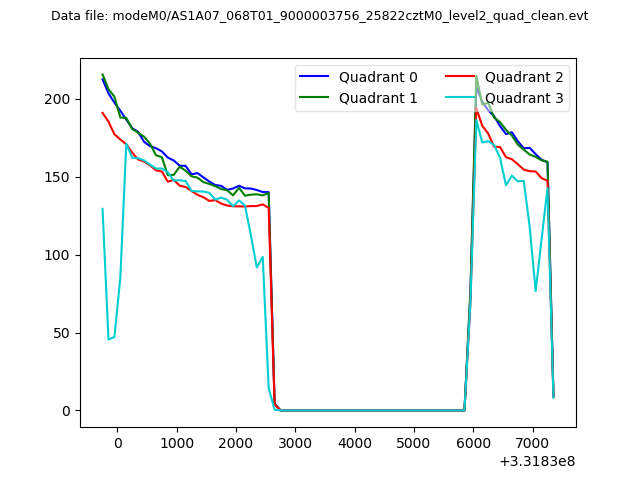 |
|
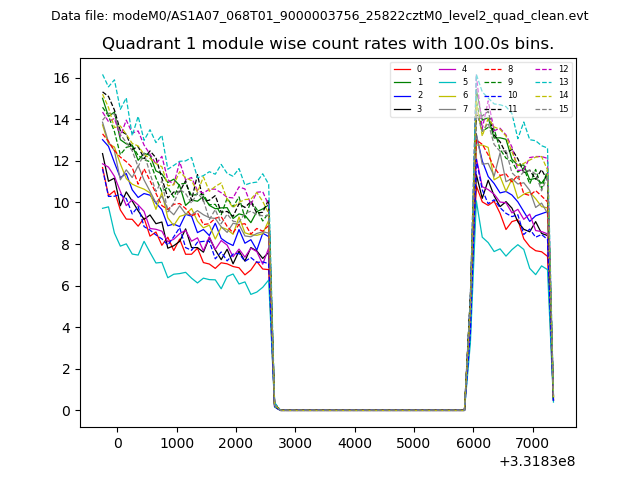
| Module-wise count rates for Quadrant A Data is divided into 100 sec bins |
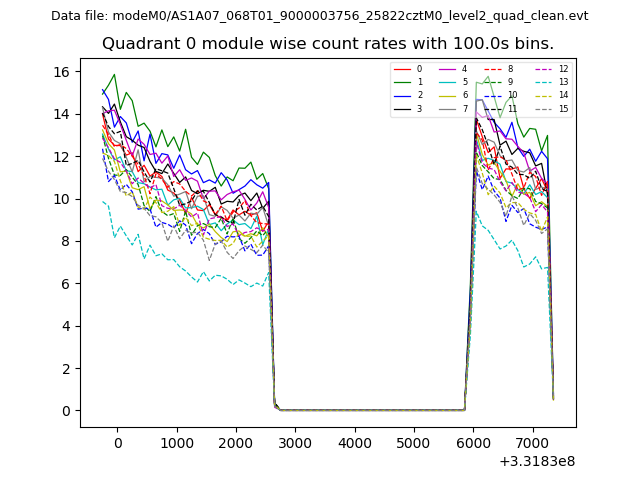 |
 |
| Module-wise count rates for Quadrant B Data is divided into 100 sec bins |
 |
 |
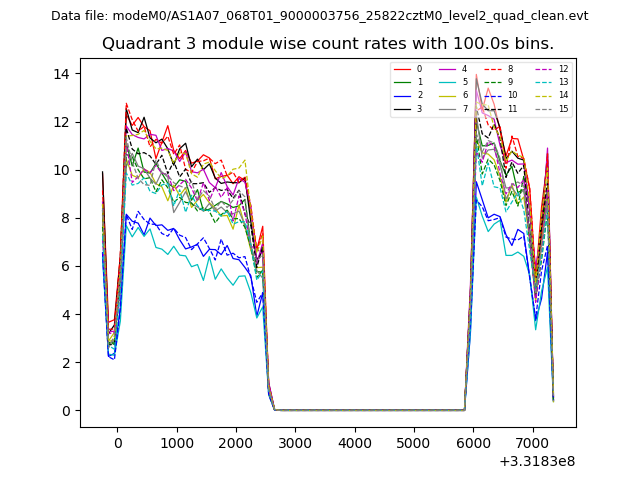
| Module-wise count rates for Quadrant C Data is divided into 100 sec bins |
 |
 |
| Module-wise count rates for Quadrant D Data is divided into 100 sec bins |
 |
 |
| Parameter | Plot |
|---|---|
| CZT HV Monitor | 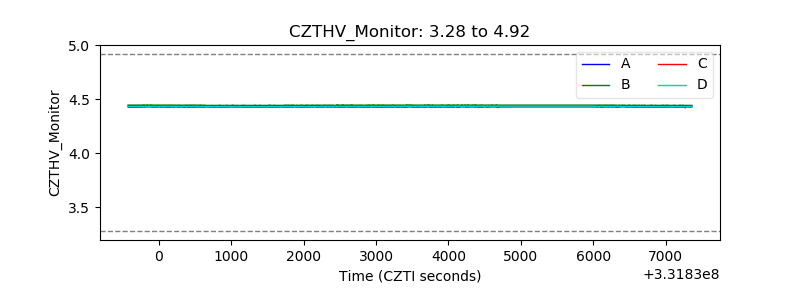 |
| D_VDD | 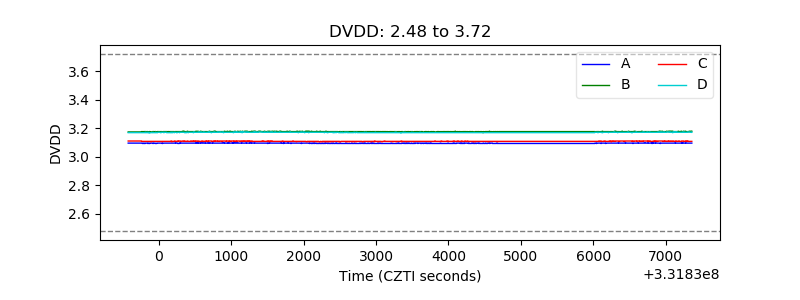 |
| Temperature 1 | 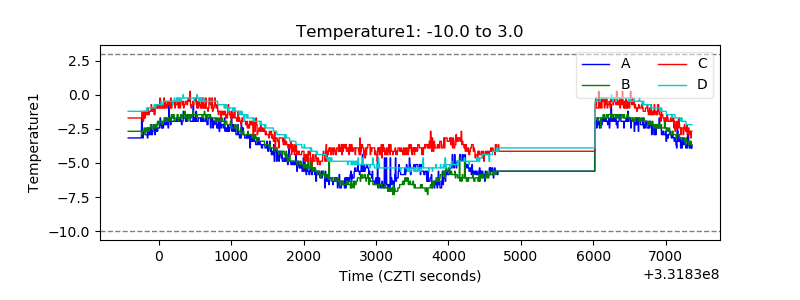 |
| Veto HV Monitor | 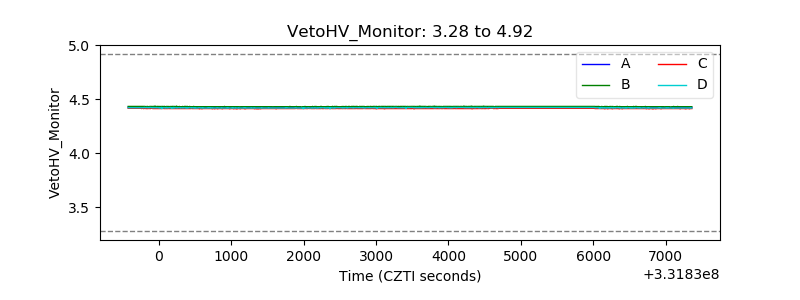 |
| Veto LLD | 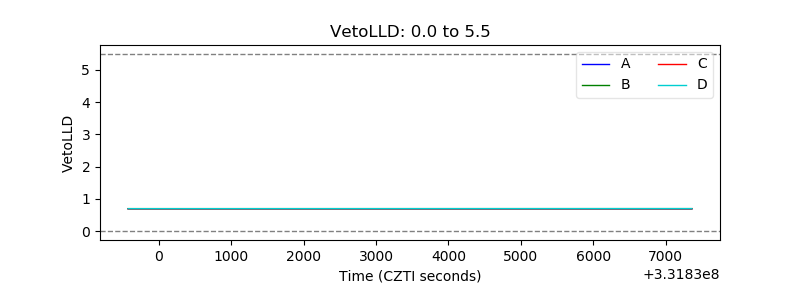 |
| Alpha Counter |  |
| _CPM_Rate | 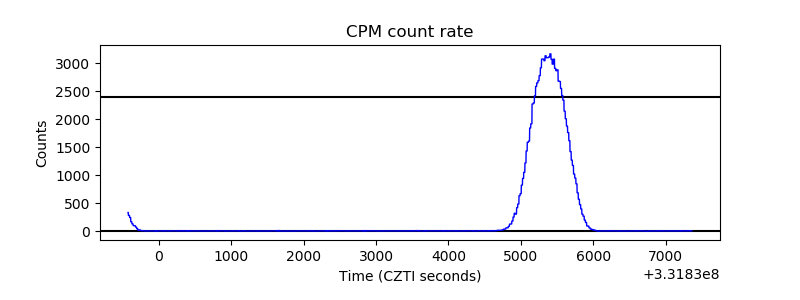 |
| CZT Counter | 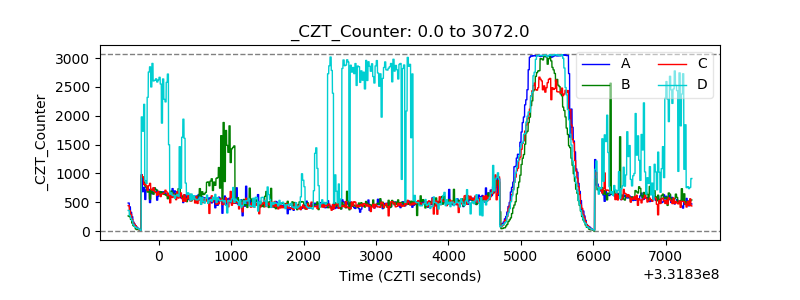 |
| +2.5 Volts monitor |  |
| +5 Volts monitor |  |
| _ROLL_ROT | 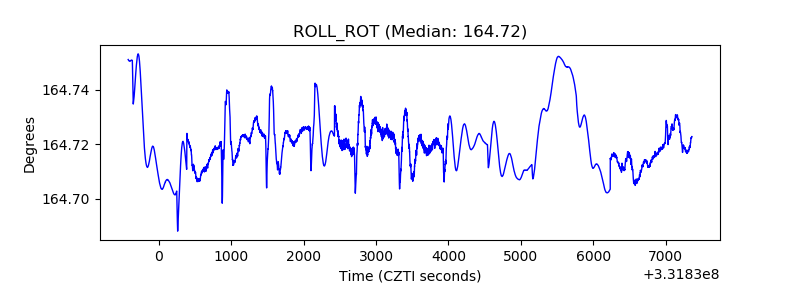 |
| _Roll_DEC | 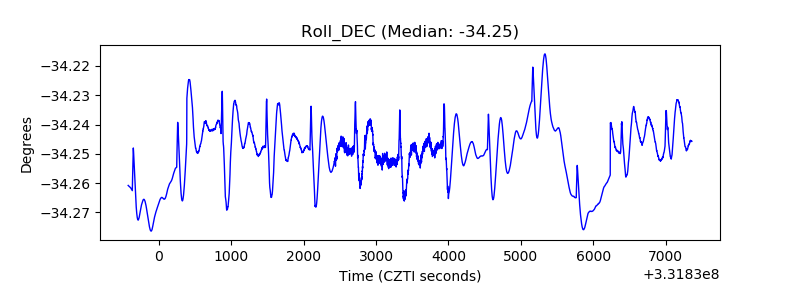 |
| _Roll_RA | 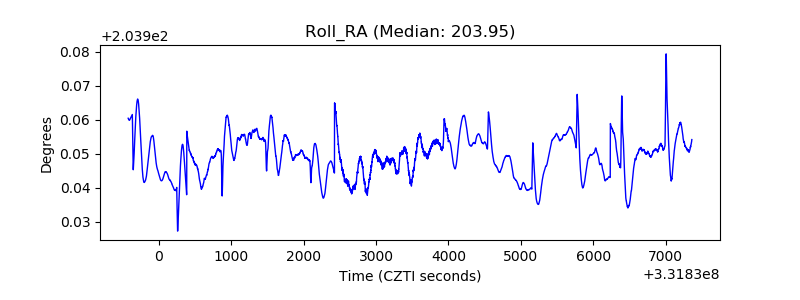 |
| Veto Counter | 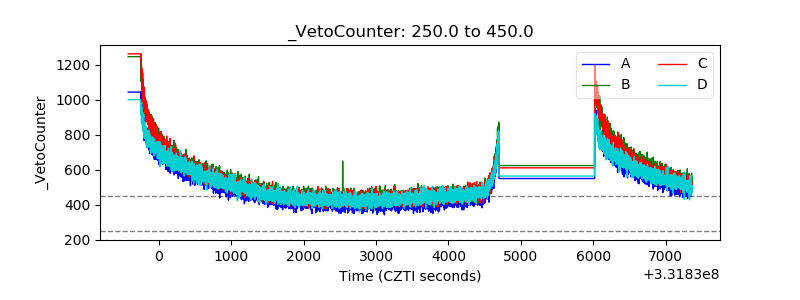 |