| Param | Original file | Final file |
|---|---|---|
| Filename | modeM0/AS1A07_068T01_9000003756_25824cztM0_level2.evt | modeM0/AS1A07_068T01_9000003756_25824cztM0_level2_quad_clean.evt |
| Size (bytes) | 500,768,640 | 94,872,960 |
| Size | 477.6 MB | 90.5 MB |
| Events in quadrant A | 3,263,615 | 639,538 |
| Events in quadrant B | 3,255,884 | 646,330 |
| Events in quadrant C | 3,149,204 | 601,025 |
| Events in quadrant D | 5,074,854 | 551,808 |
| Mode M0 | |||
|---|---|---|---|
| Quadrant | BADHDUFLAG | Total packets | Discarded packets |
| A | 0 | 13604 | 0 |
| B | 0 | 13534 | 0 |
| C | 0 | 13196 | 0 |
| D | 0 | 19254 | 0 |
| Mode M9 | |||
|---|---|---|---|
| Quadrant | BADHDUFLAG | Total packets | Discarded packets |
| A | 0 | 18 | 0 |
| B | 0 | 19 | 0 |
| C | 0 | 19 | 0 |
| D | 0 | 19 | 0 |
| Quadrant | Total seconds | Saturated seconds | Saturation percentage |
|---|---|---|---|
| A | 6224 | 29 | 0.465938% |
| B | 6224 | 55 | 0.883676% |
| C | 6224 | 76 | 1.221080% |
| D | 6224 | 564 | 9.061697% |
Noise dominated data is calculated using 1-second bins in cleaned event files. If a bin has >2000 counts, and if more than 50% of those come from <1% of pixels, then it is considered to be noise-dominated and hence unusable.
| Quadrant | # 1 sec bins | Bins with >0 counts | Bins with >2000 counts | High rate bins dominated by noise | Noise dominated (total time) | Noise dominated (detector-on time) | Marked lightcurve |
|---|---|---|---|---|---|---|---|
| A | 7583 | 6223 | 0 | 0 | 0.00% | 0.00% | 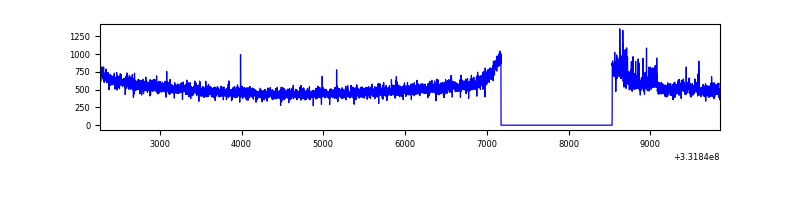 |
| B | 7584 | 6225 | 3 | 3 | 0.04% | 0.05% | 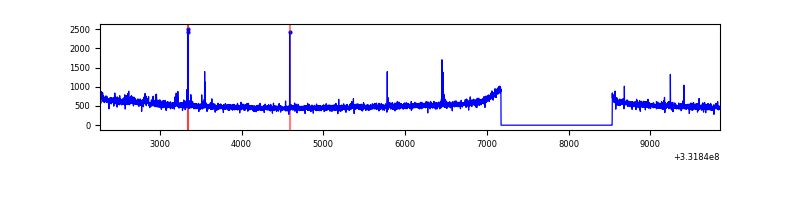 |
| C | 7583 | 6224 | 0 | 0 | 0.00% | 0.00% | 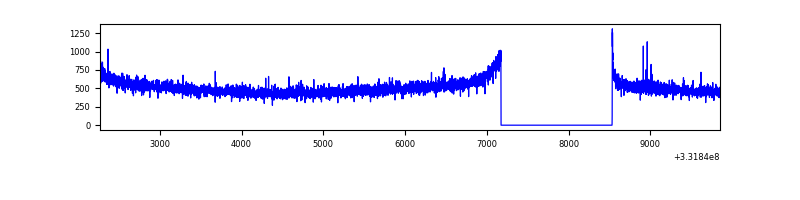 |
| D | 7583 | 6224 | 597 | 597 | 7.87% | 9.59% | 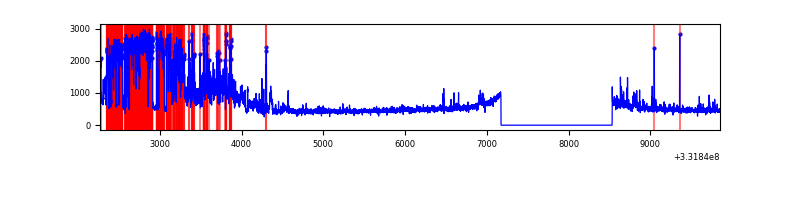 |
Top three noisy pixels from each quadrant. If the there are fewer than three noisy pixels in the level2.evt file, extra rows are filled as -1
| Pixel properties | Quadrant properties | ||||||
|---|---|---|---|---|---|---|---|
| Quadrant | DetID | PixID | Counts | Sigma | Mean | Median | Sigma |
| A | 0 | 13 | 99867 | 608.25 | 821 | 810 | 162.9 |
| A | 13 | 254 | 9404 | 52.77 | 821 | 810 | 162.9 |
| A | 3 | 137 | 7289 | 39.78 | 821 | 810 | 162.9 |
| B | 0 | 219 | 36802 | 235.87 | 812 | 796 | 152.6 |
| B | 12 | 111 | 18115 | 113.46 | 812 | 796 | 152.6 |
| B | 11 | 111 | 16401 | 102.23 | 812 | 796 | 152.6 |
| C | 14 | 238 | 125951 | 700.27 | 769 | 774 | 178.8 |
| C | 3 | 233 | 20922 | 112.71 | 769 | 774 | 178.8 |
| C | 13 | 61 | 5263 | 25.11 | 769 | 774 | 178.8 |
| D | 7 | 80 | 1891518 | 10506.12 | 749 | 730 | 180.0 |
| D | 1 | 52 | 168082 | 929.89 | 749 | 730 | 180.0 |
| D | 12 | 233 | 107132 | 591.22 | 749 | 730 | 180.0 |
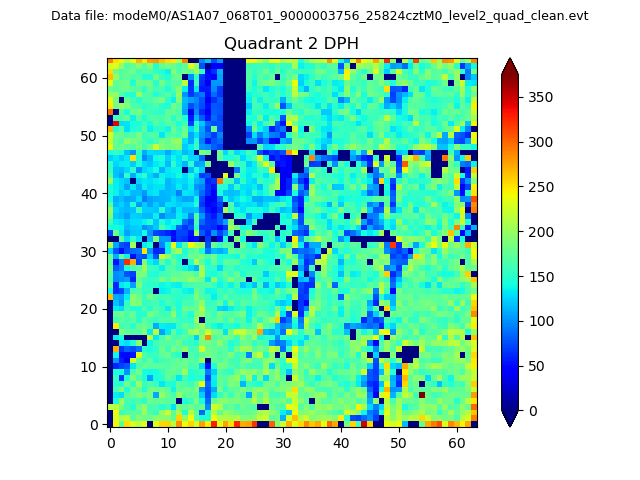
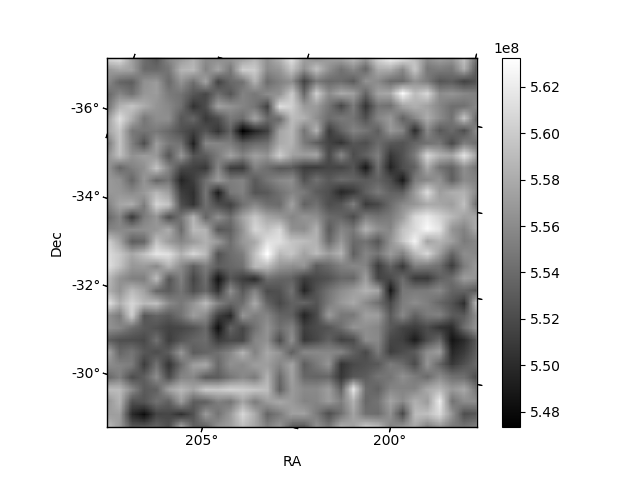
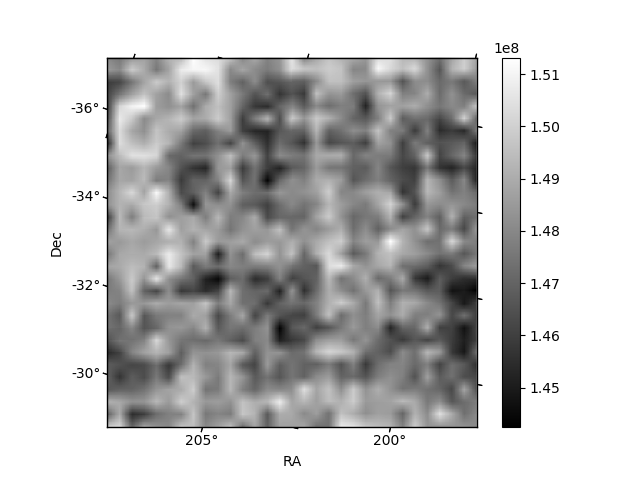
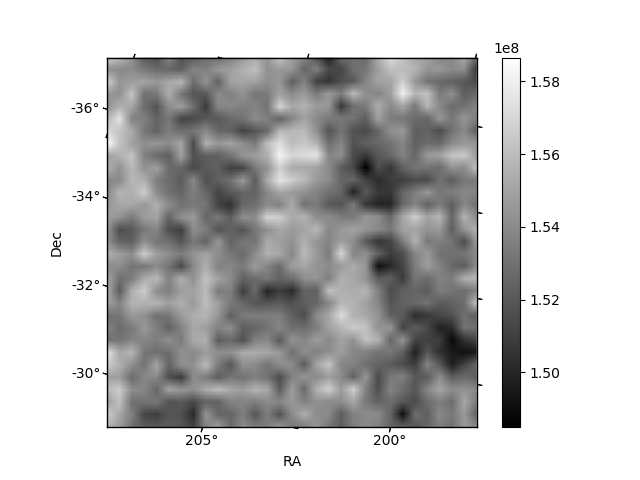
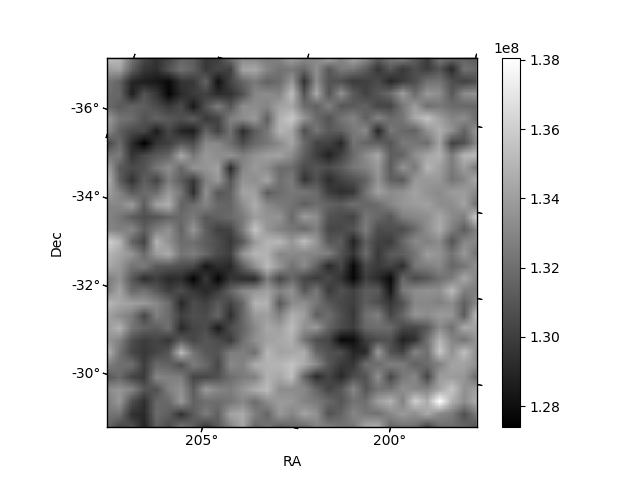
Histogram calculated using DETX and DETY for each event in the final _common_clean file
| Quadrant A | 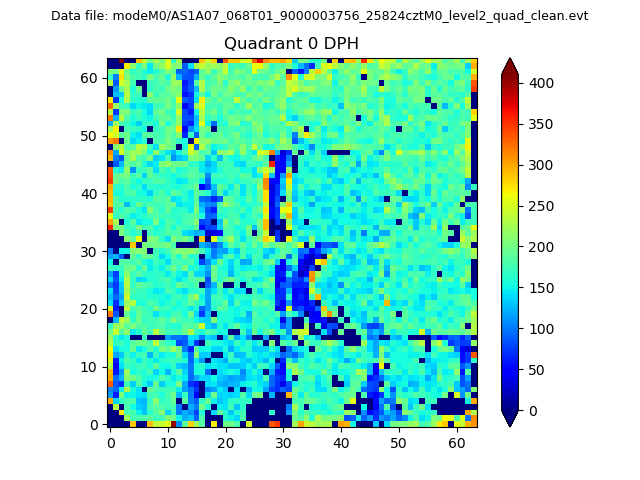 |
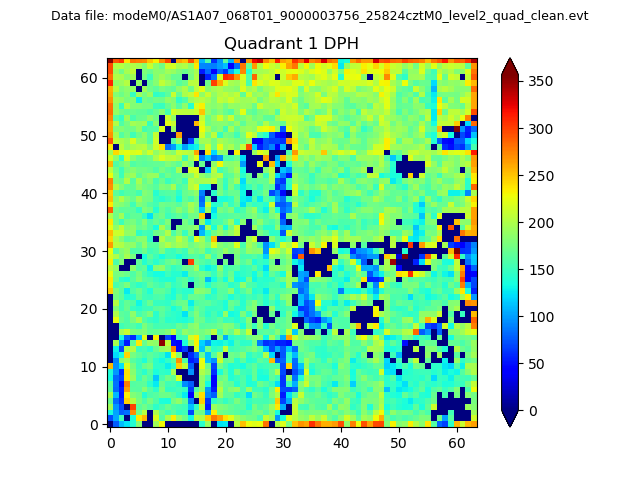 |
Quadrant B |
|---|---|---|---|
| Quadrant D | 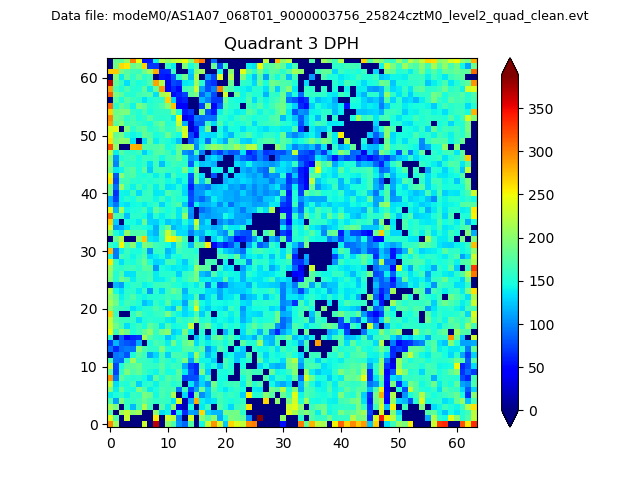 |
 |
Quadrant C |
| Plot type | Count rate plots | Images |
|---|---|---|
| Comparison with Poisson distribution Blue bars denote a histogram of data divided into 1 sec bins. Red curve is a Poisson curve with rate = median count rate of data. |
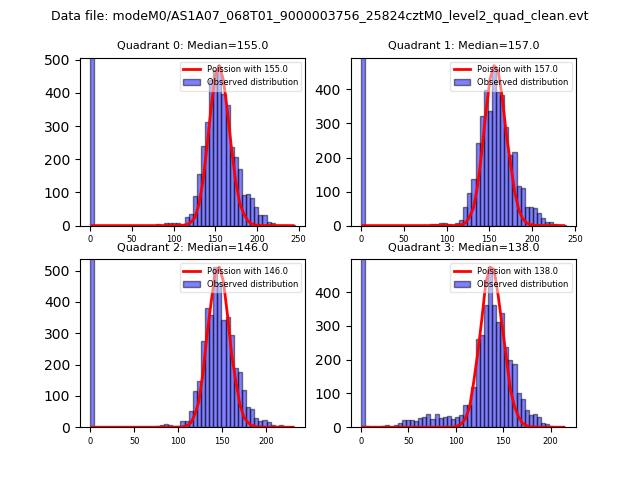 |
 |
| Quadrant-wise count rates Data is divided into 100 sec bins |
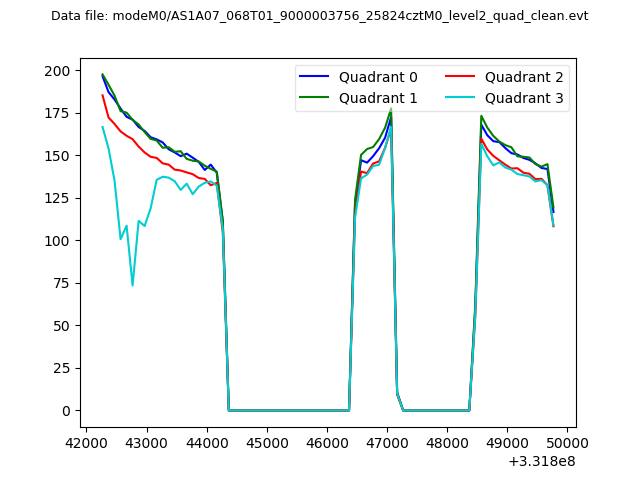 |
|
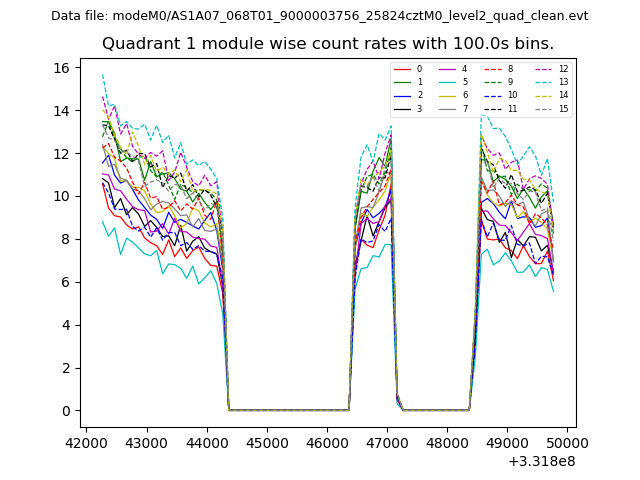
| Module-wise count rates for Quadrant A Data is divided into 100 sec bins |
 |
 |
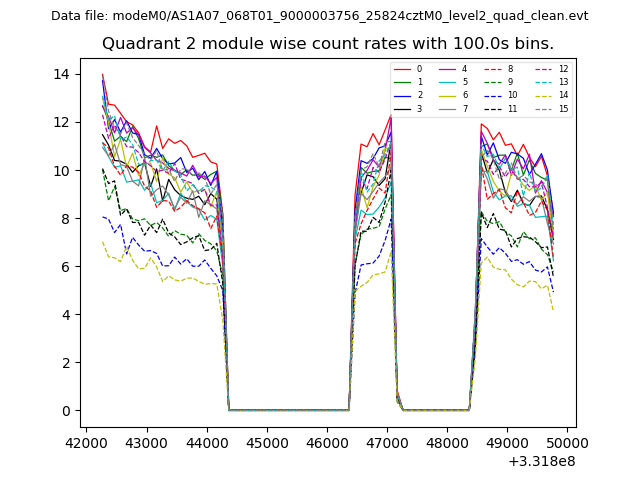
| Module-wise count rates for Quadrant B Data is divided into 100 sec bins |
 |
 |
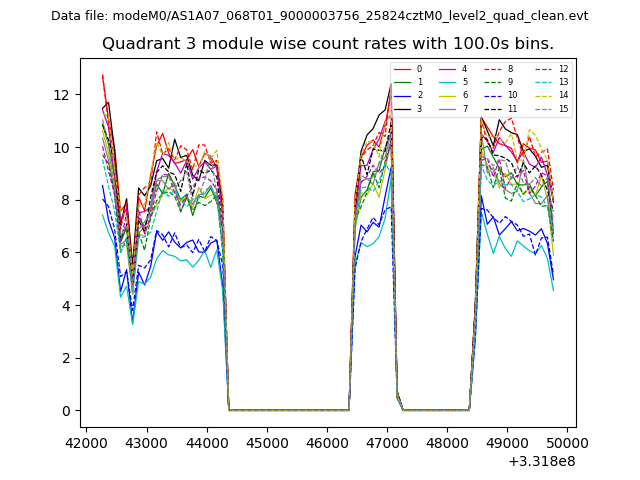
| Module-wise count rates for Quadrant C Data is divided into 100 sec bins |
 |
 |
| Module-wise count rates for Quadrant D Data is divided into 100 sec bins |
 |
 |
| Parameter | Plot |
|---|---|
| CZT HV Monitor | 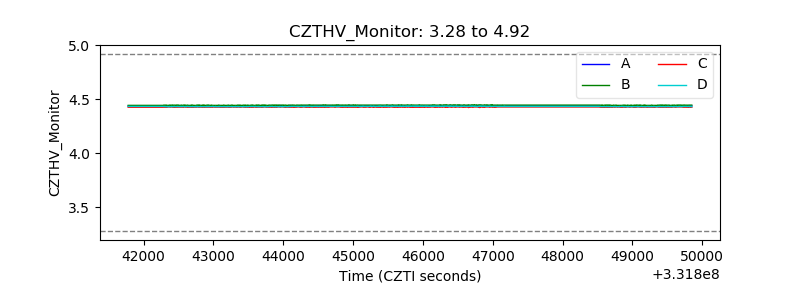 |
| D_VDD | 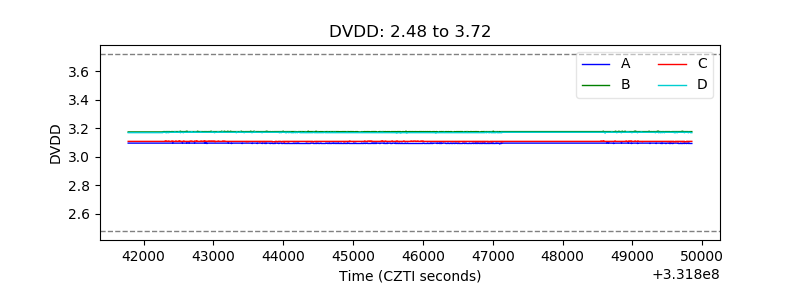 |
| Temperature 1 |  |
| Veto HV Monitor | 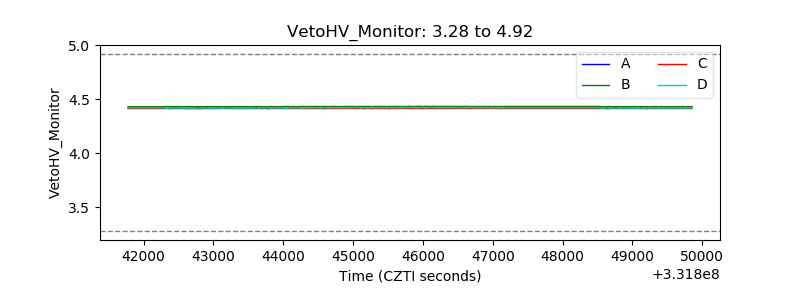 |
| Veto LLD | 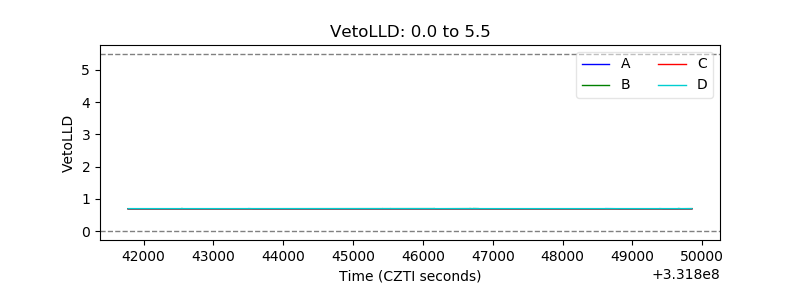 |
| Alpha Counter |  |
| _CPM_Rate | 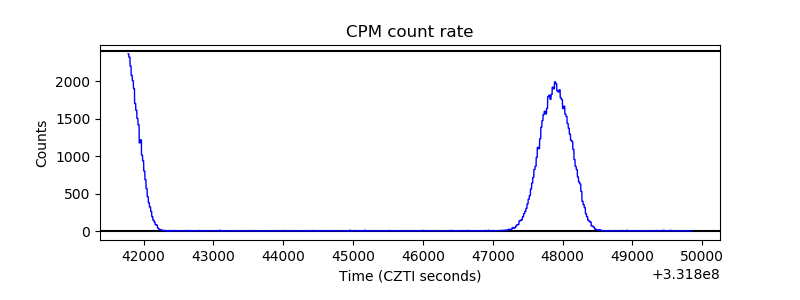 |
| CZT Counter | 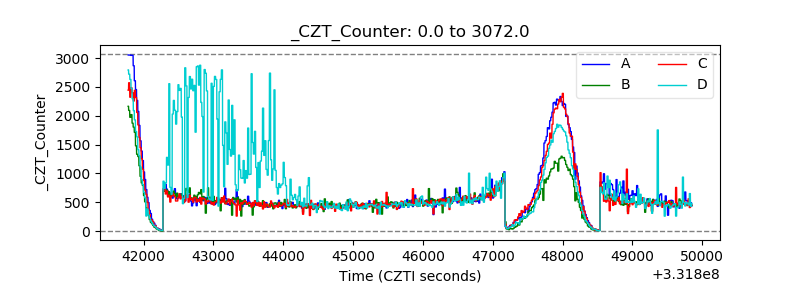 |
| +2.5 Volts monitor |  |
| +5 Volts monitor |  |
| _ROLL_ROT |  |
| _Roll_DEC |  |
| _Roll_RA | 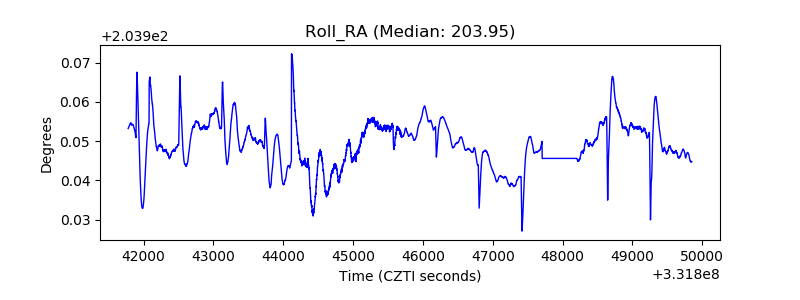 |
| Veto Counter | 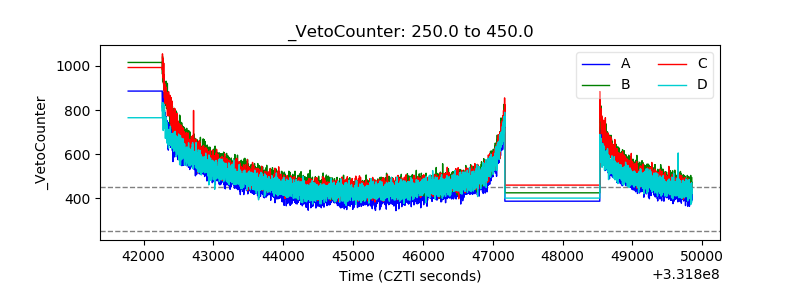 |