| Param | Original file | Final file |
|---|---|---|
| Filename | modeM0/AS1A07_068T01_9000003756_25825cztM0_level2.evt | modeM0/AS1A07_068T01_9000003756_25825cztM0_level2_quad_clean.evt |
| Size (bytes) | 437,149,440 | 93,833,280 |
| Size | 416.9 MB | 89.5 MB |
| Events in quadrant A | 3,245,859 | 613,818 |
| Events in quadrant B | 3,205,168 | 621,878 |
| Events in quadrant C | 3,146,676 | 581,190 |
| Events in quadrant D | 3,205,313 | 577,201 |
| Mode M0 | |||
|---|---|---|---|
| Quadrant | BADHDUFLAG | Total packets | Discarded packets |
| A | 0 | 13708 | 0 |
| B | 0 | 13477 | 0 |
| C | 0 | 13448 | 0 |
| D | 0 | 13863 | 0 |
| Mode M9 | |||
|---|---|---|---|
| Quadrant | BADHDUFLAG | Total packets | Discarded packets |
| A | 0 | 13 | 0 |
| B | 0 | 14 | 0 |
| C | 0 | 14 | 0 |
| D | 0 | 14 | 0 |
| Quadrant | Total seconds | Saturated seconds | Saturation percentage |
|---|---|---|---|
| A | 6410 | 22 | 0.343214% |
| B | 6410 | 17 | 0.265211% |
| C | 6410 | 44 | 0.686427% |
| D | 6410 | 20 | 0.312012% |
Noise dominated data is calculated using 1-second bins in cleaned event files. If a bin has >2000 counts, and if more than 50% of those come from <1% of pixels, then it is considered to be noise-dominated and hence unusable.
| Quadrant | # 1 sec bins | Bins with >0 counts | Bins with >2000 counts | High rate bins dominated by noise | Noise dominated (total time) | Noise dominated (detector-on time) | Marked lightcurve |
|---|---|---|---|---|---|---|---|
| A | 7564 | 6410 | 0 | 0 | 0.00% | 0.00% | 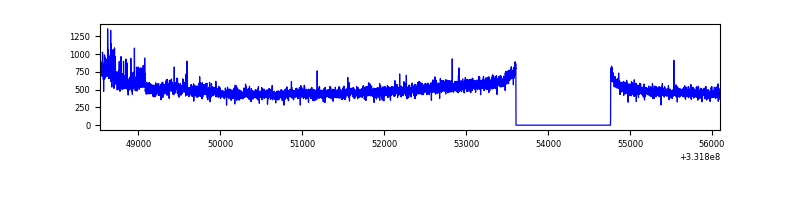 |
| B | 7565 | 6411 | 3 | 3 | 0.04% | 0.05% | 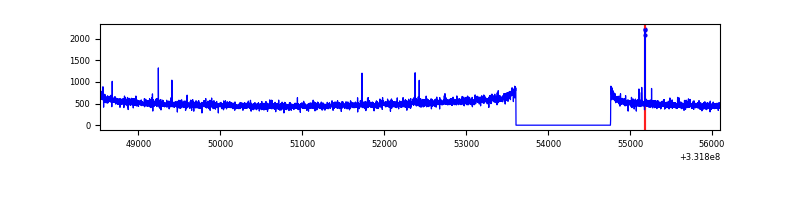 |
| C | 7565 | 6411 | 0 | 0 | 0.00% | 0.00% | 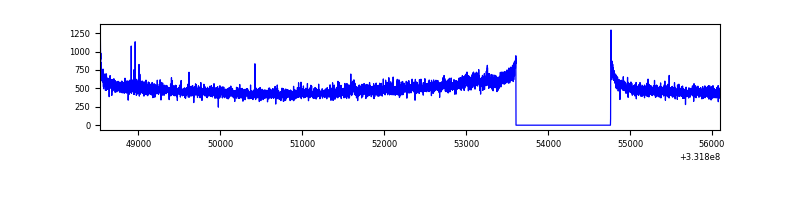 |
| D | 7565 | 6411 | 9 | 9 | 0.12% | 0.14% | 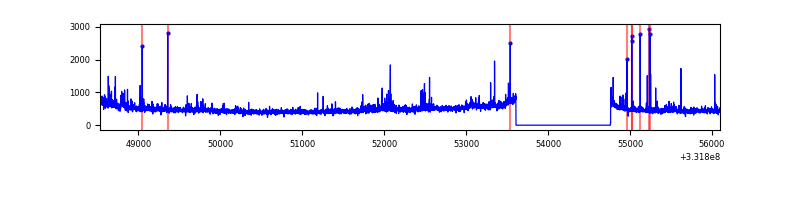 |
Top three noisy pixels from each quadrant. If the there are fewer than three noisy pixels in the level2.evt file, extra rows are filled as -1
| Pixel properties | Quadrant properties | ||||||
|---|---|---|---|---|---|---|---|
| Quadrant | DetID | PixID | Counts | Sigma | Mean | Median | Sigma |
| A | 0 | 13 | 114462 | 702.22 | 812 | 797 | 161.9 |
| A | 13 | 254 | 9676 | 54.85 | 812 | 797 | 161.9 |
| A | 3 | 137 | 7635 | 42.24 | 812 | 797 | 161.9 |
| B | 0 | 219 | 35296 | 224.23 | 806 | 786 | 153.9 |
| B | 12 | 111 | 18493 | 115.05 | 806 | 786 | 153.9 |
| B | 11 | 111 | 16468 | 101.89 | 806 | 786 | 153.9 |
| C | 14 | 238 | 123482 | 685.59 | 765 | 771 | 179.0 |
| C | 3 | 233 | 34741 | 189.79 | 765 | 771 | 179.0 |
| C | 0 | 207 | 5276 | 25.17 | 765 | 771 | 179.0 |
| D | 7 | 80 | 166554 | 900.18 | 770 | 752 | 184.2 |
| D | 1 | 52 | 44760 | 238.93 | 770 | 752 | 184.2 |
| D | 8 | 195 | 34044 | 180.75 | 770 | 752 | 184.2 |
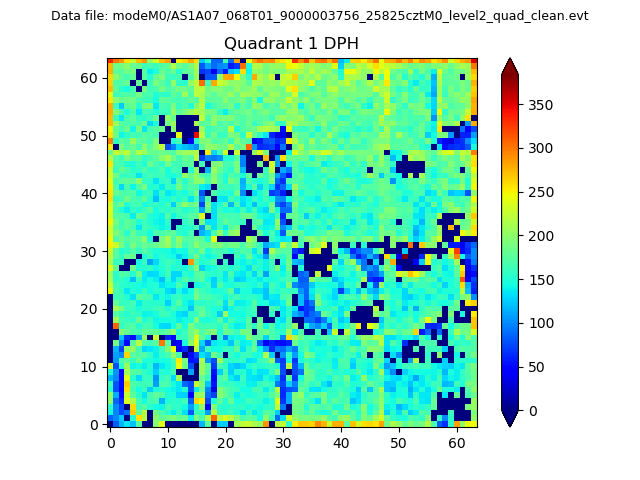
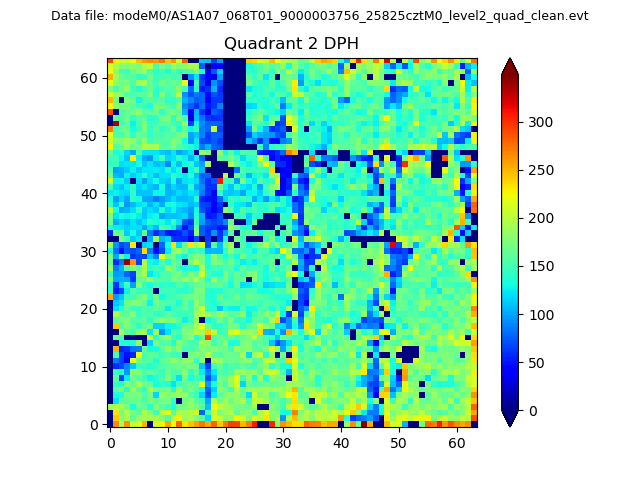
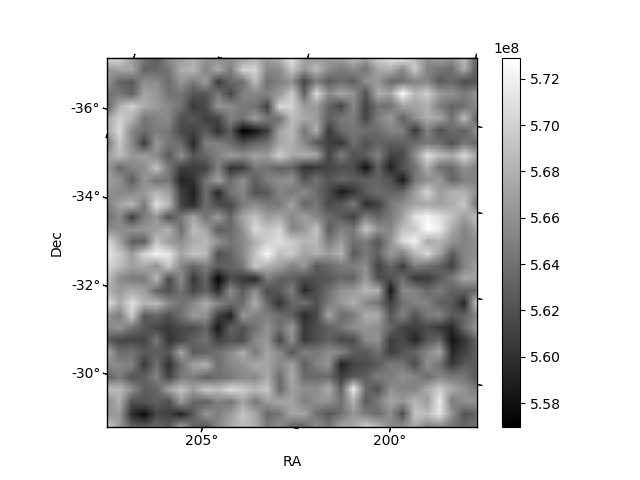
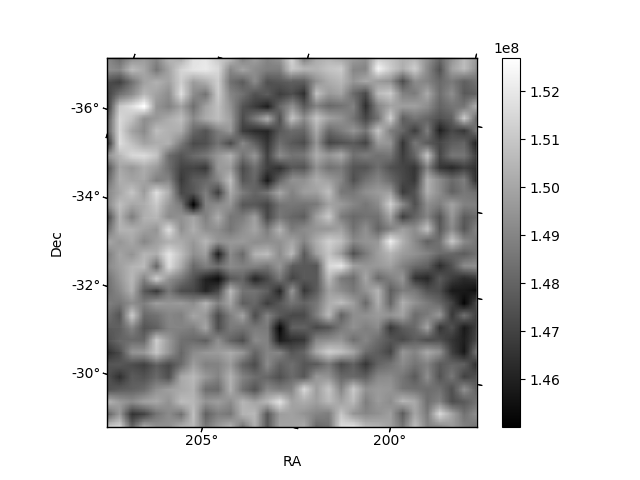
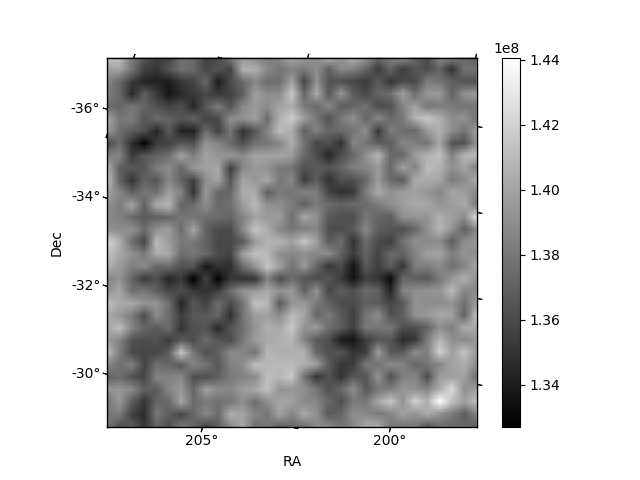
Histogram calculated using DETX and DETY for each event in the final _common_clean file
| Quadrant A |  |
 |
Quadrant B |
|---|---|---|---|
| Quadrant D | 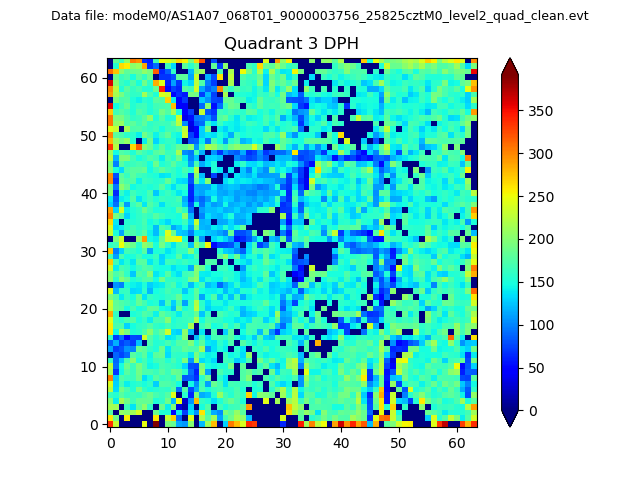 |
 |
Quadrant C |
| Plot type | Count rate plots | Images |
|---|---|---|
| Comparison with Poisson distribution Blue bars denote a histogram of data divided into 1 sec bins. Red curve is a Poisson curve with rate = median count rate of data. |
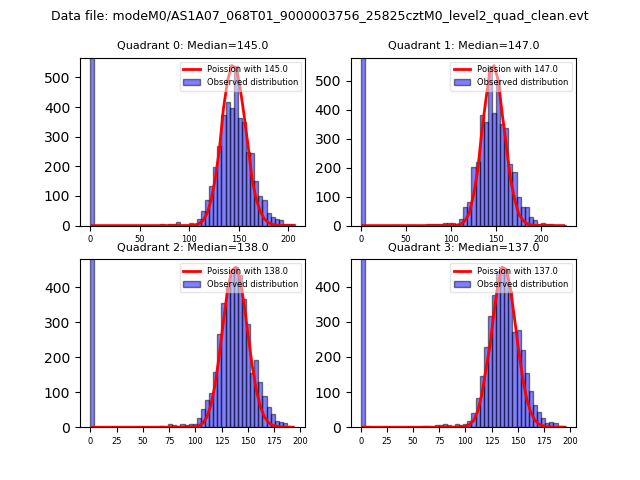 |
 |
| Quadrant-wise count rates Data is divided into 100 sec bins |
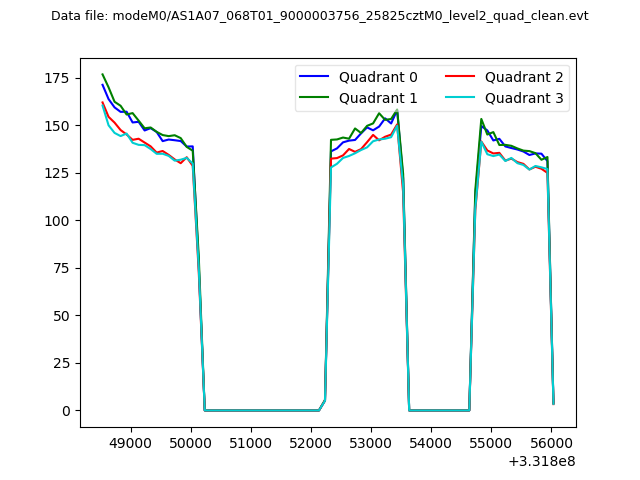 |
|
| Module-wise count rates for Quadrant A Data is divided into 100 sec bins |
 |
 |
| Module-wise count rates for Quadrant B Data is divided into 100 sec bins |
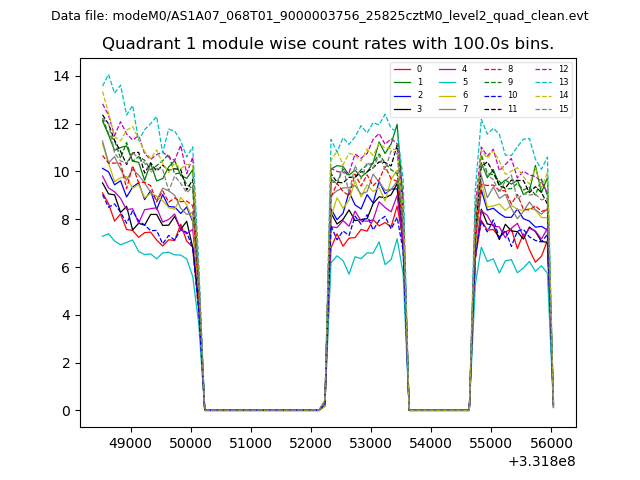 |
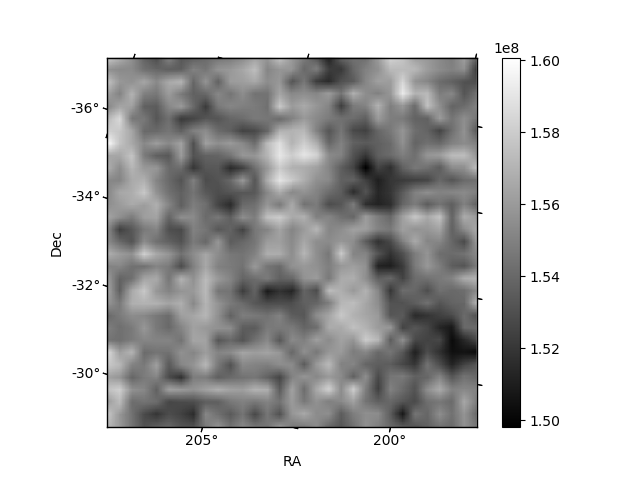 |
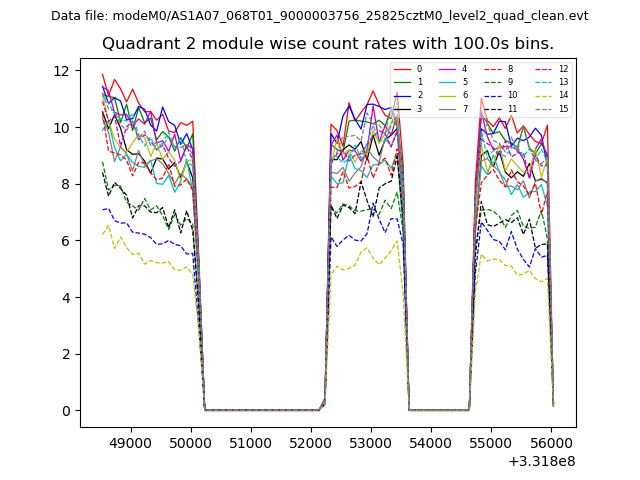
| Module-wise count rates for Quadrant C Data is divided into 100 sec bins |
 |
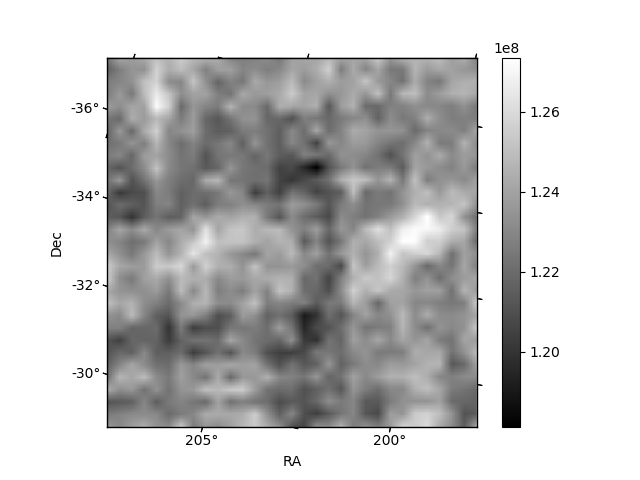 |
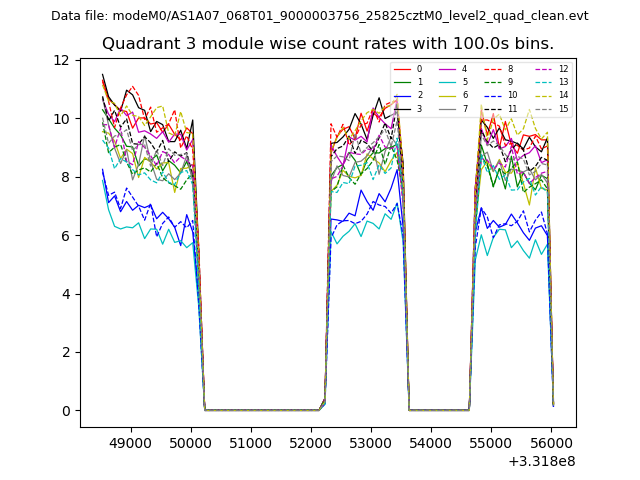
| Module-wise count rates for Quadrant D Data is divided into 100 sec bins |
 |
 |
| Parameter | Plot |
|---|---|
| CZT HV Monitor | 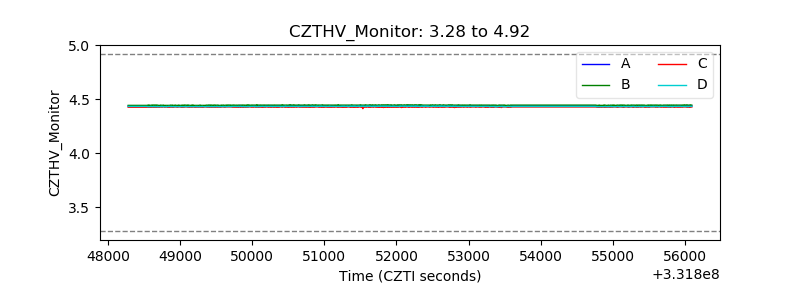 |
| D_VDD | 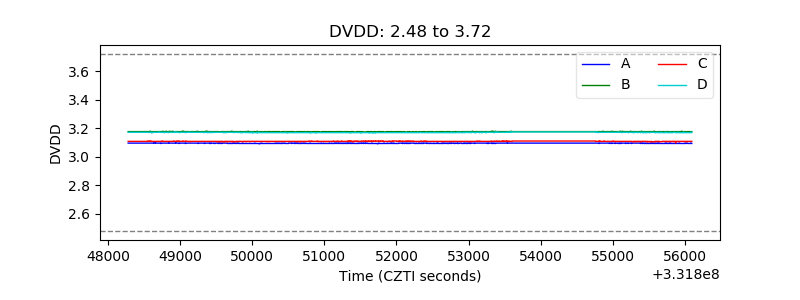 |
| Temperature 1 | 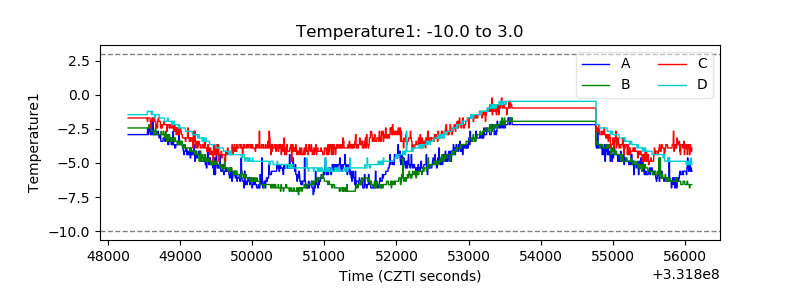 |
| Veto HV Monitor | 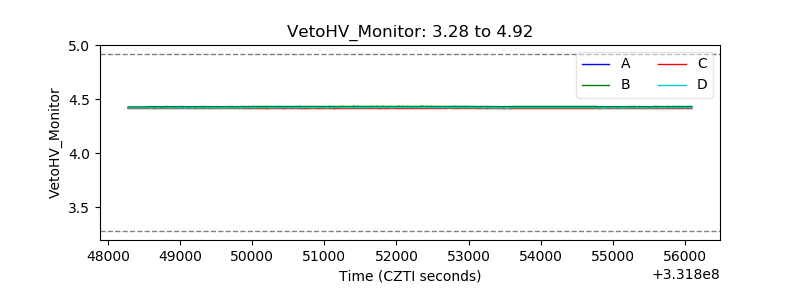 |
| Veto LLD |  |
| Alpha Counter | 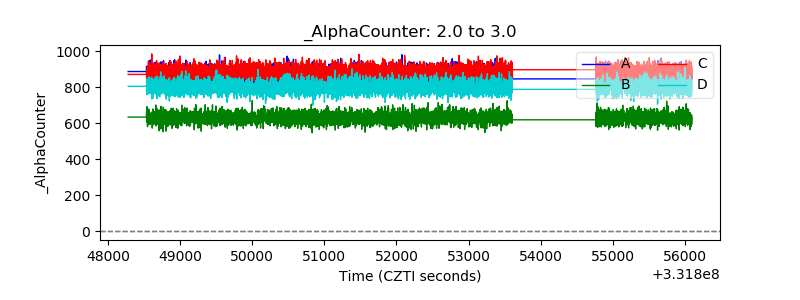 |
| _CPM_Rate | 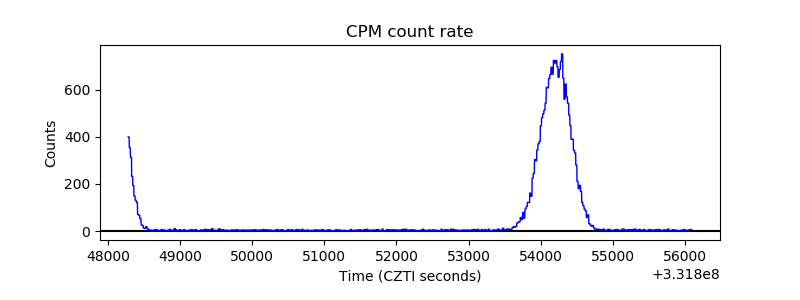 |
| CZT Counter | 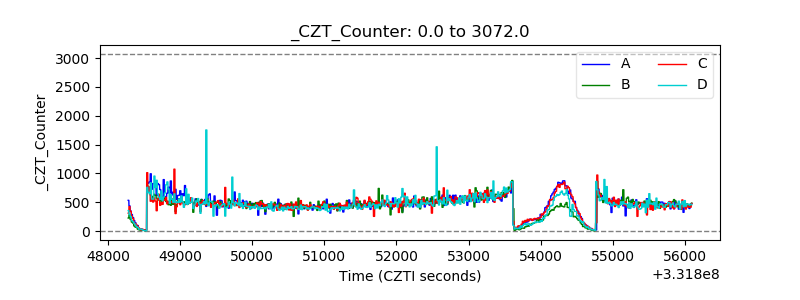 |
| +2.5 Volts monitor |  |
| +5 Volts monitor |  |
| _ROLL_ROT | 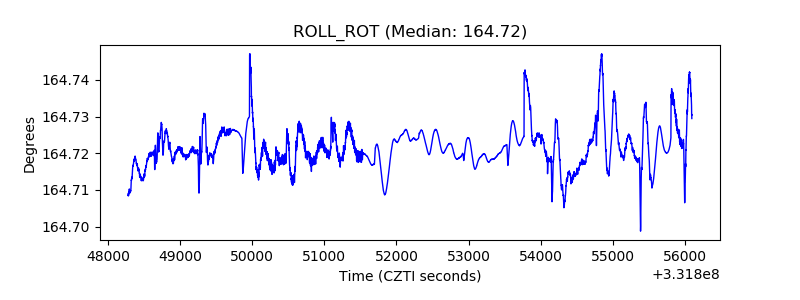 |
| _Roll_DEC | 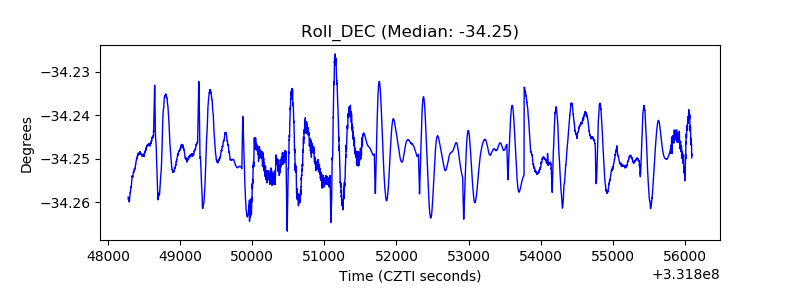 |
| _Roll_RA | 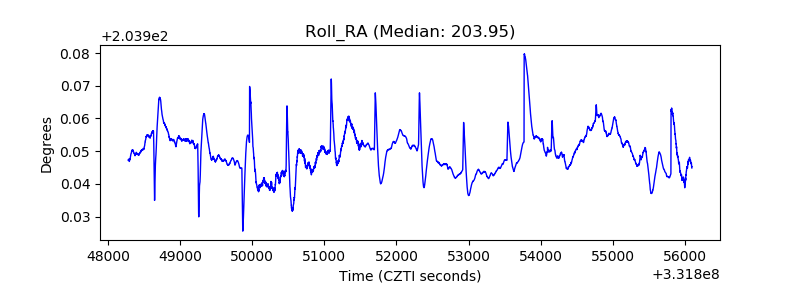 |
| Veto Counter | 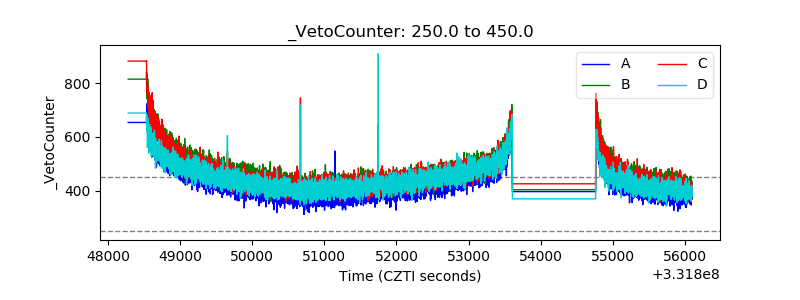 |