| Param | Original file | Final file |
|---|---|---|
| Filename | modeM0/AS1A07_068T01_9000003756_25827cztM0_level2.evt | modeM0/AS1A07_068T01_9000003756_25827cztM0_level2_quad_clean.evt |
| Size (bytes) | 2,397,216,960 | 416,750,400 |
| Size | 2.2 GB | 397.4 MB |
| Events in quadrant A | 15,913,194 | 2,709,644 |
| Events in quadrant B | 16,377,265 | 2,720,235 |
| Events in quadrant C | 16,160,106 | 2,545,668 |
| Events in quadrant D | 21,988,537 | 2,446,059 |
| Mode M0 | |||
|---|---|---|---|
| Quadrant | BADHDUFLAG | Total packets | Discarded packets |
| A | 0 | 67467 | 0 |
| B | 0 | 68671 | 0 |
| C | 0 | 68354 | 0 |
| D | 0 | 86777 | 0 |
| Mode M9 | |||
|---|---|---|---|
| Quadrant | BADHDUFLAG | Total packets | Discarded packets |
| A | 0 | 62 | 0 |
| B | 0 | 62 | 0 |
| C | 0 | 62 | 0 |
| D | 0 | 62 | 0 |
| Quadrant | Total seconds | Saturated seconds | Saturation percentage |
|---|---|---|---|
| A | 32016 | 199 | 0.621564% |
| B | 32017 | 312 | 0.974482% |
| C | 32017 | 402 | 1.255583% |
| D | 32016 | 2092 | 6.534233% |
Noise dominated data is calculated using 1-second bins in cleaned event files. If a bin has >2000 counts, and if more than 50% of those come from <1% of pixels, then it is considered to be noise-dominated and hence unusable.
| Quadrant | # 1 sec bins | Bins with >0 counts | Bins with >2000 counts | High rate bins dominated by noise | Noise dominated (total time) | Noise dominated (detector-on time) | Marked lightcurve |
|---|---|---|---|---|---|---|---|
| A | 38410 | 32020 | 2 | 2 | 0.01% | 0.01% | 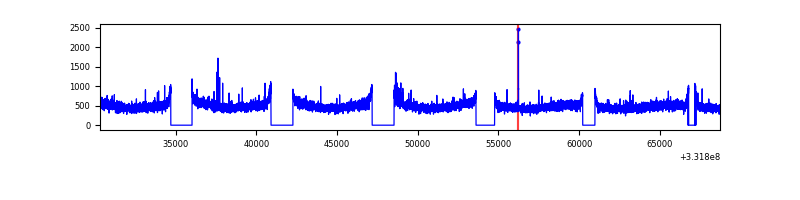 |
| B | 38411 | 32024 | 23 | 23 | 0.06% | 0.07% | 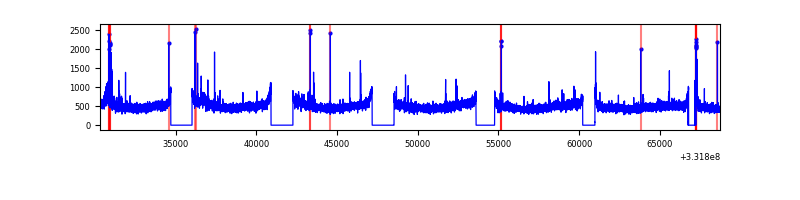 |
| C | 38411 | 32023 | 2 | 2 | 0.01% | 0.01% | 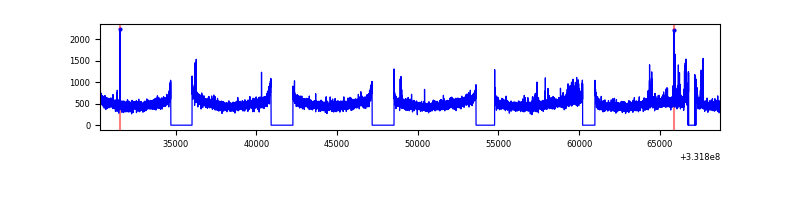 |
| D | 38410 | 32022 | 2063 | 2063 | 5.37% | 6.44% | 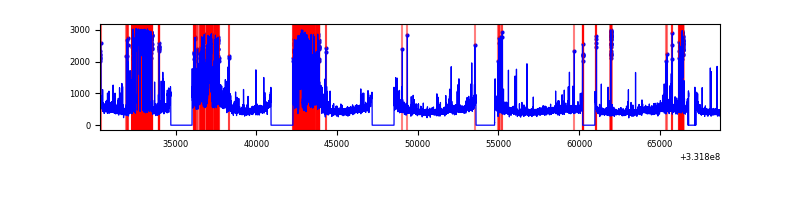 |
Top three noisy pixels from each quadrant. If the there are fewer than three noisy pixels in the level2.evt file, extra rows are filled as -1
| Pixel properties | Quadrant properties | ||||||
|---|---|---|---|---|---|---|---|
| Quadrant | DetID | PixID | Counts | Sigma | Mean | Median | Sigma |
| A | 0 | 13 | 142628 | 171.27 | 4088 | 4020 | 809.3 |
| A | 13 | 254 | 46832 | 52.9 | 4088 | 4020 | 809.3 |
| A | 3 | 137 | 37184 | 40.98 | 4088 | 4020 | 809.3 |
| B | 15 | 33 | 239112 | 310.94 | 4038 | 3954 | 756.3 |
| B | 0 | 219 | 182006 | 235.43 | 4038 | 3954 | 756.3 |
| B | 12 | 111 | 92712 | 117.36 | 4038 | 3954 | 756.3 |
| C | 14 | 238 | 621231 | 693.4 | 3842 | 3862 | 890.3 |
| C | 3 | 233 | 523154 | 583.25 | 3842 | 3862 | 890.3 |
| C | 7 | 238 | 32377 | 32.03 | 3842 | 3862 | 890.3 |
| D | 7 | 80 | 3184883 | 3559.22 | 3769 | 3679 | 893.8 |
| D | 7 | 223 | 2611290 | 2917.47 | 3769 | 3679 | 893.8 |
| D | 12 | 233 | 1139416 | 1270.7 | 3769 | 3679 | 893.8 |
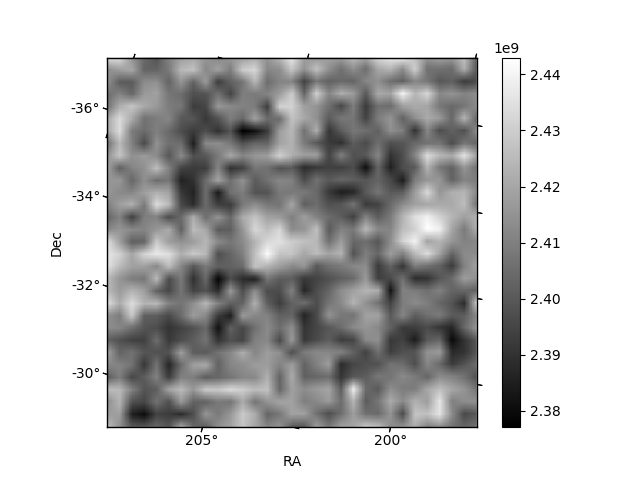
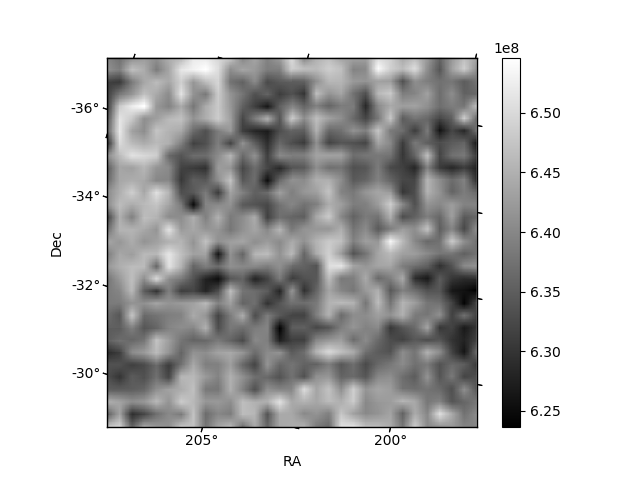
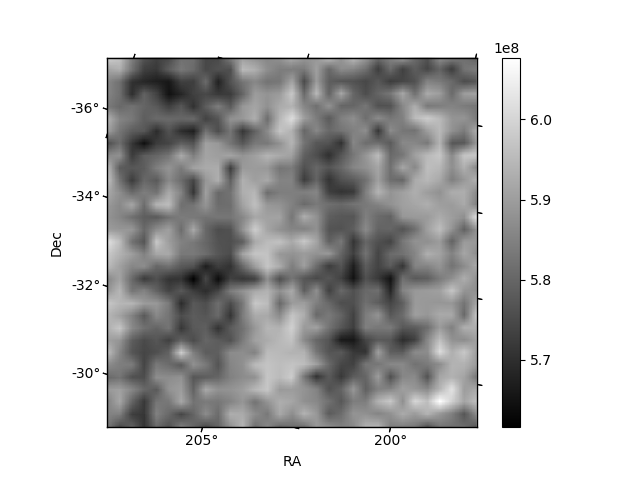
Histogram calculated using DETX and DETY for each event in the final _common_clean file
| Quadrant A | 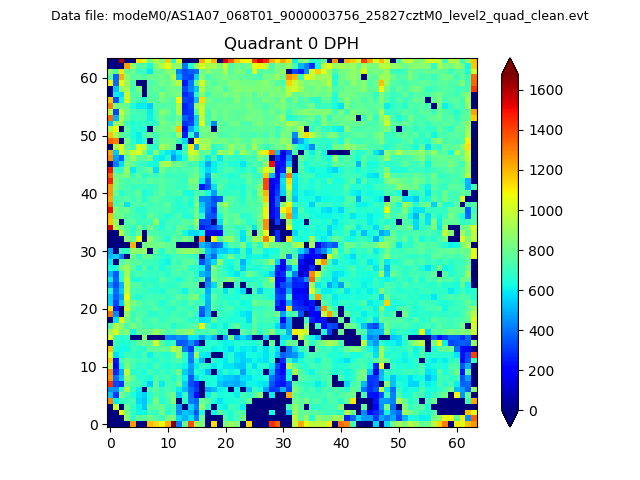 |
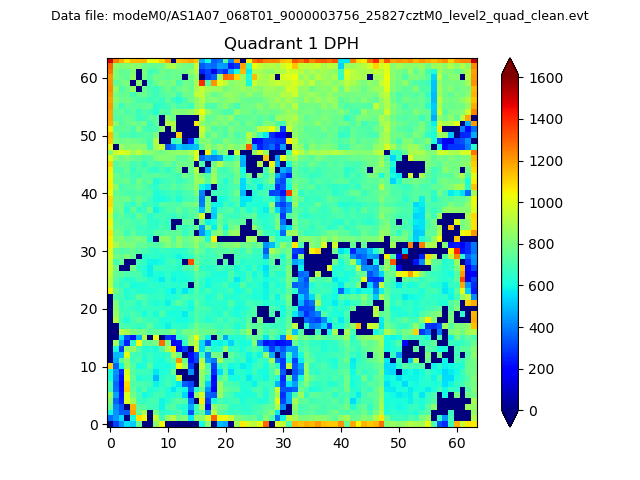 |
Quadrant B |
|---|---|---|---|
| Quadrant D |  |
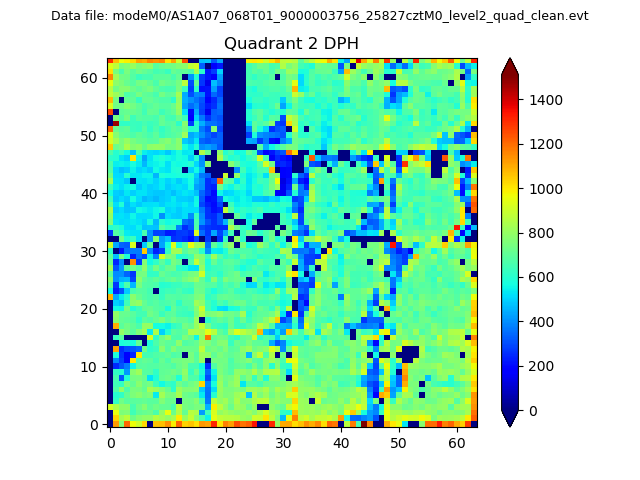 |
Quadrant C |
| Plot type | Count rate plots | Images |
|---|---|---|
| Comparison with Poisson distribution Blue bars denote a histogram of data divided into 1 sec bins. Red curve is a Poisson curve with rate = median count rate of data. |
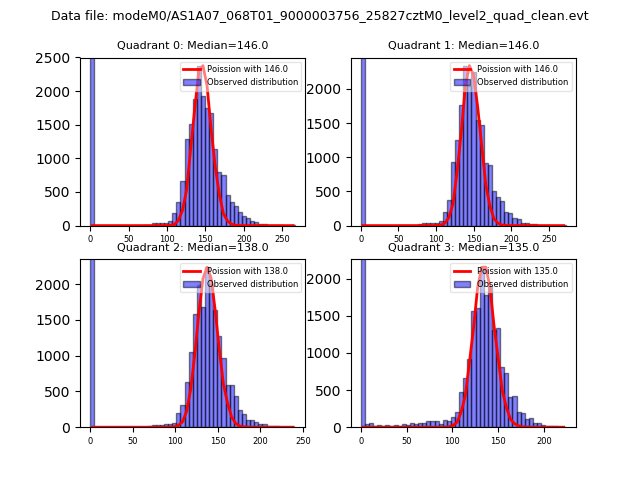 |
 |
| Quadrant-wise count rates Data is divided into 100 sec bins |
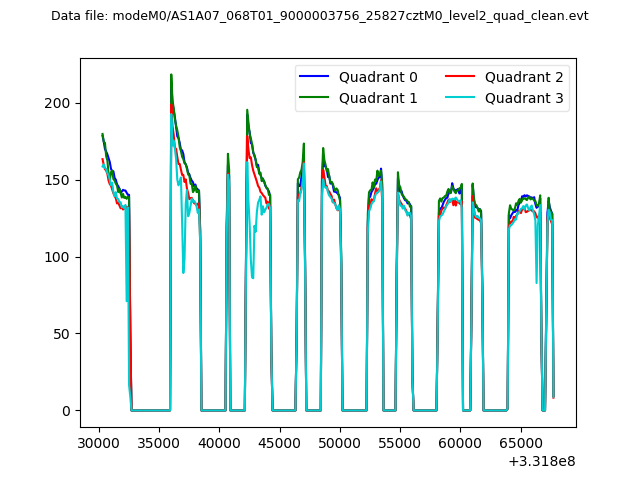 |
|
| Module-wise count rates for Quadrant A Data is divided into 100 sec bins |
 |
 |
| Module-wise count rates for Quadrant B Data is divided into 100 sec bins |
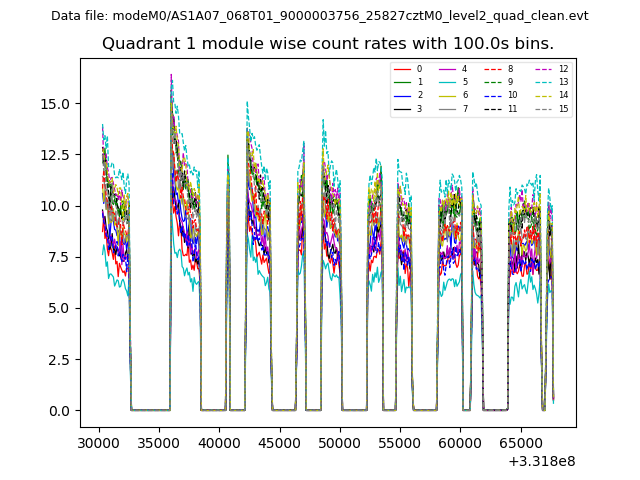 |
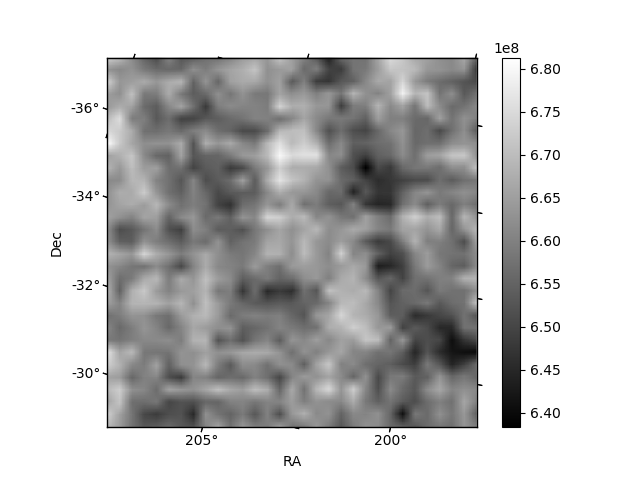 |
| Module-wise count rates for Quadrant C Data is divided into 100 sec bins |
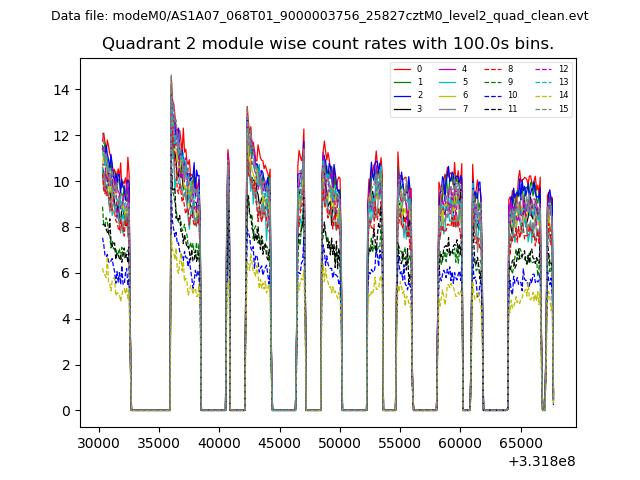 |
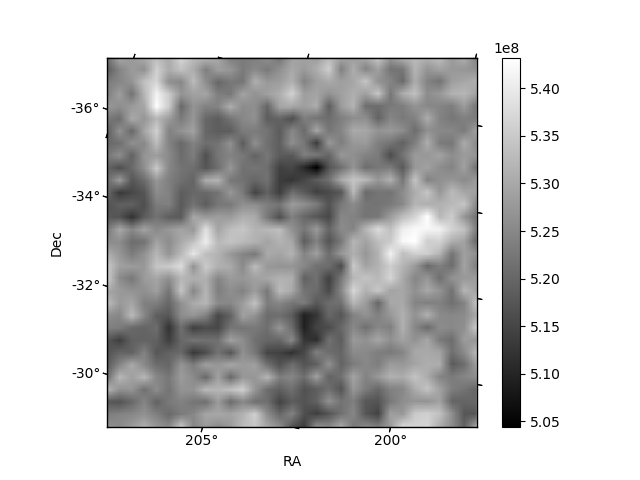 |
| Module-wise count rates for Quadrant D Data is divided into 100 sec bins |
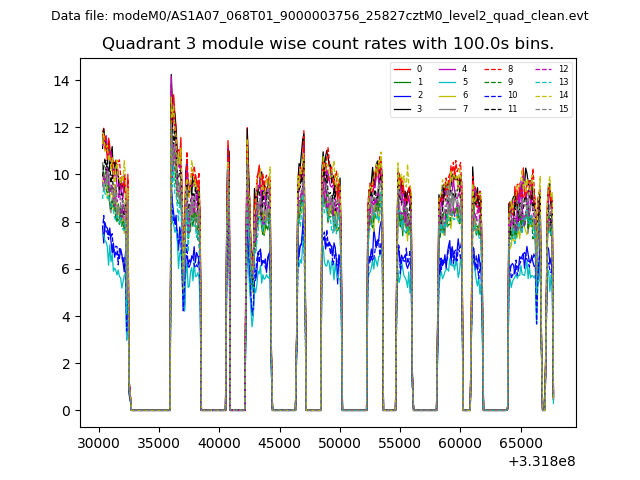 |
 |
| Parameter | Plot |
|---|---|
| CZT HV Monitor | 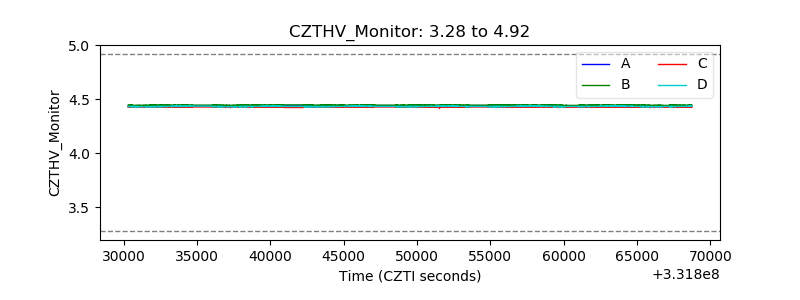 |
| D_VDD | 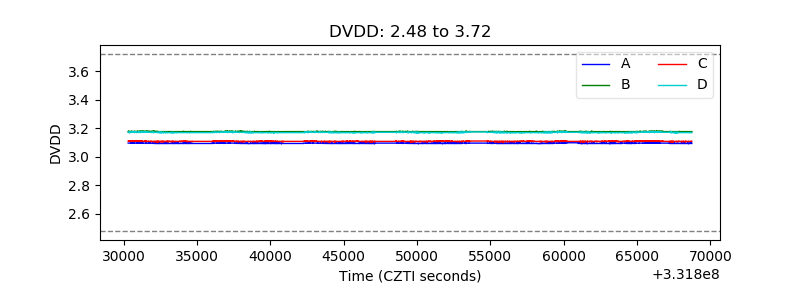 |
| Temperature 1 | 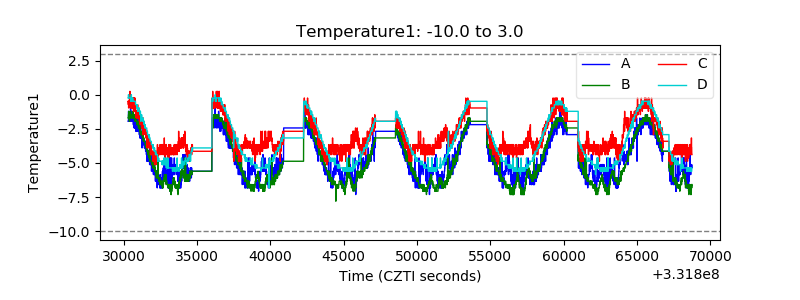 |
| Veto HV Monitor | 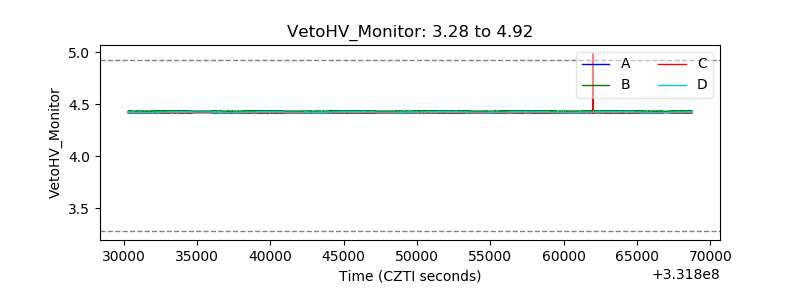 |
| Veto LLD | 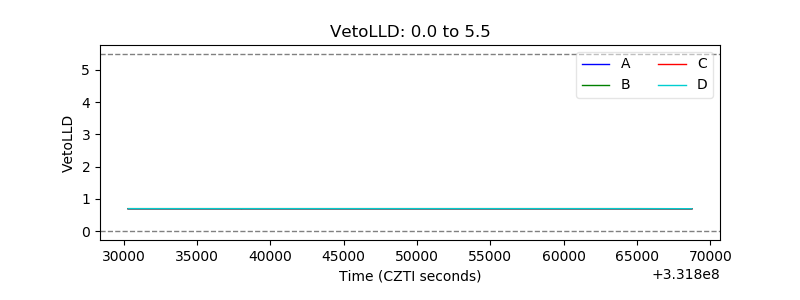 |
| Alpha Counter | 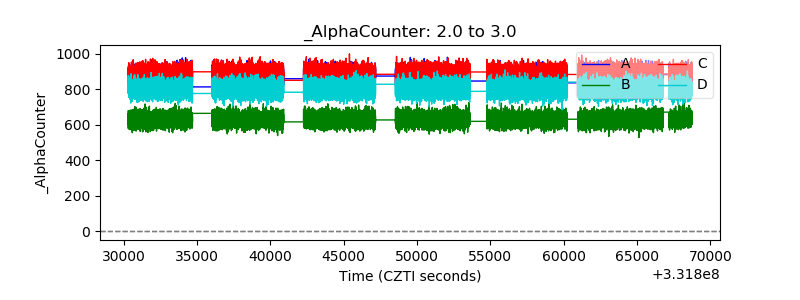 |
| _CPM_Rate | 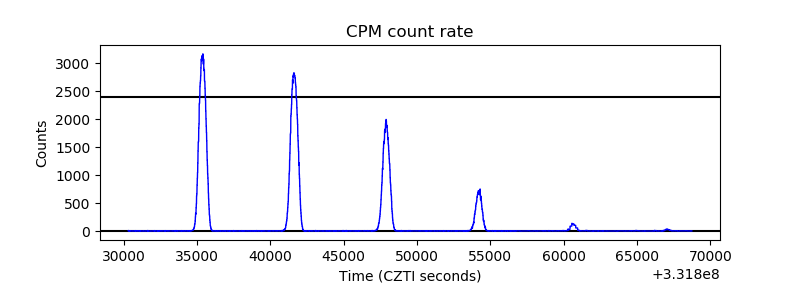 |
| CZT Counter | 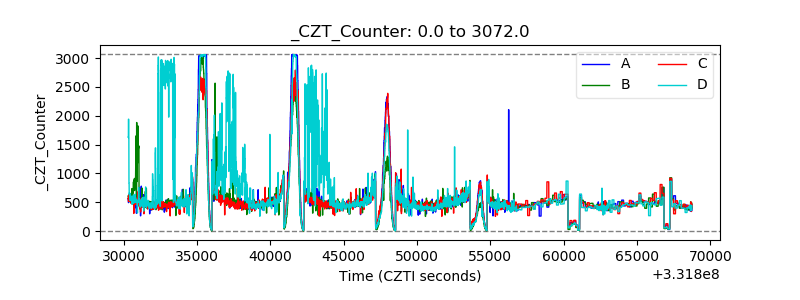 |
| +2.5 Volts monitor |  |
| +5 Volts monitor | 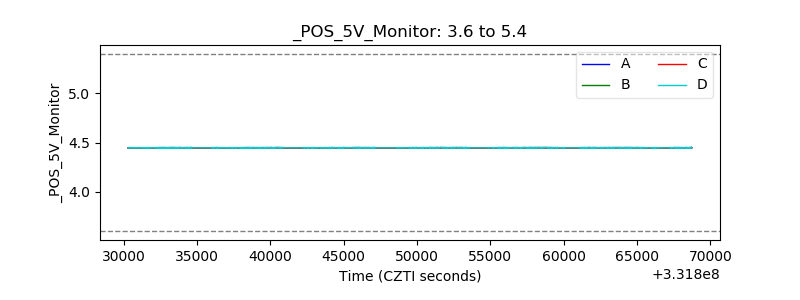 |
| _ROLL_ROT | 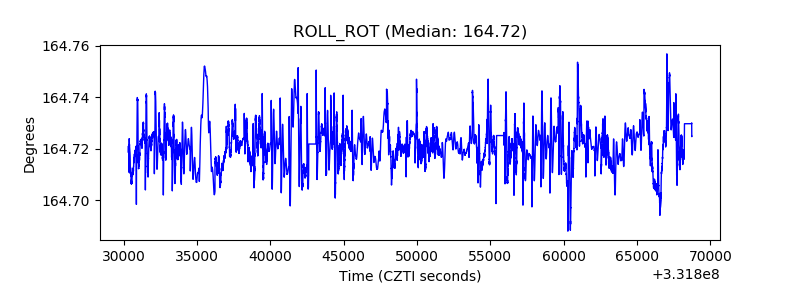 |
| _Roll_DEC | 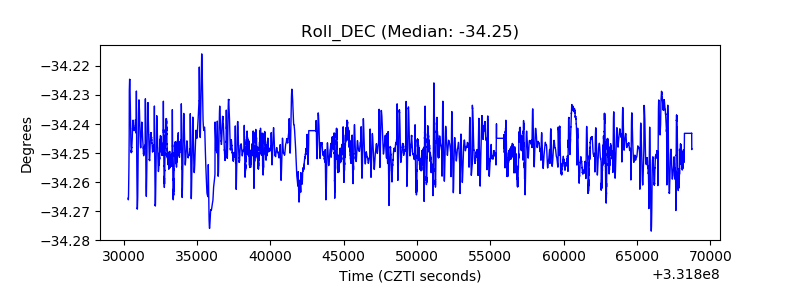 |
| _Roll_RA |  |
| Veto Counter | 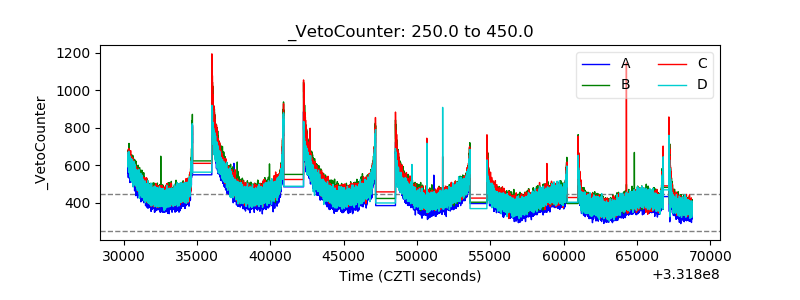 |