| Param | Original file | Final file |
|---|---|---|
| Filename | modeM0/AS1A07_068T01_9000003756_25828cztM0_level2.evt | modeM0/AS1A07_068T01_9000003756_25828cztM0_level2_quad_clean.evt |
| Size (bytes) | 512,147,520 | 77,754,240 |
| Size | 488.4 MB | 74.2 MB |
| Events in quadrant A | 3,385,996 | 480,224 |
| Events in quadrant B | 3,494,369 | 481,703 |
| Events in quadrant C | 3,968,690 | 451,665 |
| Events in quadrant D | 4,170,389 | 437,301 |
| Mode M0 | |||
|---|---|---|---|
| Quadrant | BADHDUFLAG | Total packets | Discarded packets |
| A | 0 | 14845 | 0 |
| B | 0 | 14990 | 0 |
| C | 0 | 16435 | 0 |
| D | 0 | 17476 | 0 |
| Mode M9 | |||
|---|---|---|---|
| Quadrant | BADHDUFLAG | Total packets | Discarded packets |
| A | 0 | 2 | 0 |
| B | 0 | 2 | 0 |
| C | 0 | 2 | 0 |
| D | 0 | 2 | 0 |
| Quadrant | Total seconds | Saturated seconds | Saturation percentage |
|---|---|---|---|
| A | 7222 | 87 | 1.204652% |
| B | 7223 | 117 | 1.619826% |
| C | 7223 | 179 | 2.478195% |
| D | 7223 | 332 | 4.596428% |
Noise dominated data is calculated using 1-second bins in cleaned event files. If a bin has >2000 counts, and if more than 50% of those come from <1% of pixels, then it is considered to be noise-dominated and hence unusable.
| Quadrant | # 1 sec bins | Bins with >0 counts | Bins with >2000 counts | High rate bins dominated by noise | Noise dominated (total time) | Noise dominated (detector-on time) | Marked lightcurve |
|---|---|---|---|---|---|---|---|
| A | 7492 | 7223 | 0 | 0 | 0.00% | 0.00% |  |
| B | 7493 | 7224 | 1 | 1 | 0.01% | 0.01% |  |
| C | 7493 | 7224 | 26 | 26 | 0.35% | 0.36% |  |
| D | 7493 | 7224 | 261 | 261 | 3.48% | 3.61% |  |
Top three noisy pixels from each quadrant. If the there are fewer than three noisy pixels in the level2.evt file, extra rows are filled as -1
| Pixel properties | Quadrant properties | ||||||
|---|---|---|---|---|---|---|---|
| Quadrant | DetID | PixID | Counts | Sigma | Mean | Median | Sigma |
| A | 13 | 254 | 10180 | 52.48 | 877 | 858 | 177.6 |
| A | 3 | 137 | 8460 | 42.79 | 877 | 858 | 177.6 |
| A | 0 | 226 | 7484 | 37.3 | 877 | 858 | 177.6 |
| B | 0 | 219 | 68984 | 401.02 | 871 | 848 | 169.9 |
| B | 12 | 111 | 21154 | 119.51 | 871 | 848 | 169.9 |
| B | 11 | 111 | 18749 | 105.36 | 871 | 848 | 169.9 |
| C | 3 | 233 | 554424 | 2789.58 | 831 | 837 | 198.4 |
| C | 14 | 238 | 130083 | 651.28 | 831 | 837 | 198.4 |
| C | 7 | 238 | 41834 | 206.59 | 831 | 837 | 198.4 |
| D | 1 | 52 | 796963 | 3978.31 | 826 | 803 | 200.1 |
| D | 12 | 233 | 149889 | 744.96 | 826 | 803 | 200.1 |
| D | 1 | 3 | 62068 | 306.13 | 826 | 803 | 200.1 |
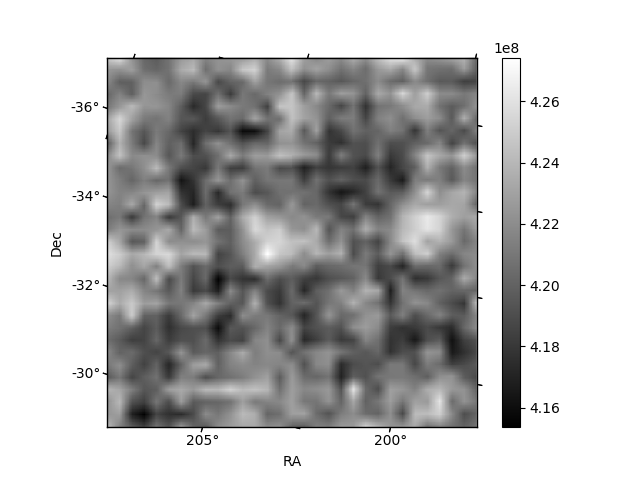
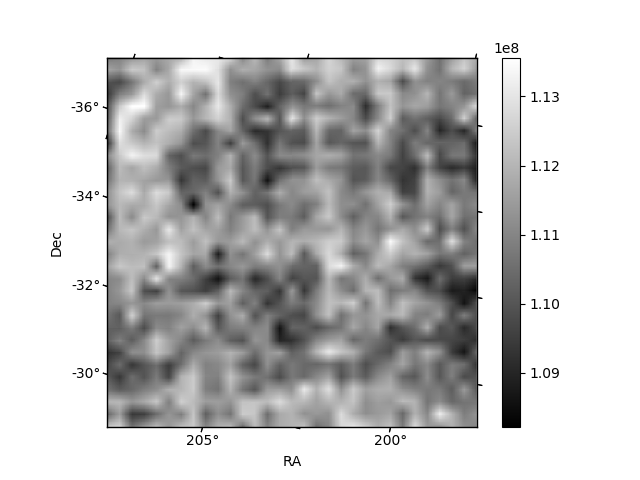
Histogram calculated using DETX and DETY for each event in the final _common_clean file
| Quadrant A | 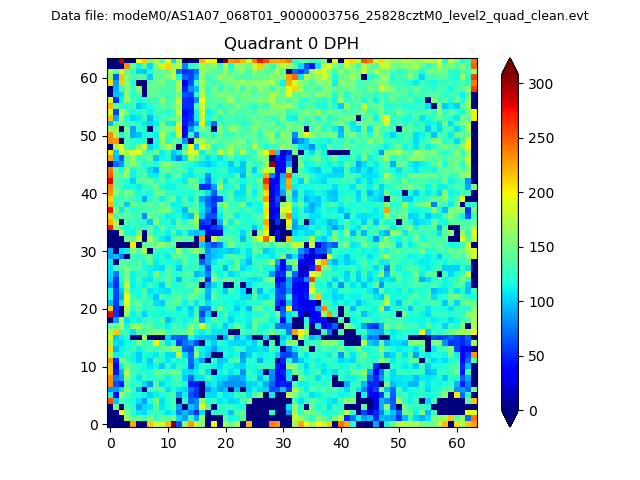 |
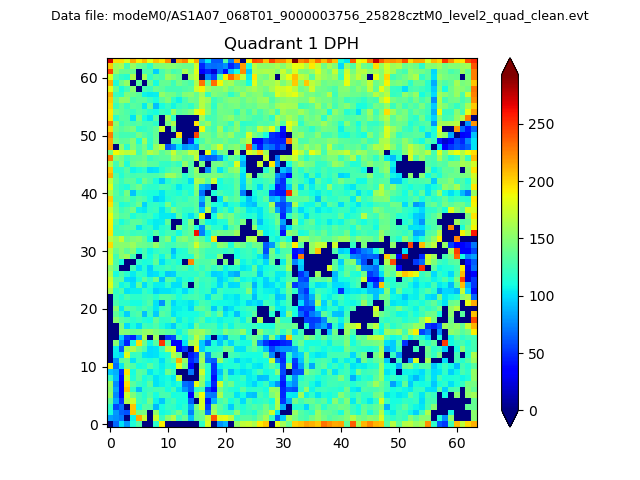 |
Quadrant B |
|---|---|---|---|
| Quadrant D | 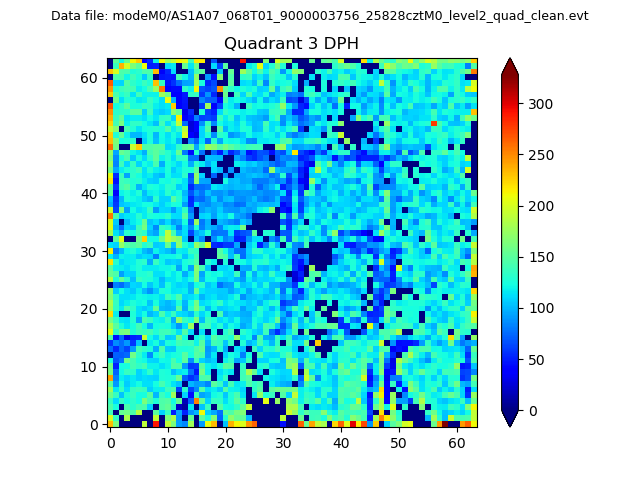 |
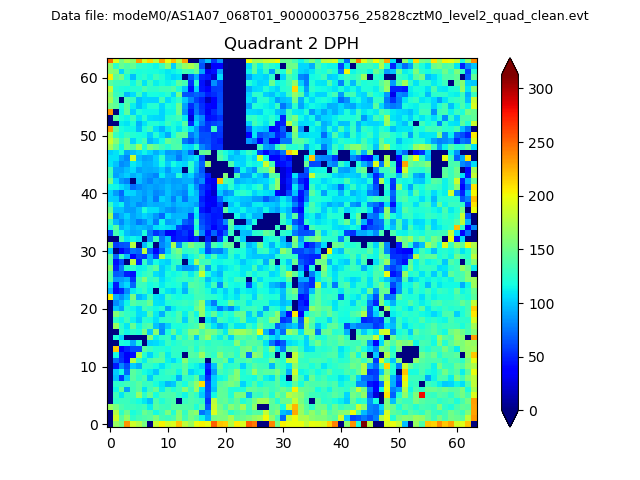 |
Quadrant C |
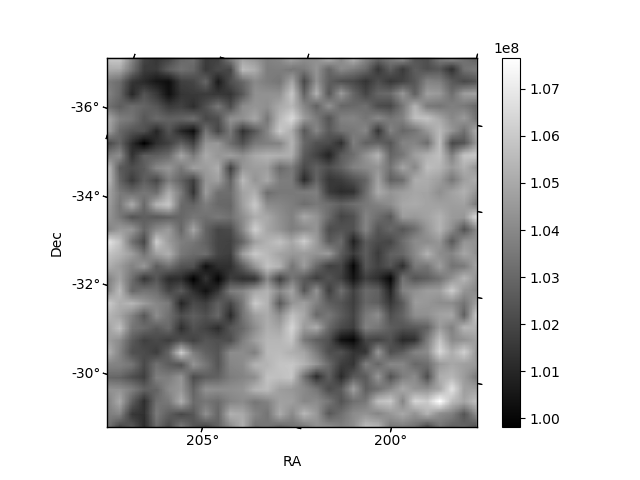
| Plot type | Count rate plots | Images |
|---|---|---|
| Comparison with Poisson distribution Blue bars denote a histogram of data divided into 1 sec bins. Red curve is a Poisson curve with rate = median count rate of data. |
 |
 |
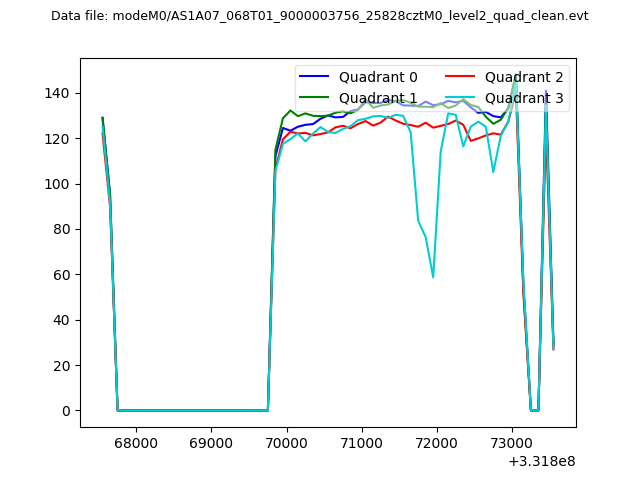
| Quadrant-wise count rates Data is divided into 100 sec bins |
 |
|
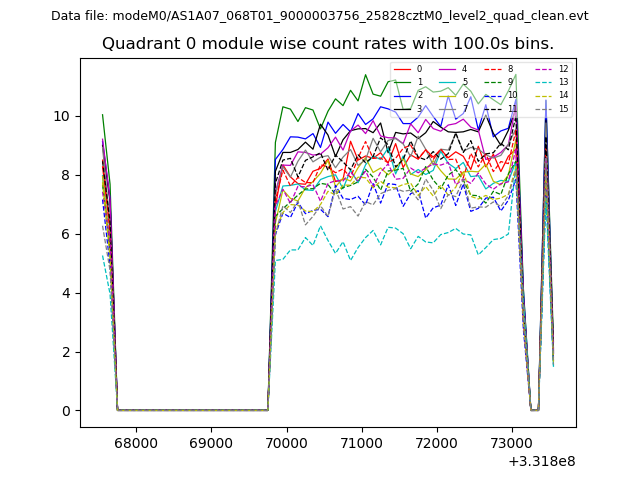
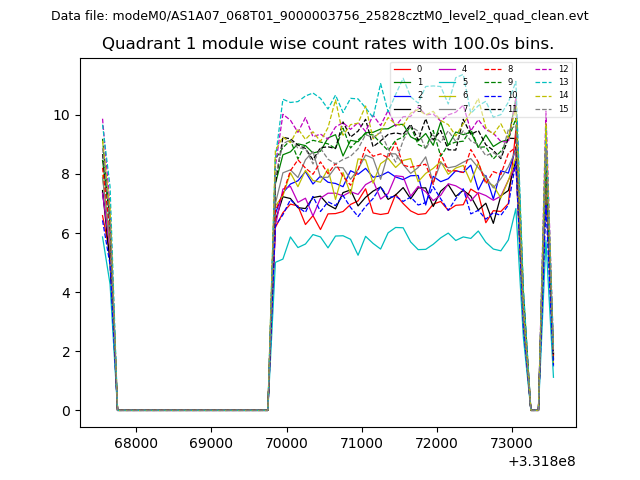
| Module-wise count rates for Quadrant A Data is divided into 100 sec bins |
 |
 |
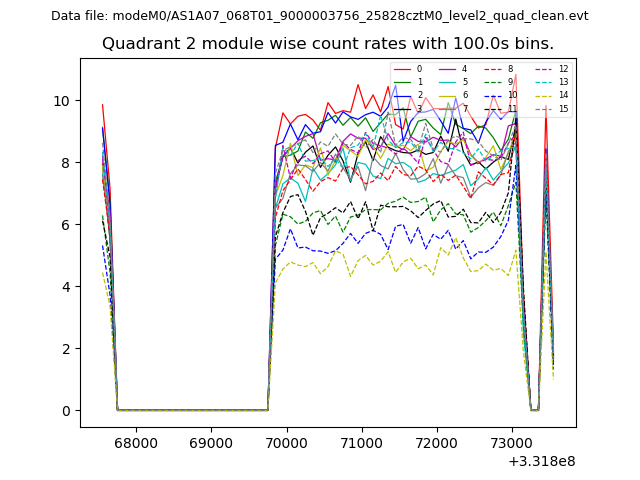
| Module-wise count rates for Quadrant B Data is divided into 100 sec bins |
 |
 |
| Module-wise count rates for Quadrant C Data is divided into 100 sec bins |
 |
 |
| Module-wise count rates for Quadrant D Data is divided into 100 sec bins |
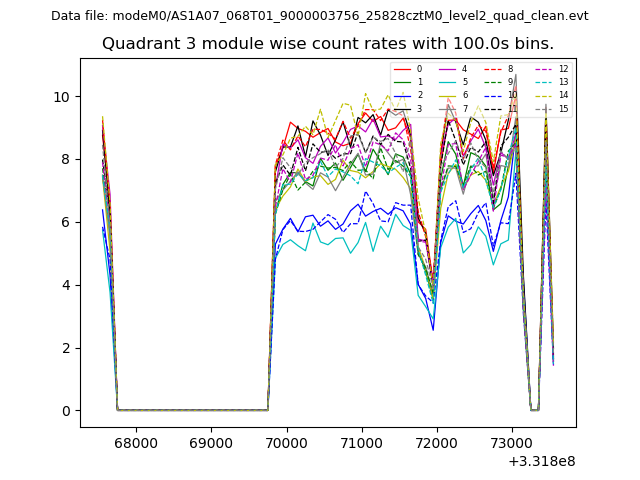 |
 |
| Parameter | Plot |
|---|---|
| CZT HV Monitor | 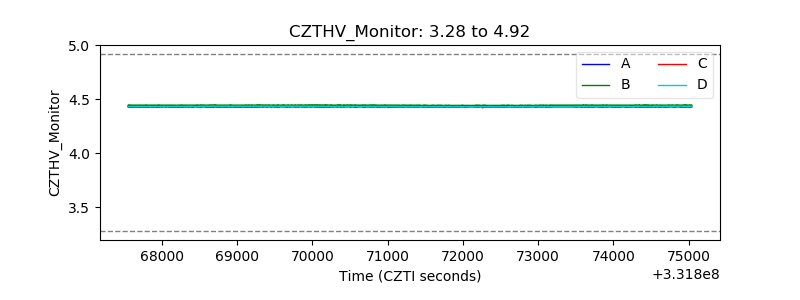 |
| D_VDD | 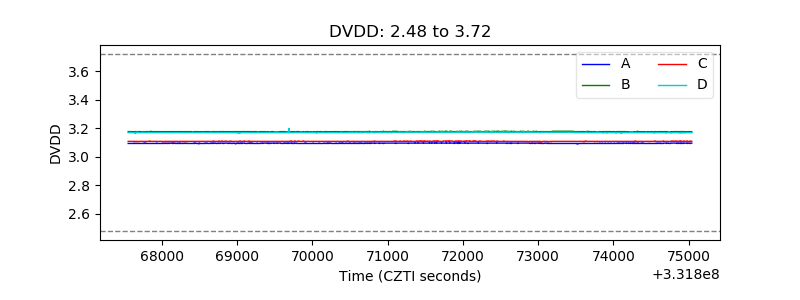 |
| Temperature 1 | 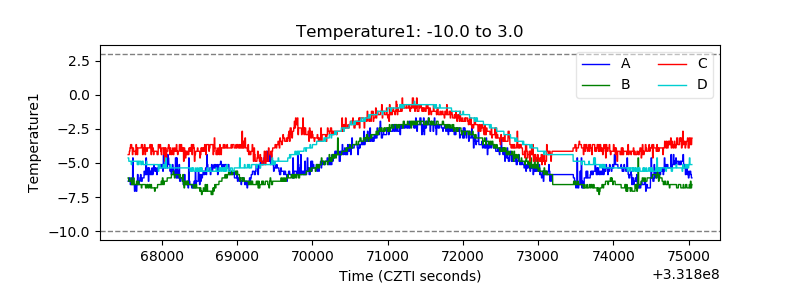 |
| Veto HV Monitor | 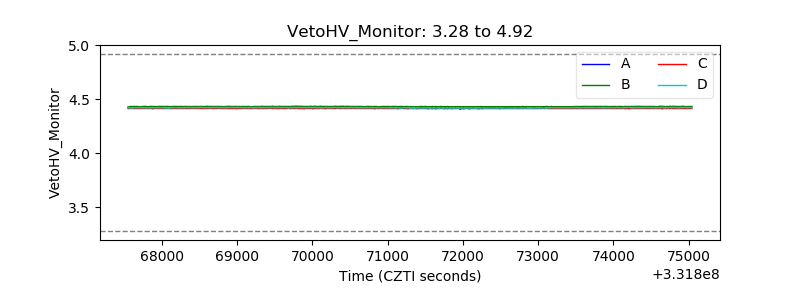 |
| Veto LLD | 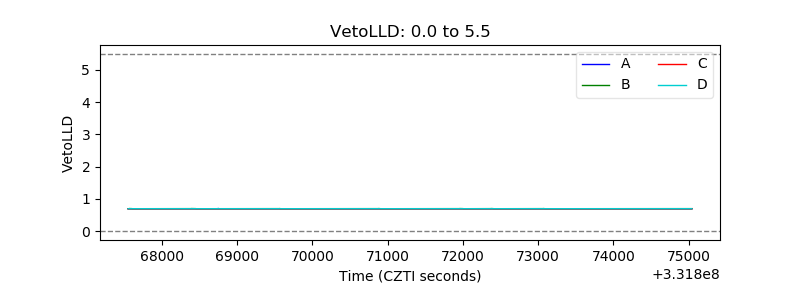 |
| Alpha Counter | 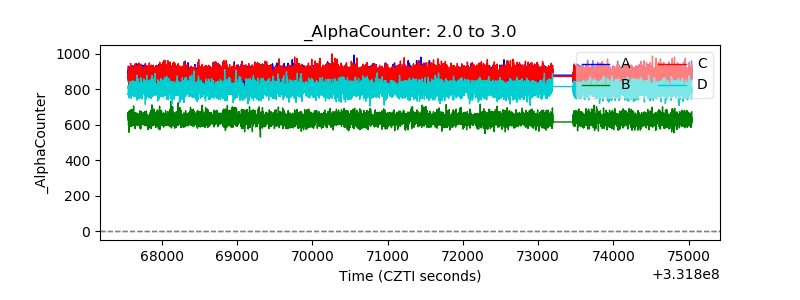 |
| _CPM_Rate |  |
| CZT Counter | 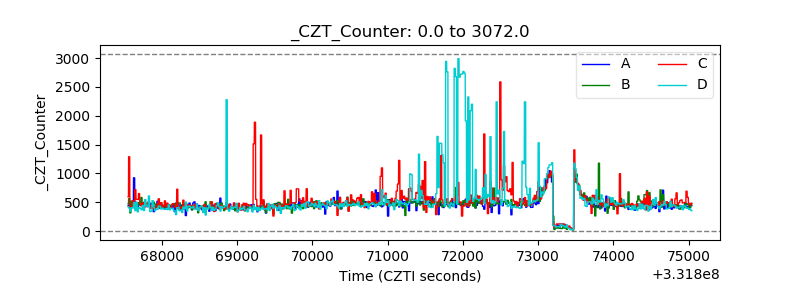 |
| +2.5 Volts monitor |  |
| +5 Volts monitor |  |
| _ROLL_ROT | 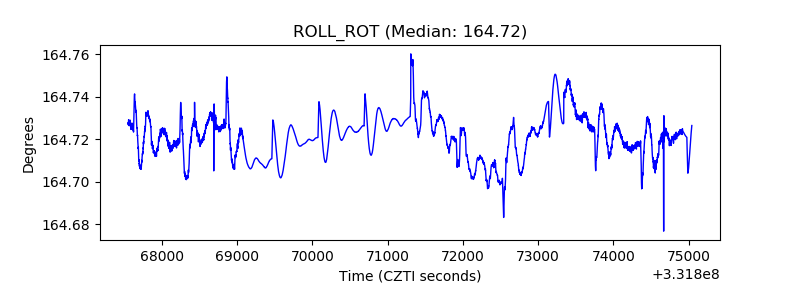 |
| _Roll_DEC | 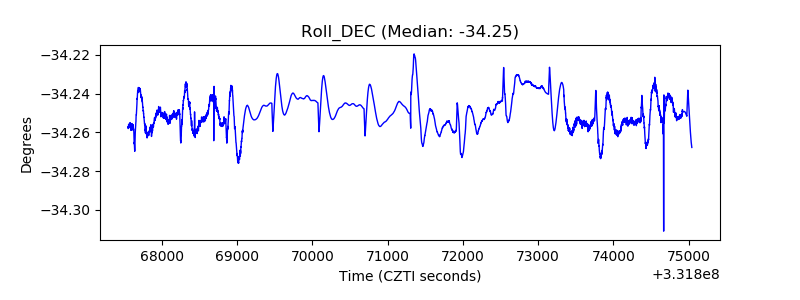 |
| _Roll_RA | 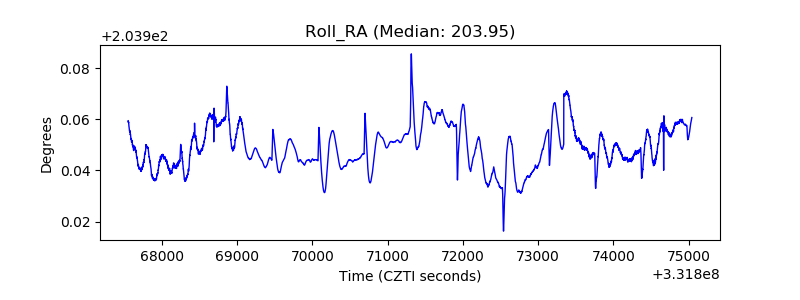 |
| Veto Counter | 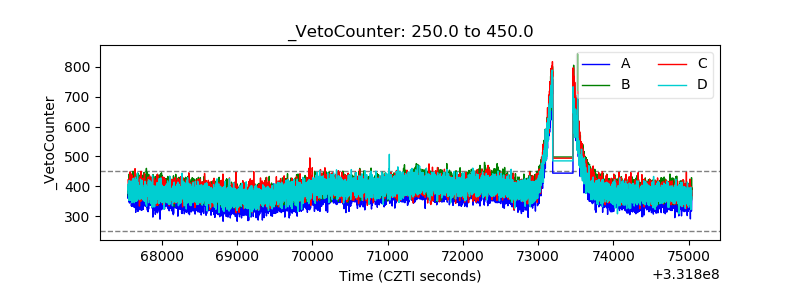 |