| Param | Original file | Final file |
|---|---|---|
| Filename | modeM0/AS1A07_068T01_9000003756_25831cztM0_level2.evt | modeM0/AS1A07_068T01_9000003756_25831cztM0_level2_quad_clean.evt |
| Size (bytes) | 1,320,258,240 | 236,551,680 |
| Size | 1.2 GB | 225.6 MB |
| Events in quadrant A | 8,653,528 | 1,522,037 |
| Events in quadrant B | 8,870,208 | 1,528,060 |
| Events in quadrant C | 8,936,387 | 1,448,274 |
| Events in quadrant D | 12,286,684 | 1,404,321 |
| Mode M0 | |||
|---|---|---|---|
| Quadrant | BADHDUFLAG | Total packets | Discarded packets |
| A | 0 | 37305 | 0 |
| B | 0 | 37566 | 0 |
| C | 0 | 37874 | 0 |
| D | 0 | 48792 | 0 |
| Mode M9 | |||
|---|---|---|---|
| Quadrant | BADHDUFLAG | Total packets | Discarded packets |
| A | 0 | 18 | 0 |
| B | 0 | 18 | 0 |
| C | 0 | 18 | 0 |
| D | 0 | 18 | 0 |
| Quadrant | Total seconds | Saturated seconds | Saturation percentage |
|---|---|---|---|
| A | 18303 | 166 | 0.906955% |
| B | 18304 | 221 | 1.207386% |
| C | 18304 | 313 | 1.710009% |
| D | 18304 | 1102 | 6.020542% |
Noise dominated data is calculated using 1-second bins in cleaned event files. If a bin has >2000 counts, and if more than 50% of those come from <1% of pixels, then it is considered to be noise-dominated and hence unusable.
| Quadrant | # 1 sec bins | Bins with >0 counts | Bins with >2000 counts | High rate bins dominated by noise | Noise dominated (total time) | Noise dominated (detector-on time) | Marked lightcurve |
|---|---|---|---|---|---|---|---|
| A | 20038 | 18306 | 0 | 0 | 0.00% | 0.00% | 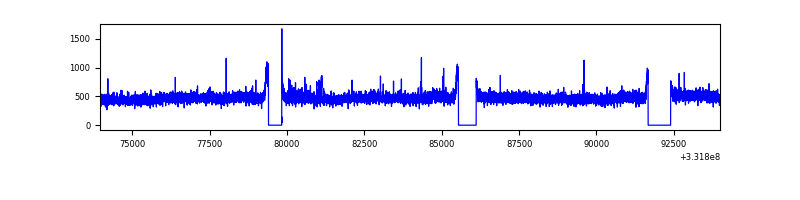 |
| B | 20039 | 18307 | 7 | 7 | 0.03% | 0.04% | 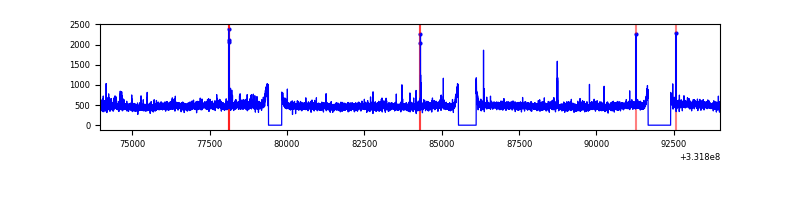 |
| C | 20039 | 18307 | 5 | 5 | 0.02% | 0.03% | 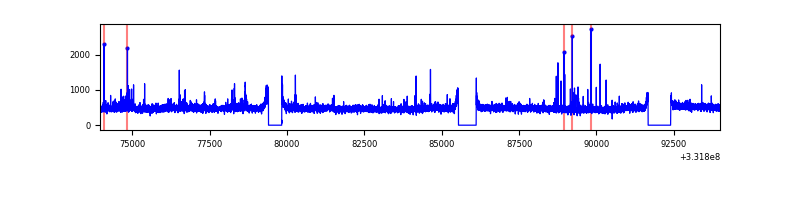 |
| D | 20039 | 18307 | 1033 | 1033 | 5.15% | 5.64% | 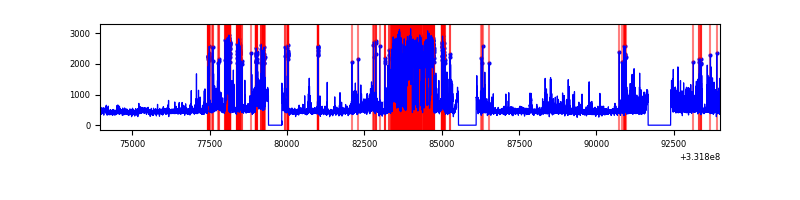 |
Top three noisy pixels from each quadrant. If the there are fewer than three noisy pixels in the level2.evt file, extra rows are filled as -1
| Pixel properties | Quadrant properties | ||||||
|---|---|---|---|---|---|---|---|
| Quadrant | DetID | PixID | Counts | Sigma | Mean | Median | Sigma |
| A | 0 | 13 | 66323 | 144.56 | 2219 | 2175 | 443.7 |
| A | 6 | 16 | 33701 | 71.05 | 2219 | 2175 | 443.7 |
| A | 13 | 254 | 23440 | 47.92 | 2219 | 2175 | 443.7 |
| B | 0 | 219 | 172627 | 406.01 | 2197 | 2144 | 419.9 |
| B | 12 | 111 | 52872 | 120.81 | 2197 | 2144 | 419.9 |
| B | 11 | 111 | 47860 | 108.88 | 2197 | 2144 | 419.9 |
| C | 3 | 233 | 339878 | 680.26 | 2111 | 2120 | 496.5 |
| C | 14 | 238 | 339142 | 678.77 | 2111 | 2120 | 496.5 |
| C | 7 | 238 | 29873 | 55.9 | 2111 | 2120 | 496.5 |
| D | 1 | 52 | 3804072 | 7625.66 | 2104 | 2052 | 498.6 |
| D | 12 | 233 | 366398 | 730.76 | 2104 | 2052 | 498.6 |
| D | 2 | 234 | 75455 | 147.22 | 2104 | 2052 | 498.6 |
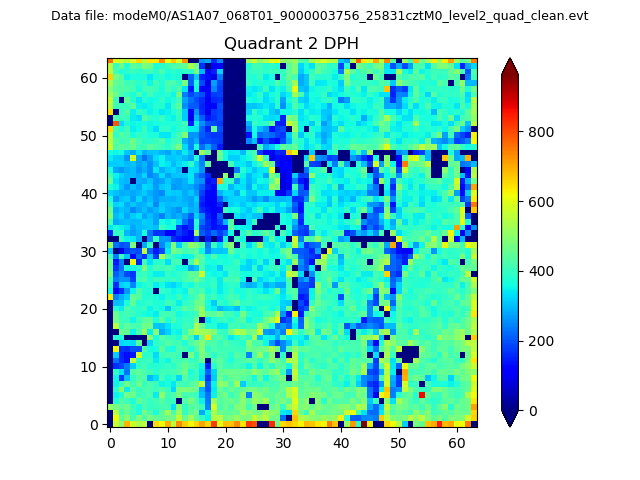
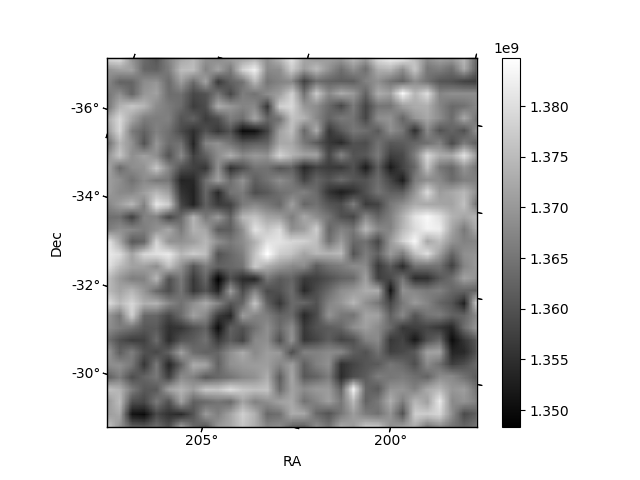
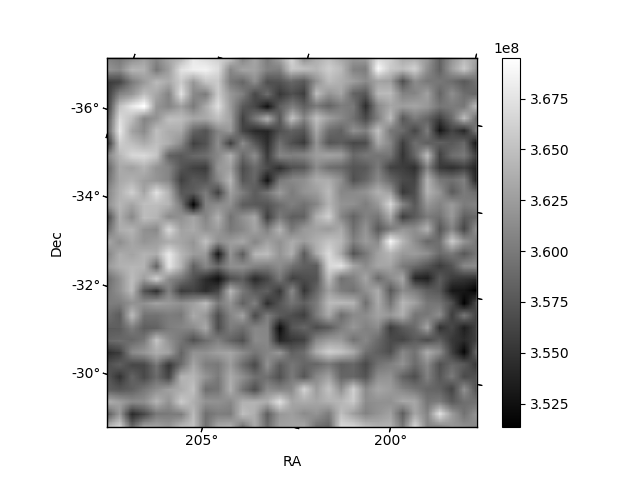
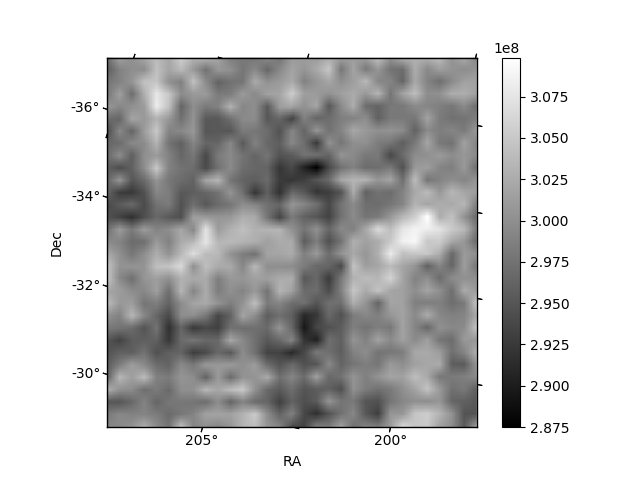
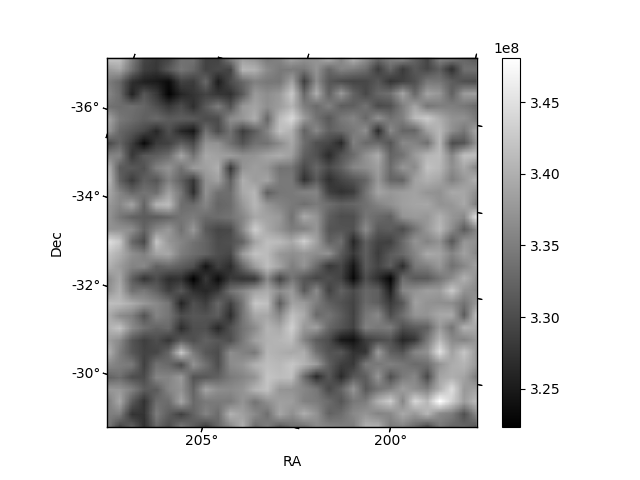
Histogram calculated using DETX and DETY for each event in the final _common_clean file
| Quadrant A | 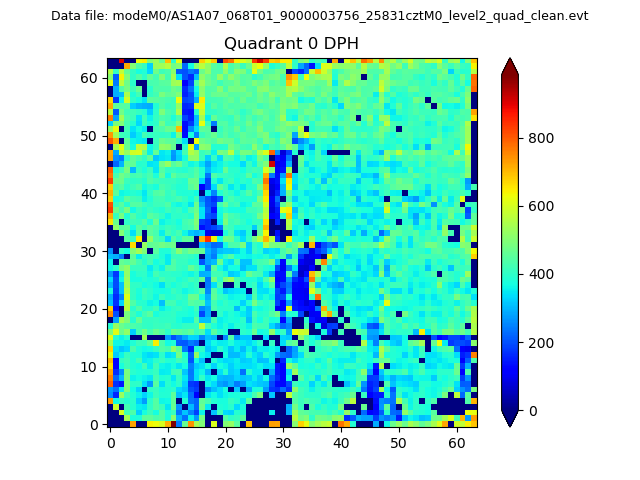 |
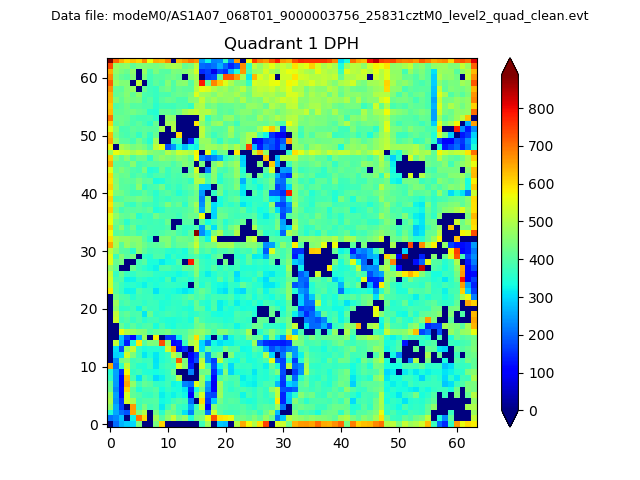 |
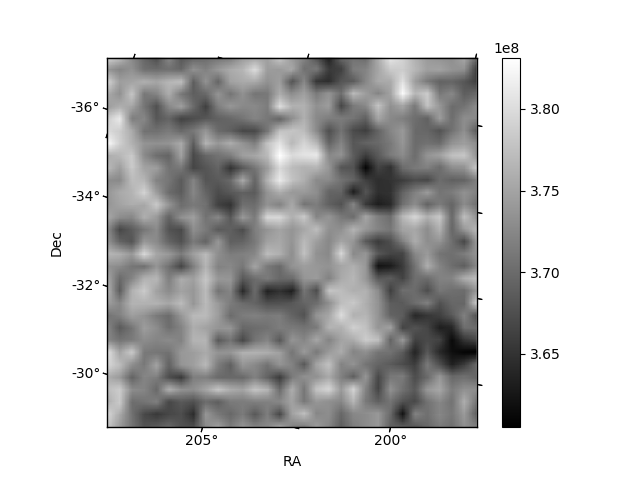
Quadrant B |
|---|---|---|---|
| Quadrant D | 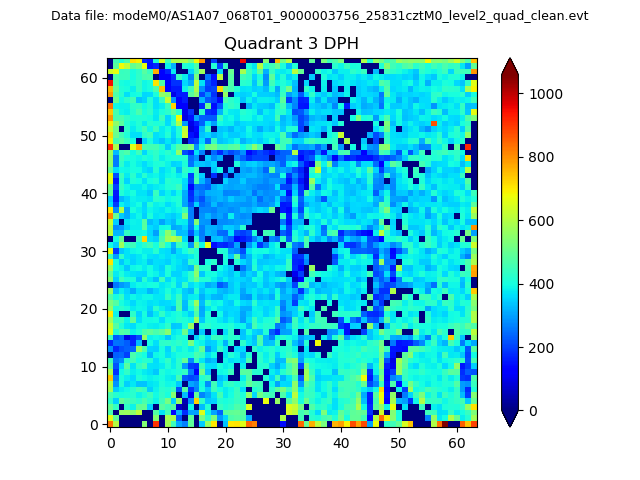 |
 |
Quadrant C |
| Plot type | Count rate plots | Images |
|---|---|---|
| Comparison with Poisson distribution Blue bars denote a histogram of data divided into 1 sec bins. Red curve is a Poisson curve with rate = median count rate of data. |
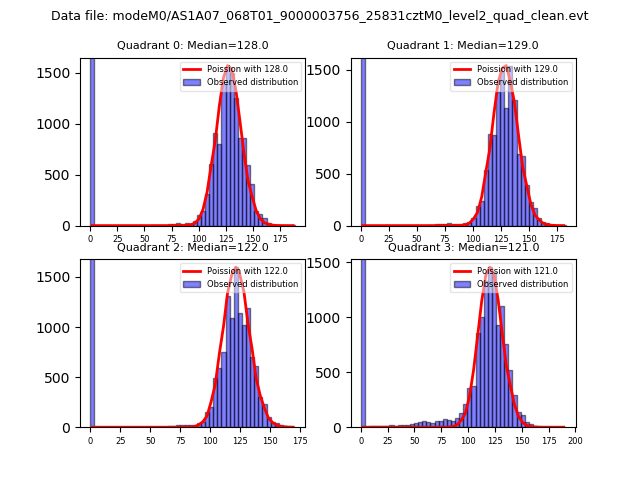 |
 |
| Quadrant-wise count rates Data is divided into 100 sec bins |
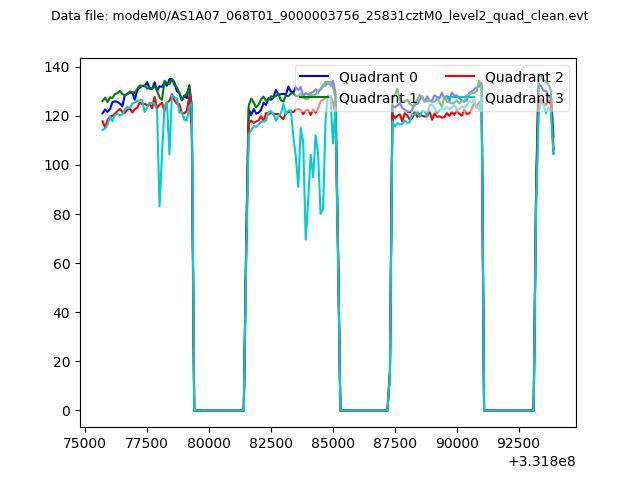 |
|
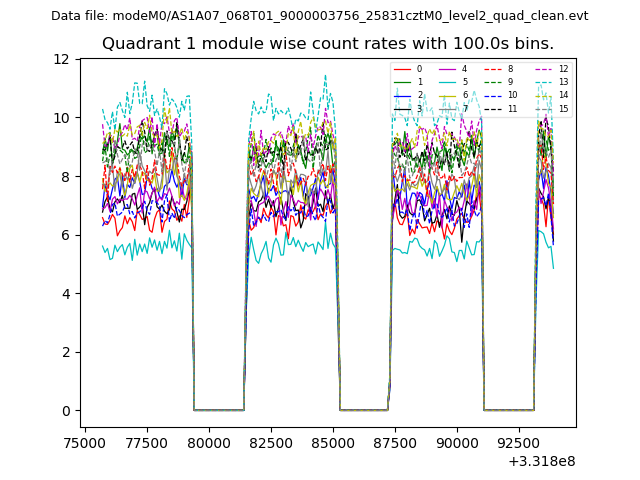
| Module-wise count rates for Quadrant A Data is divided into 100 sec bins |
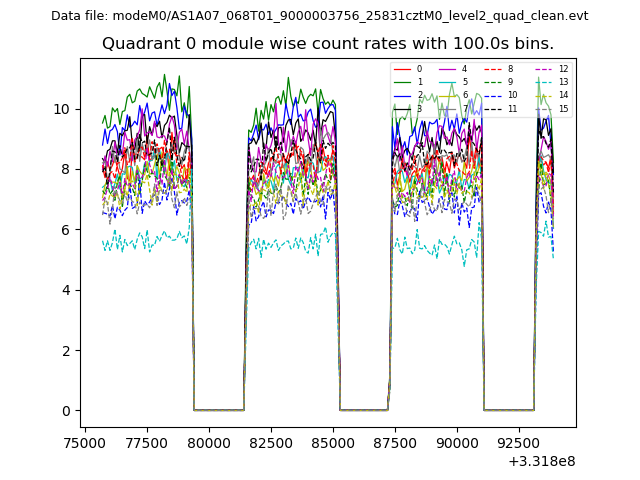 |
 |
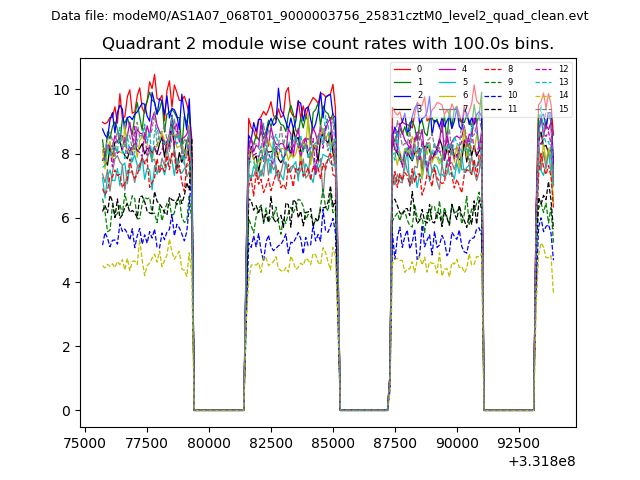
| Module-wise count rates for Quadrant B Data is divided into 100 sec bins |
 |
 |
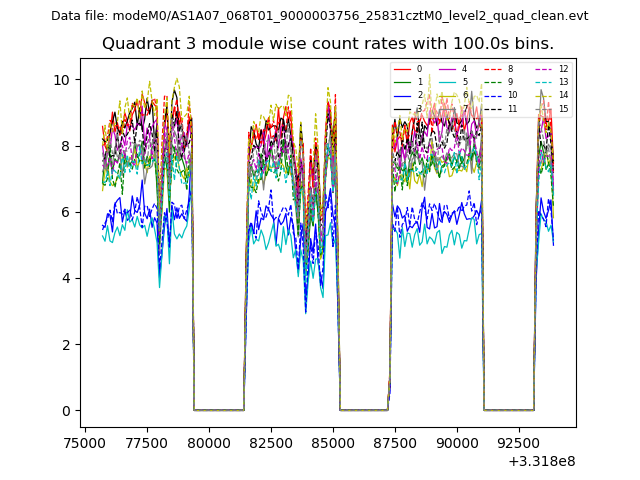
| Module-wise count rates for Quadrant C Data is divided into 100 sec bins |
 |
 |
| Module-wise count rates for Quadrant D Data is divided into 100 sec bins |
 |
 |
| Parameter | Plot |
|---|---|
| CZT HV Monitor | 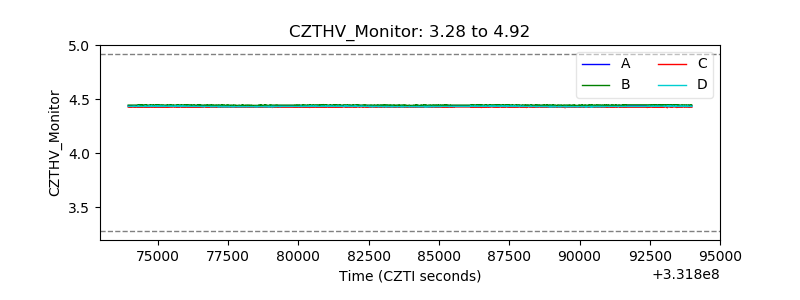 |
| D_VDD | 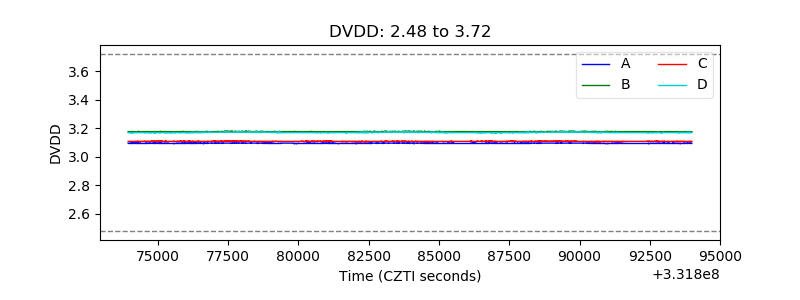 |
| Temperature 1 | 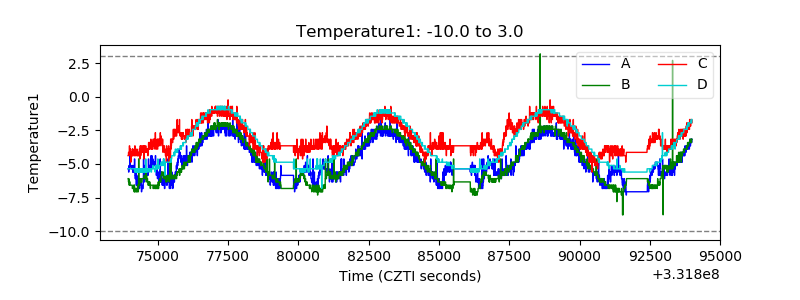 |
| Veto HV Monitor | 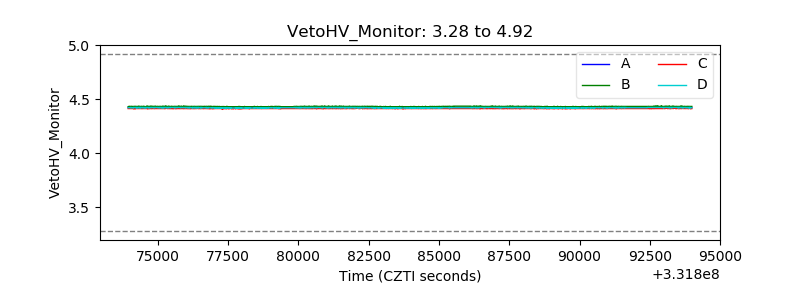 |
| Veto LLD | 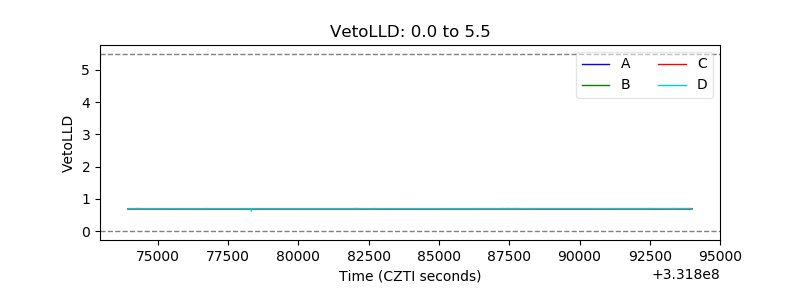 |
| Alpha Counter | 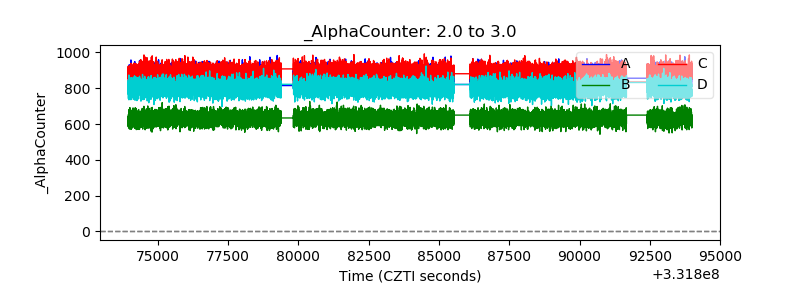 |
| _CPM_Rate | 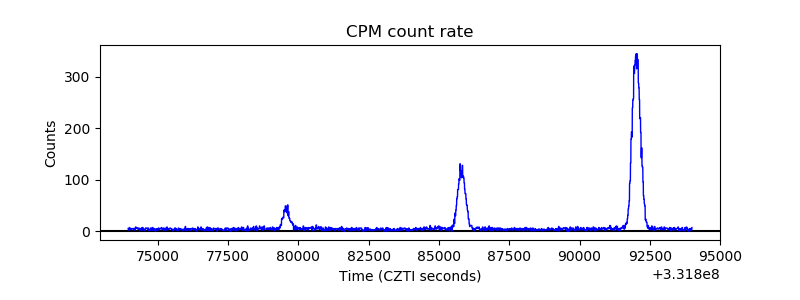 |
| CZT Counter |  |
| +2.5 Volts monitor |  |
| +5 Volts monitor |  |
| _ROLL_ROT | 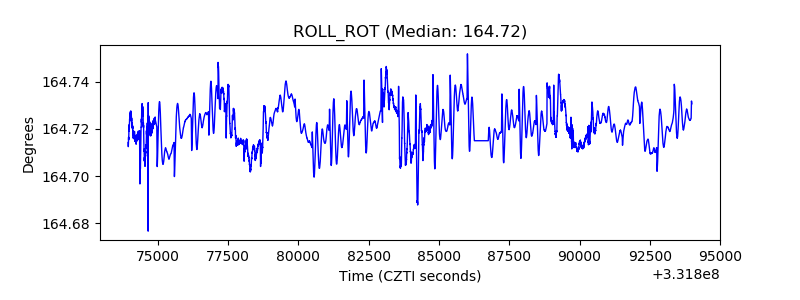 |
| _Roll_DEC | 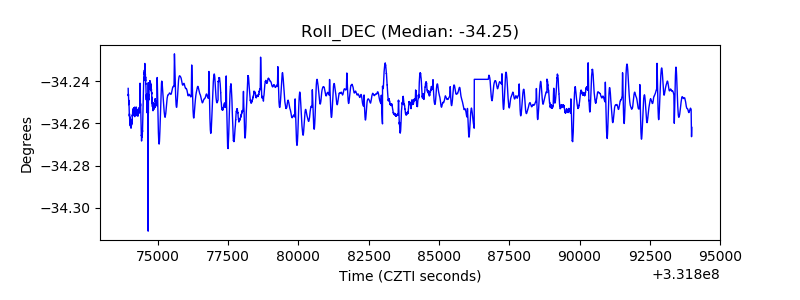 |
| _Roll_RA |  |
| Veto Counter | 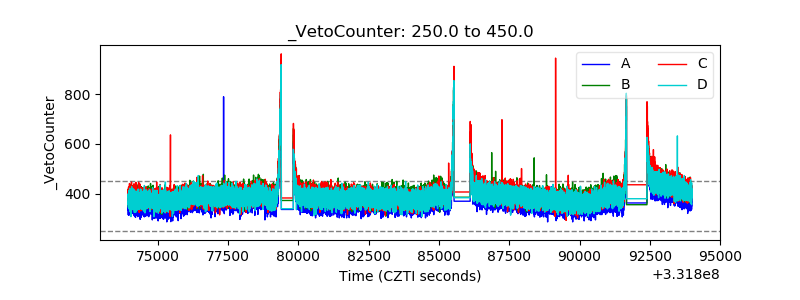 |