| Param | Original file | Final file |
|---|---|---|
| Filename | modeM0/AS1A07_068T01_9000003756_25832cztM0_level2.evt | modeM0/AS1A07_068T01_9000003756_25832cztM0_level2_quad_clean.evt |
| Size (bytes) | 470,482,560 | 97,197,120 |
| Size | 448.7 MB | 92.7 MB |
| Events in quadrant A | 3,302,846 | 632,573 |
| Events in quadrant B | 3,343,158 | 634,127 |
| Events in quadrant C | 3,386,635 | 602,216 |
| Events in quadrant D | 3,755,312 | 602,064 |
| Mode M0 | |||
|---|---|---|---|
| Quadrant | BADHDUFLAG | Total packets | Discarded packets |
| A | 0 | 13954 | 0 |
| B | 0 | 13993 | 0 |
| C | 0 | 14261 | 0 |
| D | 0 | 15533 | 0 |
| Mode M9 | |||
|---|---|---|---|
| Quadrant | BADHDUFLAG | Total packets | Discarded packets |
| A | 0 | 9 | 0 |
| B | 0 | 9 | 0 |
| C | 0 | 9 | 0 |
| D | 0 | 9 | 0 |
| Quadrant | Total seconds | Saturated seconds | Saturation percentage |
|---|---|---|---|
| A | 6779 | 53 | 0.781826% |
| B | 6779 | 60 | 0.885086% |
| C | 6779 | 106 | 1.563652% |
| D | 6779 | 80 | 1.180115% |
Noise dominated data is calculated using 1-second bins in cleaned event files. If a bin has >2000 counts, and if more than 50% of those come from <1% of pixels, then it is considered to be noise-dominated and hence unusable.
| Quadrant | # 1 sec bins | Bins with >0 counts | Bins with >2000 counts | High rate bins dominated by noise | Noise dominated (total time) | Noise dominated (detector-on time) | Marked lightcurve |
|---|---|---|---|---|---|---|---|
| A | 7674 | 6780 | 0 | 0 | 0.00% | 0.00% | 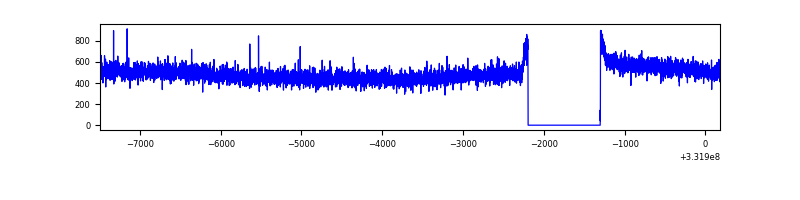 |
| B | 7674 | 6780 | 1 | 1 | 0.01% | 0.01% | 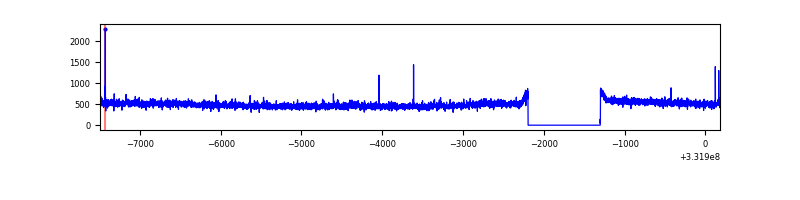 |
| C | 7674 | 6780 | 6 | 6 | 0.08% | 0.09% | 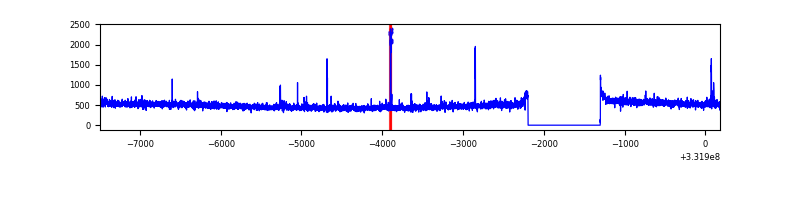 |
| D | 7674 | 6780 | 31 | 31 | 0.40% | 0.46% | 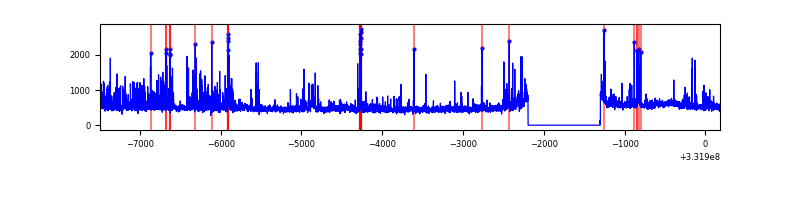 |
Top three noisy pixels from each quadrant. If the there are fewer than three noisy pixels in the level2.evt file, extra rows are filled as -1
| Pixel properties | Quadrant properties | ||||||
|---|---|---|---|---|---|---|---|
| Quadrant | DetID | PixID | Counts | Sigma | Mean | Median | Sigma |
| A | 6 | 16 | 12413 | 67.49 | 852 | 836 | 171.5 |
| A | 3 | 137 | 7898 | 41.17 | 852 | 836 | 171.5 |
| A | 13 | 254 | 7735 | 40.22 | 852 | 836 | 171.5 |
| B | 0 | 219 | 45143 | 274.96 | 837 | 816 | 161.2 |
| B | 12 | 111 | 20136 | 119.84 | 837 | 816 | 161.2 |
| B | 11 | 111 | 18251 | 108.15 | 837 | 816 | 161.2 |
| C | 14 | 238 | 128827 | 677.02 | 806 | 809 | 189.1 |
| C | 3 | 233 | 94696 | 496.52 | 806 | 809 | 189.1 |
| C | 14 | 225 | 22941 | 117.04 | 806 | 809 | 189.1 |
| D | 1 | 52 | 467811 | 2370.8 | 821 | 799 | 197.0 |
| D | 12 | 233 | 71139 | 357.08 | 821 | 799 | 197.0 |
| D | 1 | 3 | 58961 | 295.26 | 821 | 799 | 197.0 |
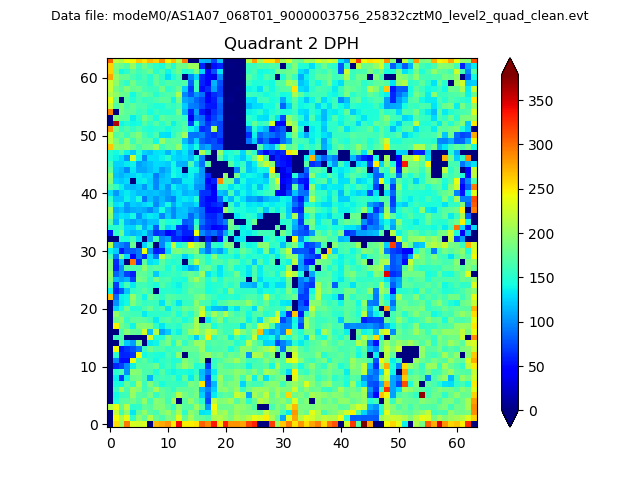
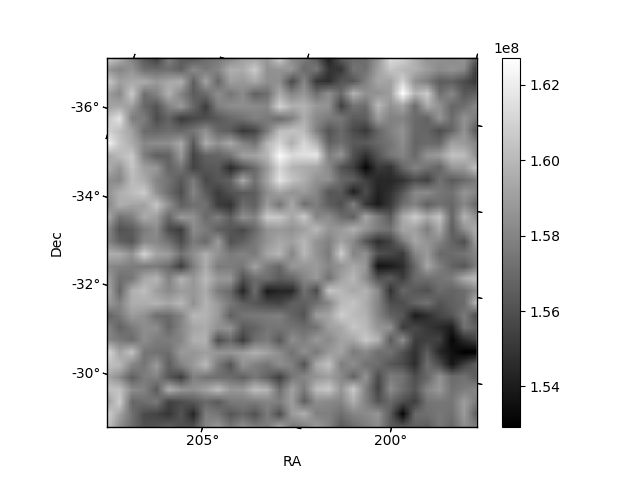
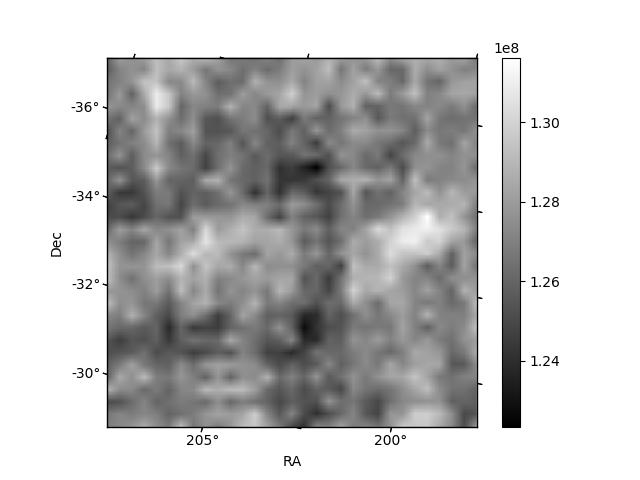
Histogram calculated using DETX and DETY for each event in the final _common_clean file
| Quadrant A | 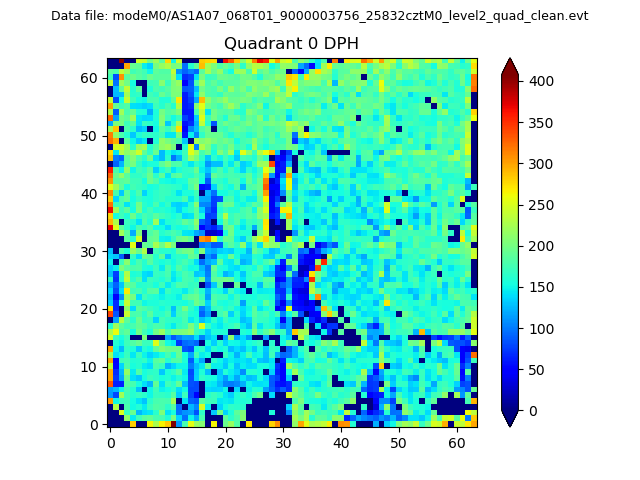 |
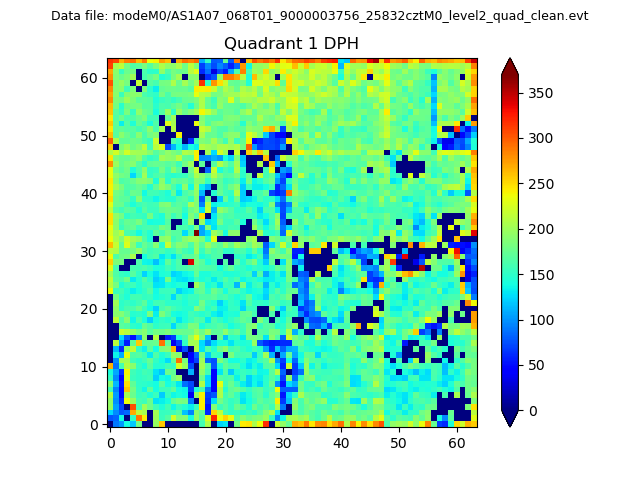 |
Quadrant B |
|---|---|---|---|
| Quadrant D | 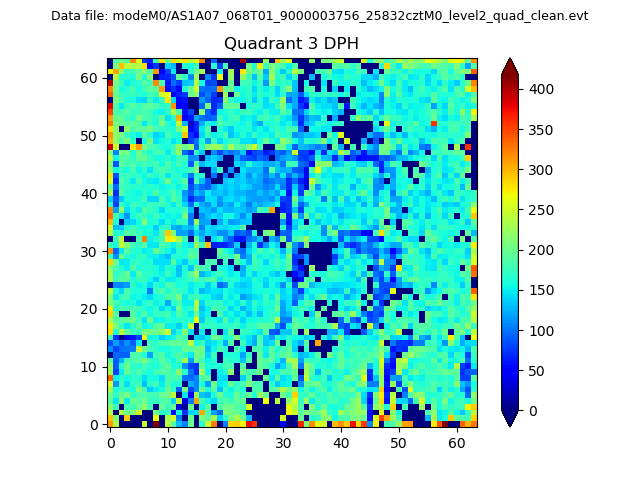 |
 |
Quadrant C |
| Plot type | Count rate plots | Images |
|---|---|---|
| Comparison with Poisson distribution Blue bars denote a histogram of data divided into 1 sec bins. Red curve is a Poisson curve with rate = median count rate of data. |
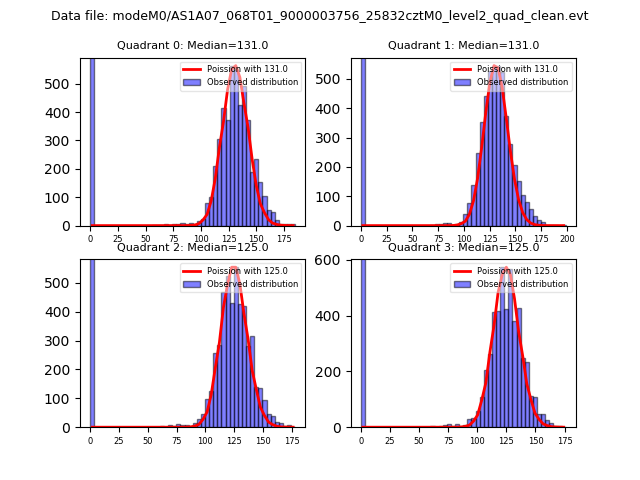 |
 |
| Quadrant-wise count rates Data is divided into 100 sec bins |
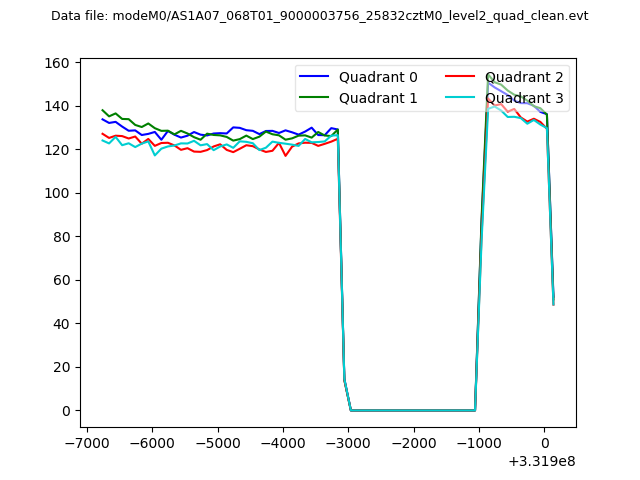 |
|
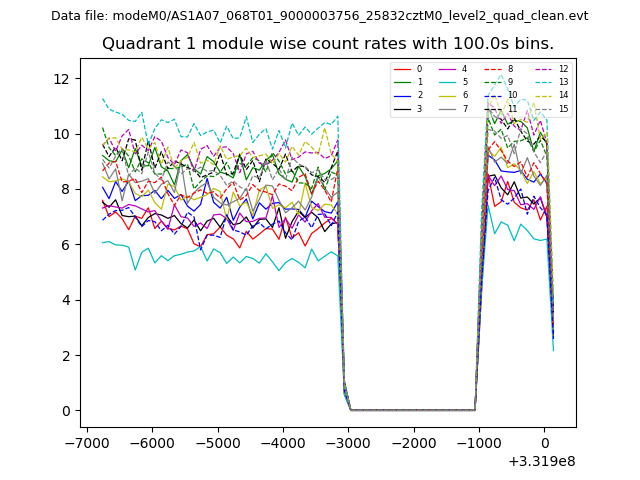
| Module-wise count rates for Quadrant A Data is divided into 100 sec bins |
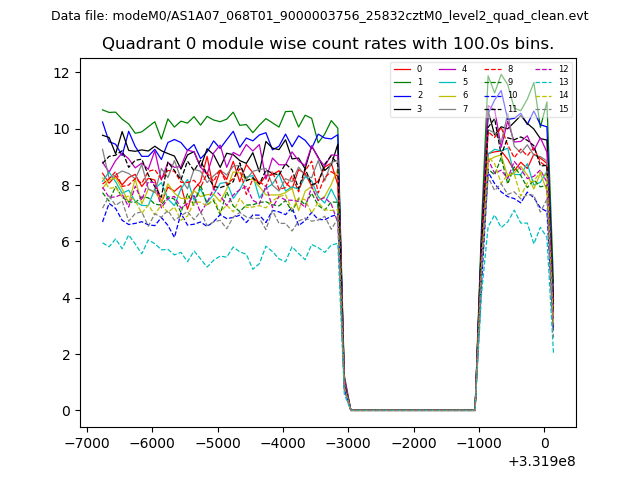 |
 |
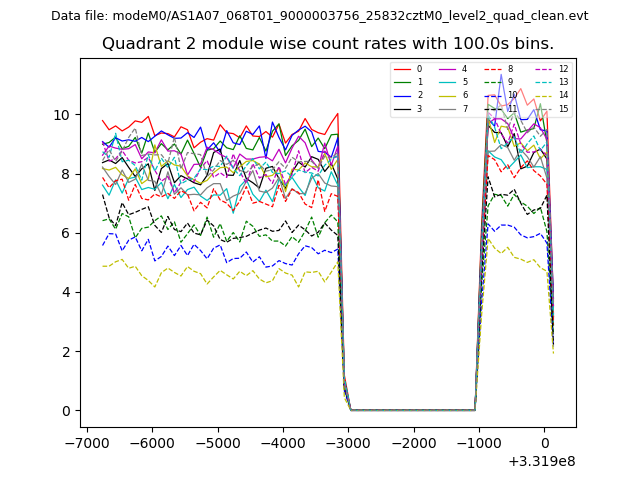
| Module-wise count rates for Quadrant B Data is divided into 100 sec bins |
 |
 |
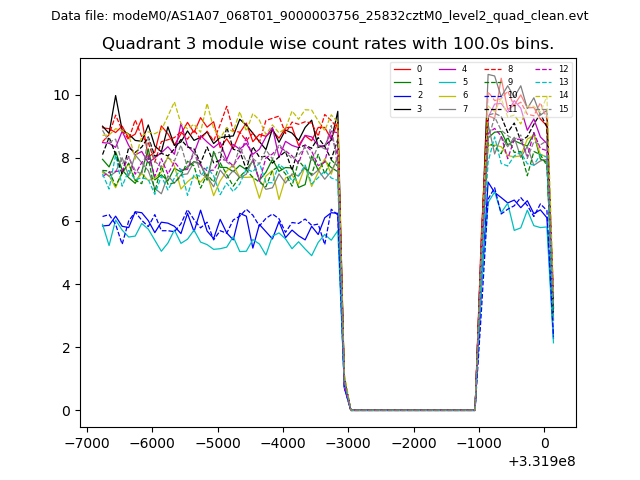
| Module-wise count rates for Quadrant C Data is divided into 100 sec bins |
 |
 |
| Module-wise count rates for Quadrant D Data is divided into 100 sec bins |
 |
 |
| Parameter | Plot |
|---|---|
| CZT HV Monitor | 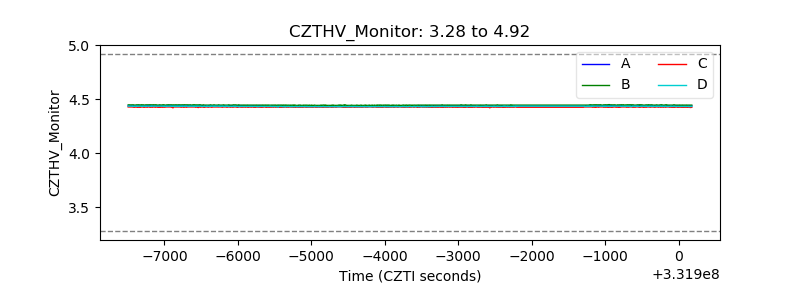 |
| D_VDD | 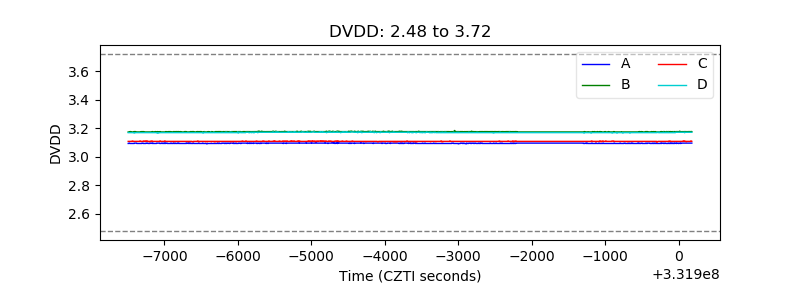 |
| Temperature 1 | 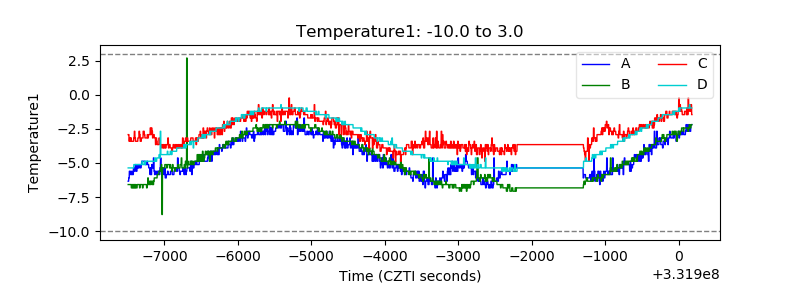 |
| Veto HV Monitor | 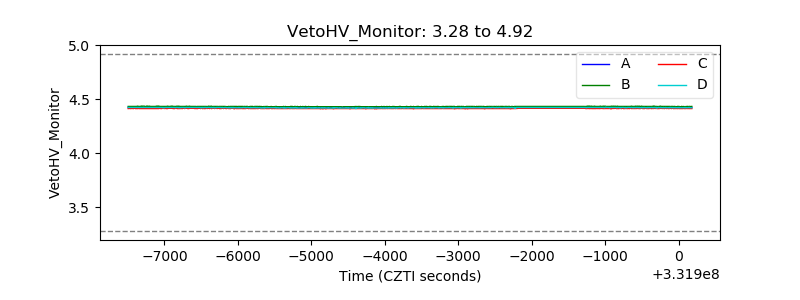 |
| Veto LLD | 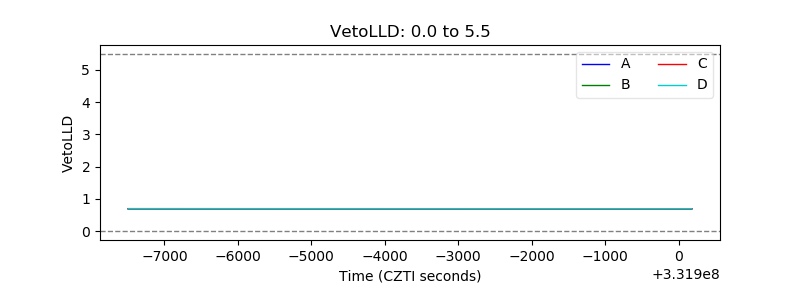 |
| Alpha Counter | 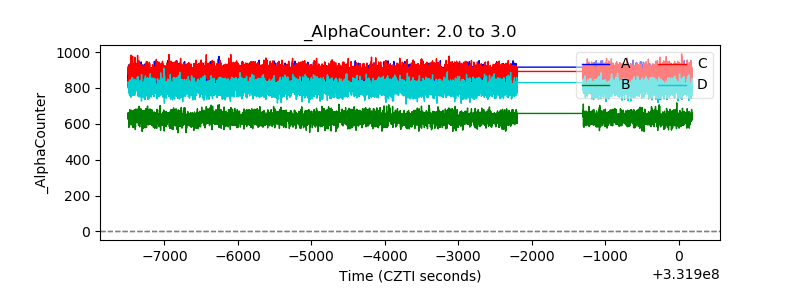 |
| _CPM_Rate | 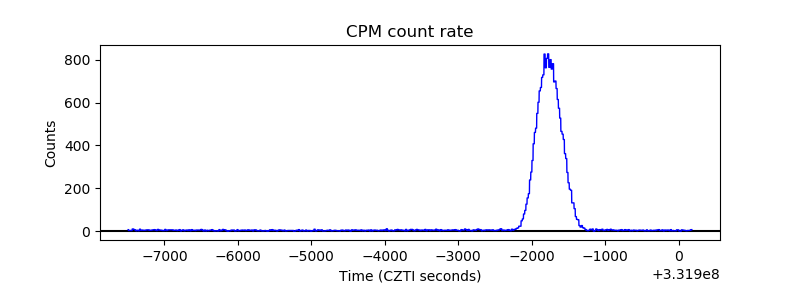 |
| CZT Counter |  |
| +2.5 Volts monitor |  |
| +5 Volts monitor |  |
| _ROLL_ROT | 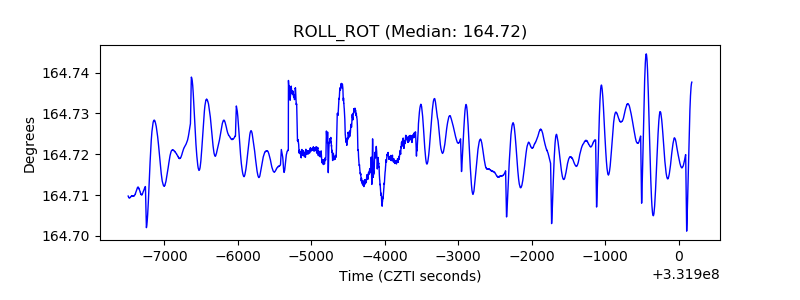 |
| _Roll_DEC | 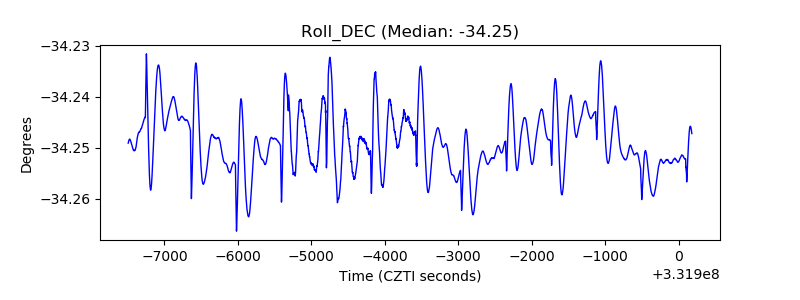 |
| _Roll_RA | 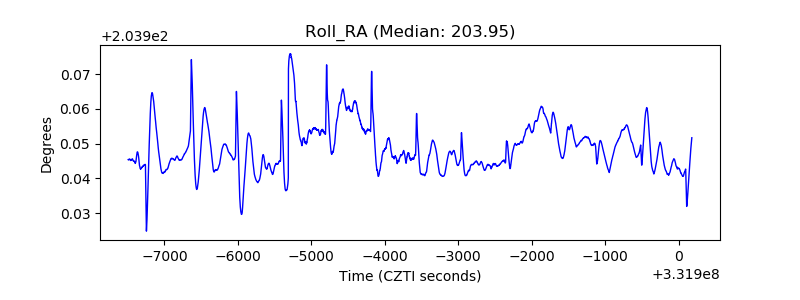 |
| Veto Counter | 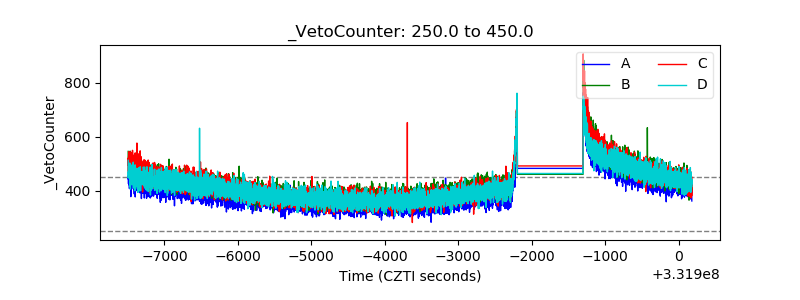 |