| Param | Original file | Final file |
|---|---|---|
| Filename | modeM0/AS1A07_068T01_9000003756_25833cztM0_level2.evt | modeM0/AS1A07_068T01_9000003756_25833cztM0_level2_quad_clean.evt |
| Size (bytes) | 467,447,040 | 105,045,120 |
| Size | 445.8 MB | 100.2 MB |
| Events in quadrant A | 3,141,794 | 712,041 |
| Events in quadrant B | 3,116,713 | 710,384 |
| Events in quadrant C | 3,127,129 | 669,920 |
| Events in quadrant D | 4,351,482 | 657,612 |
| Mode M0 | |||
|---|---|---|---|
| Quadrant | BADHDUFLAG | Total packets | Discarded packets |
| A | 0 | 13343 | 1 |
| B | 0 | 13172 | 1 |
| C | 0 | 13277 | 1 |
| D | 0 | 17191 | 1 |
| Mode SS | |||
|---|---|---|---|
| Quadrant | BADHDUFLAG | Total packets | Discarded packets |
| A | 0 | 124 | 0 |
| B | 0 | 124 | 0 |
| C | 0 | 124 | 0 |
| D | 0 | 124 | 0 |
| Mode M9 | |||
|---|---|---|---|
| Quadrant | BADHDUFLAG | Total packets | Discarded packets |
| A | 0 | 11 | 0 |
| B | 0 | 11 | 0 |
| C | 0 | 11 | 0 |
| D | 0 | 11 | 0 |
| Quadrant | Total seconds | Saturated seconds | Saturation percentage |
|---|---|---|---|
| A | 6185 | 76 | 1.228779% |
| B | 6185 | 69 | 1.115602% |
| C | 6185 | 103 | 1.665319% |
| D | 6186 | 248 | 4.009053% |
Noise dominated data is calculated using 1-second bins in cleaned event files. If a bin has >2000 counts, and if more than 50% of those come from <1% of pixels, then it is considered to be noise-dominated and hence unusable.
| Quadrant | # 1 sec bins | Bins with >0 counts | Bins with >2000 counts | High rate bins dominated by noise | Noise dominated (total time) | Noise dominated (detector-on time) | Marked lightcurve |
|---|---|---|---|---|---|---|---|
| A | 7215 | 6186 | 0 | 0 | 0.00% | 0.00% | 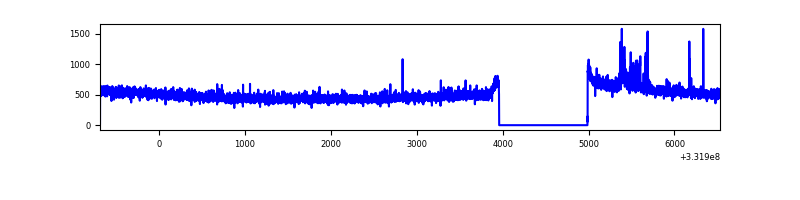 |
| B | 7215 | 6186 | 2 | 2 | 0.03% | 0.03% | 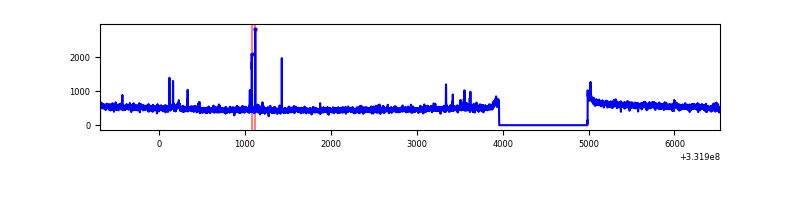 |
| C | 7215 | 6186 | 0 | 0 | 0.00% | 0.00% | 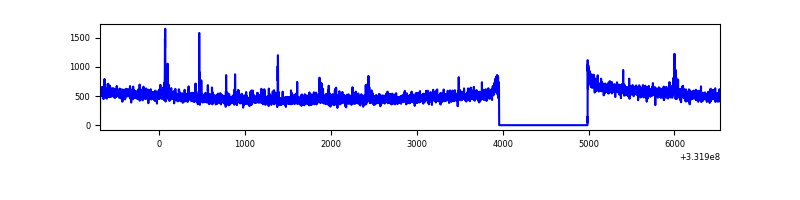 |
| D | 7216 | 6187 | 181 | 181 | 2.51% | 2.93% | 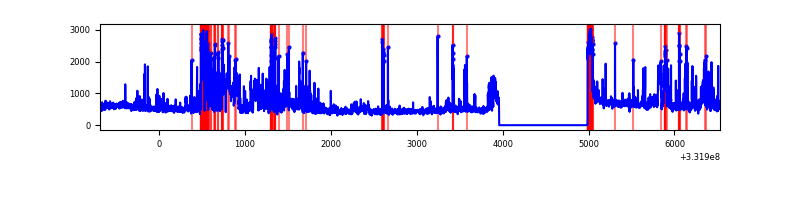 |
Top three noisy pixels from each quadrant. If the there are fewer than three noisy pixels in the level2.evt file, extra rows are filled as -1
| Pixel properties | Quadrant properties | ||||||
|---|---|---|---|---|---|---|---|
| Quadrant | DetID | PixID | Counts | Sigma | Mean | Median | Sigma |
| A | 0 | 13 | 68631 | 425.66 | 794 | 779 | 159.4 |
| A | 6 | 16 | 10391 | 60.3 | 794 | 779 | 159.4 |
| A | 3 | 137 | 7195 | 40.25 | 794 | 779 | 159.4 |
| B | 0 | 219 | 38034 | 250.26 | 774 | 754 | 149.0 |
| B | 0 | 245 | 25046 | 163.07 | 774 | 754 | 149.0 |
| B | 12 | 111 | 18099 | 116.44 | 774 | 754 | 149.0 |
| C | 14 | 238 | 120667 | 685.86 | 744 | 749 | 174.8 |
| C | 3 | 233 | 87241 | 494.68 | 744 | 749 | 174.8 |
| C | 14 | 225 | 17991 | 98.61 | 744 | 749 | 174.8 |
| D | 7 | 80 | 598511 | 3322.71 | 751 | 731 | 179.9 |
| D | 1 | 52 | 361824 | 2007.1 | 751 | 731 | 179.9 |
| D | 12 | 233 | 348832 | 1934.89 | 751 | 731 | 179.9 |
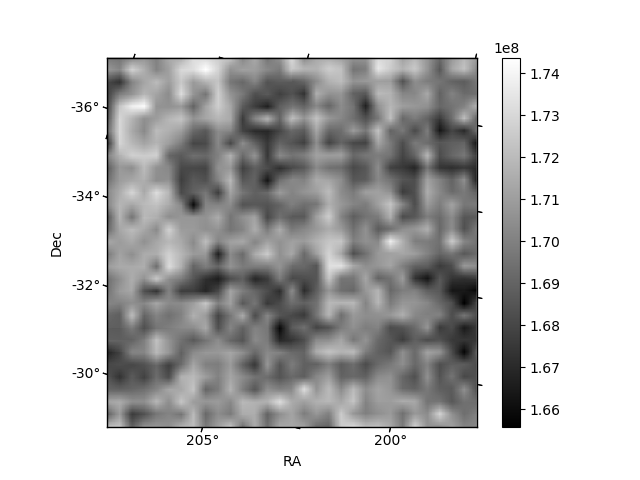
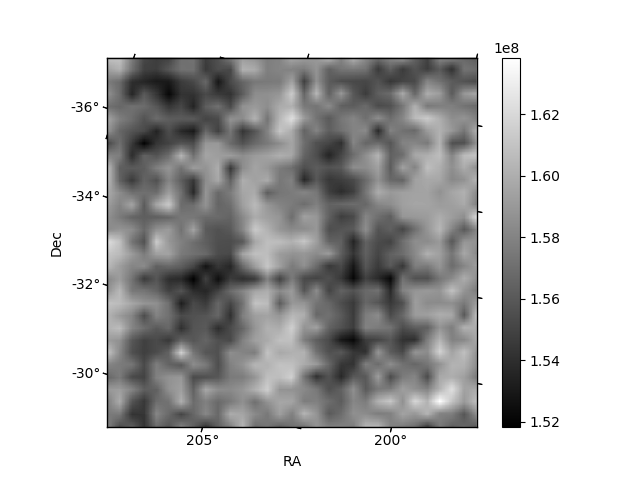
Histogram calculated using DETX and DETY for each event in the final _common_clean file
| Quadrant A | 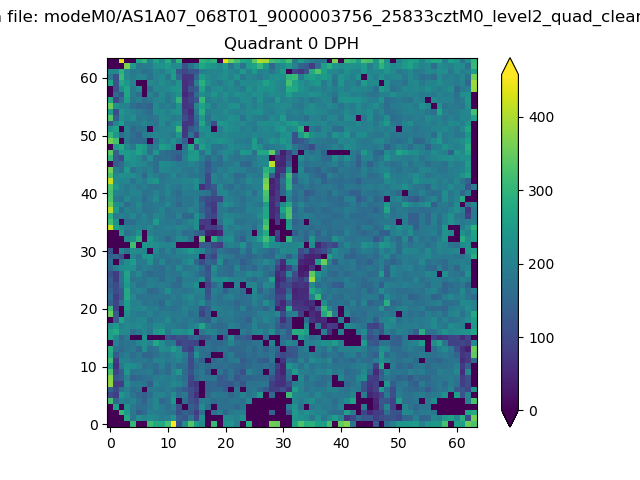 |
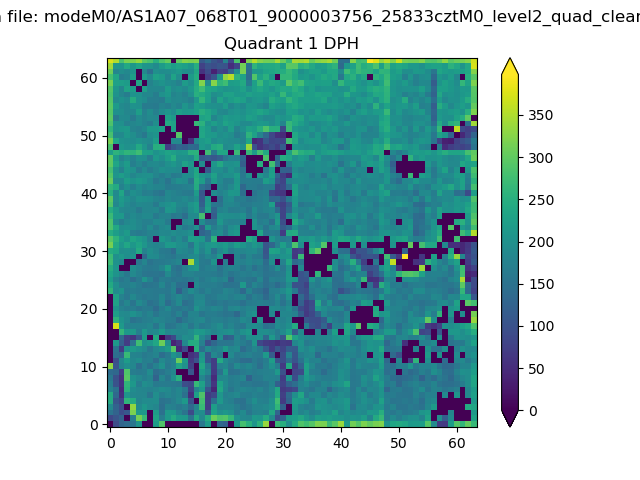 |
Quadrant B |
|---|---|---|---|
| Quadrant D | 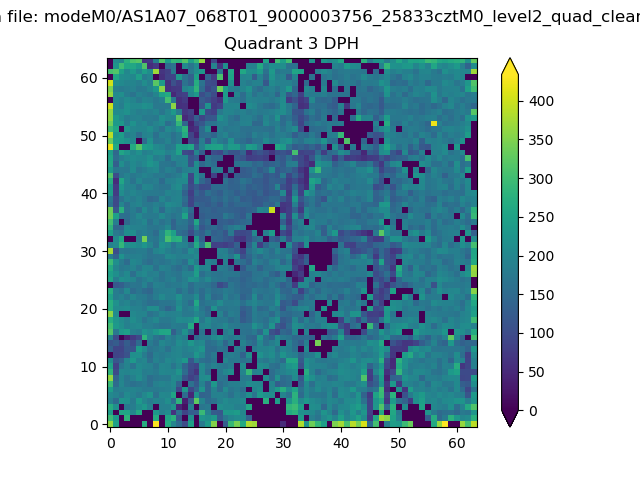 |
 |
Quadrant C |
| Plot type | Count rate plots | Images |
|---|---|---|
| Comparison with Poisson distribution Blue bars denote a histogram of data divided into 1 sec bins. Red curve is a Poisson curve with rate = median count rate of data. |
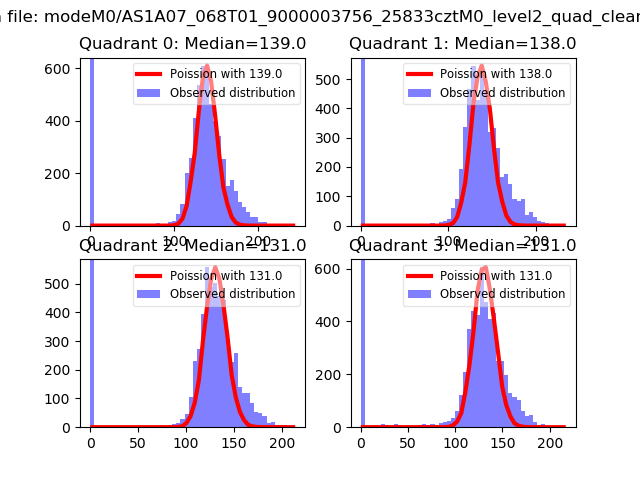 |
 |
| Quadrant-wise count rates Data is divided into 100 sec bins |
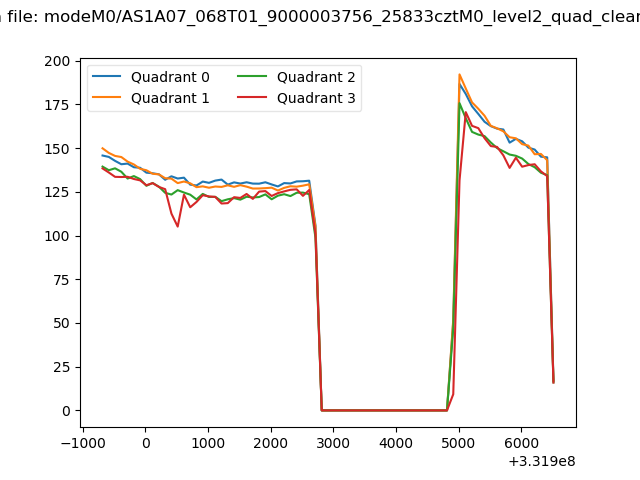 |
|
| Module-wise count rates for Quadrant A Data is divided into 100 sec bins |
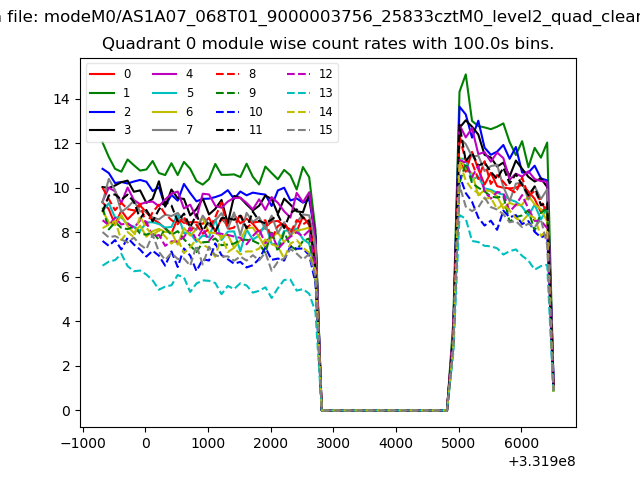 |
 |
| Module-wise count rates for Quadrant B Data is divided into 100 sec bins |
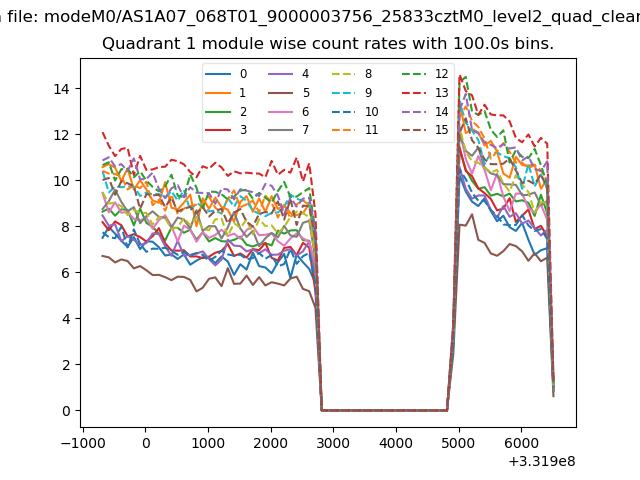 |
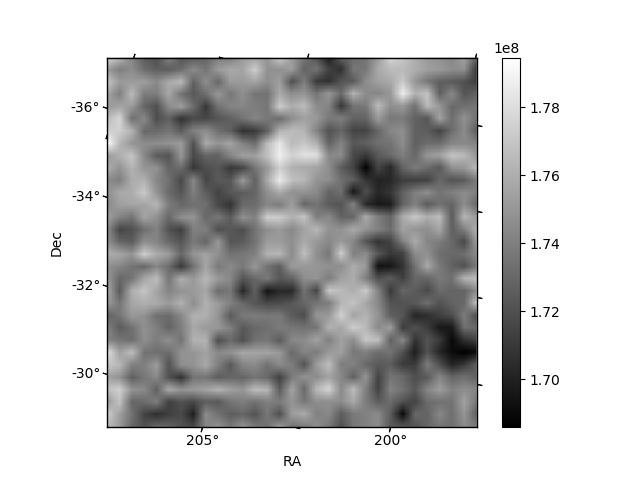 |
| Module-wise count rates for Quadrant C Data is divided into 100 sec bins |
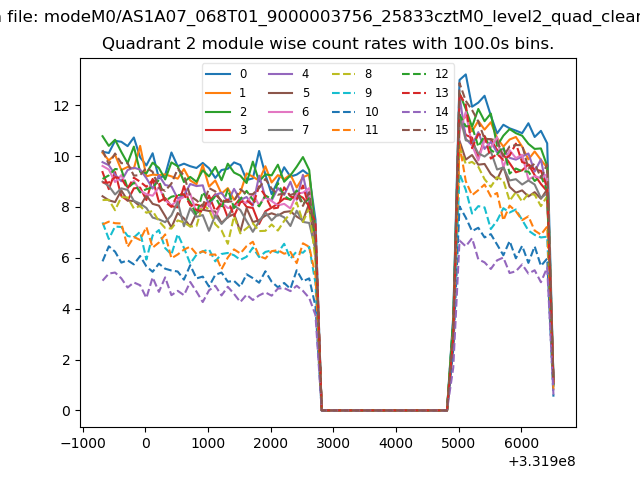 |
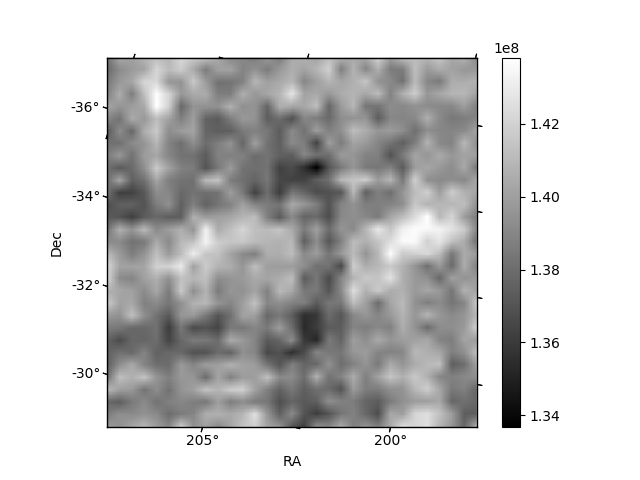 |
| Module-wise count rates for Quadrant D Data is divided into 100 sec bins |
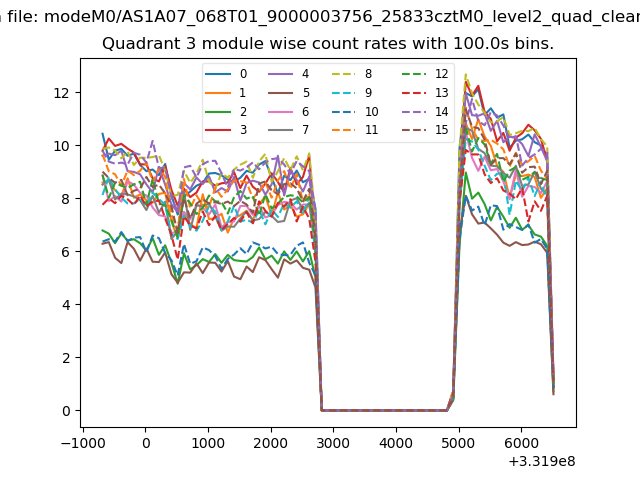 |
 |
| Parameter | Plot |
|---|---|
| CZT HV Monitor |  |
| D_VDD | 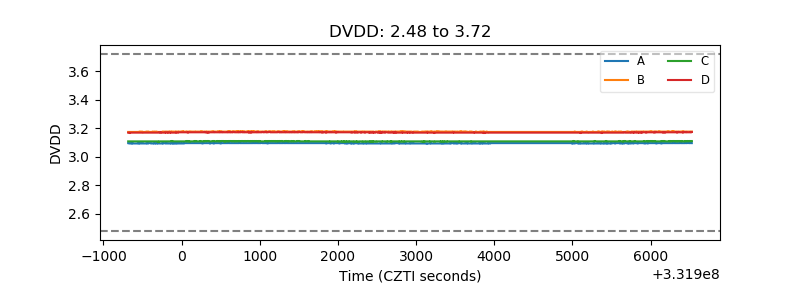 |
| Temperature 1 | 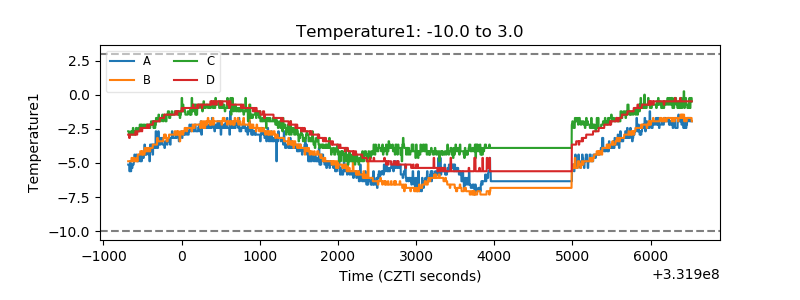 |
| Veto HV Monitor | 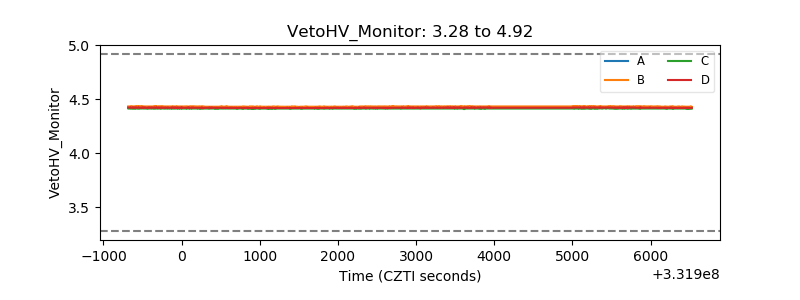 |
| Veto LLD | 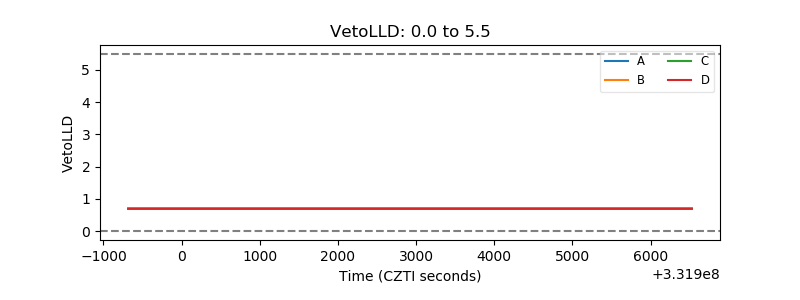 |
| Alpha Counter | 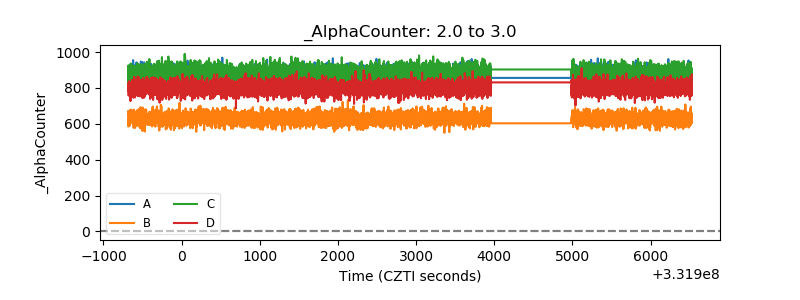 |
| _CPM_Rate | 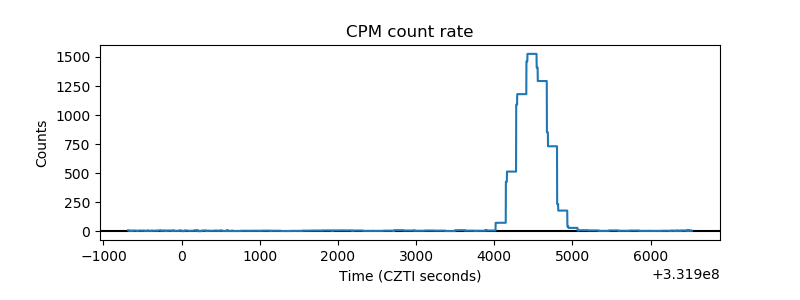 |
| CZT Counter | 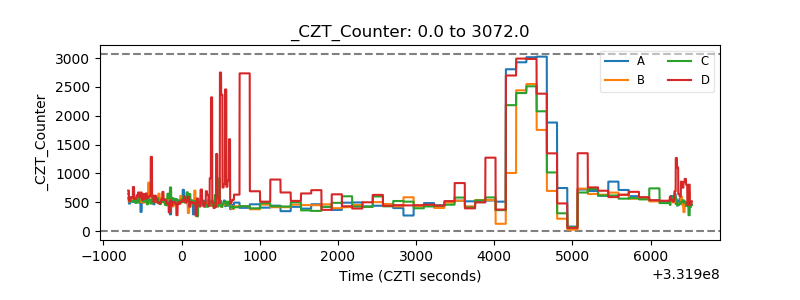 |
| +2.5 Volts monitor |  |
| +5 Volts monitor |  |
| _ROLL_ROT | 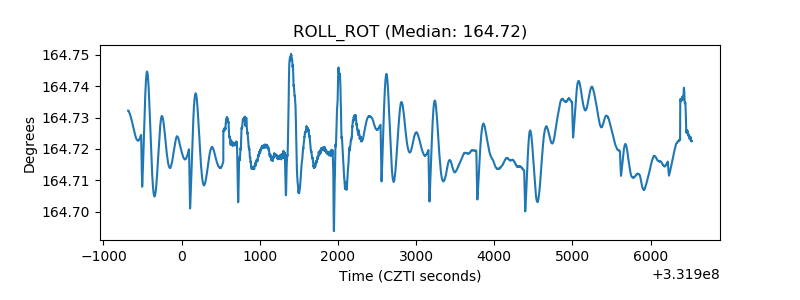 |
| _Roll_DEC | 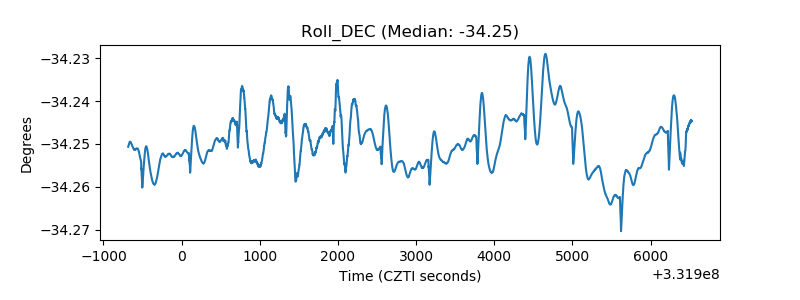 |
| _Roll_RA |  |
| Veto Counter | 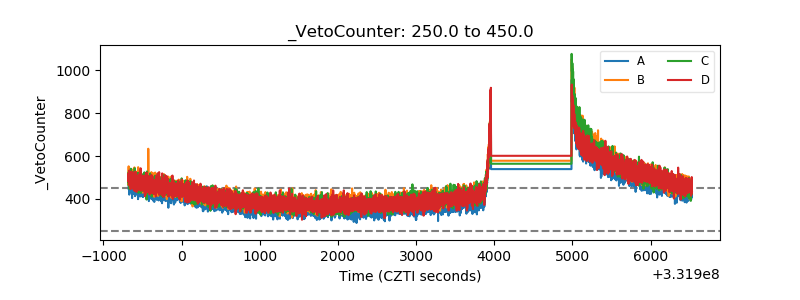 |