| Param | Original file | Final file |
|---|---|---|
| Filename | modeM0/AS1A07_068T01_9000003756_25835cztM0_level2.evt | modeM0/AS1A07_068T01_9000003756_25835cztM0_level2_quad_clean.evt |
| Size (bytes) | 442,710,720 | 95,716,800 |
| Size | 422.2 MB | 91.3 MB |
| Events in quadrant A | 2,965,186 | 646,809 |
| Events in quadrant B | 2,964,070 | 643,382 |
| Events in quadrant C | 3,294,780 | 601,934 |
| Events in quadrant D | 3,793,466 | 605,281 |
| Mode M0 | |||
|---|---|---|---|
| Quadrant | BADHDUFLAG | Total packets | Discarded packets |
| A | 0 | 12513 | 0 |
| B | 0 | 12440 | 0 |
| C | 0 | 13525 | 0 |
| D | 0 | 14979 | 0 |
| Mode M9 | |||
|---|---|---|---|
| Quadrant | BADHDUFLAG | Total packets | Discarded packets |
| A | 0 | 12 | 0 |
| B | 0 | 12 | 0 |
| C | 0 | 12 | 0 |
| D | 0 | 12 | 0 |
| Quadrant | Total seconds | Saturated seconds | Saturation percentage |
|---|---|---|---|
| A | 5743 | 57 | 0.992513% |
| B | 5743 | 54 | 0.940275% |
| C | 5743 | 248 | 4.318301% |
| D | 5742 | 151 | 2.629746% |
Noise dominated data is calculated using 1-second bins in cleaned event files. If a bin has >2000 counts, and if more than 50% of those come from <1% of pixels, then it is considered to be noise-dominated and hence unusable.
| Quadrant | # 1 sec bins | Bins with >0 counts | Bins with >2000 counts | High rate bins dominated by noise | Noise dominated (total time) | Noise dominated (detector-on time) | Marked lightcurve |
|---|---|---|---|---|---|---|---|
| A | 6923 | 5744 | 0 | 0 | 0.00% | 0.00% | 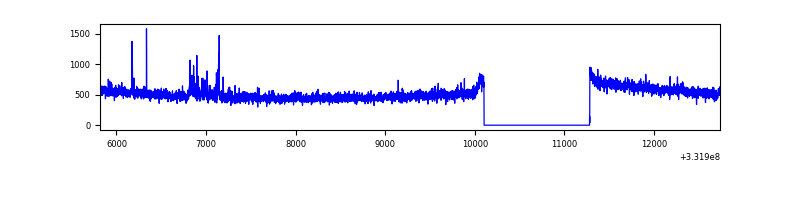 |
| B | 6923 | 5744 | 0 | 0 | 0.00% | 0.00% | 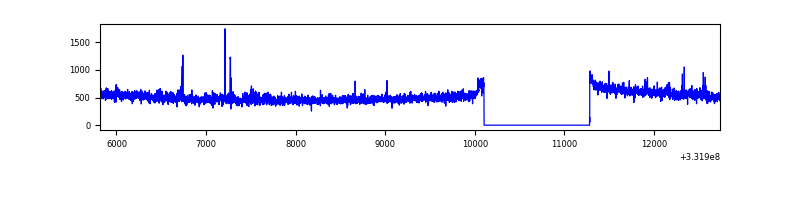 |
| C | 6923 | 5744 | 173 | 173 | 2.50% | 3.01% | 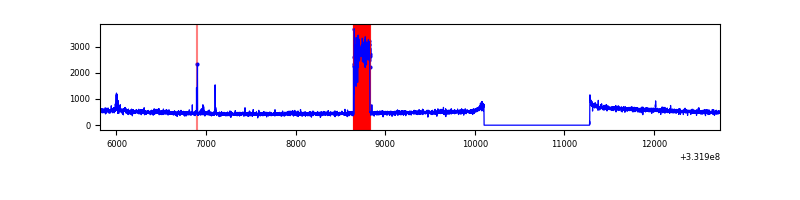 |
| D | 6922 | 5743 | 77 | 77 | 1.11% | 1.34% | 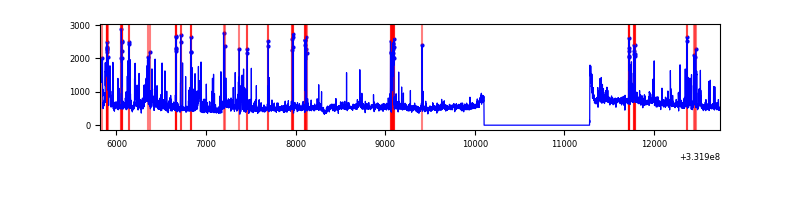 |
Top three noisy pixels from each quadrant. If the there are fewer than three noisy pixels in the level2.evt file, extra rows are filled as -1
| Pixel properties | Quadrant properties | ||||||
|---|---|---|---|---|---|---|---|
| Quadrant | DetID | PixID | Counts | Sigma | Mean | Median | Sigma |
| A | 0 | 13 | 41887 | 274.76 | 751 | 738 | 149.8 |
| A | 6 | 16 | 13053 | 82.23 | 751 | 738 | 149.8 |
| A | 11 | 29 | 12397 | 77.85 | 751 | 738 | 149.8 |
| B | 0 | 219 | 55254 | 389.5 | 733 | 717 | 140.0 |
| B | 5 | 172 | 17035 | 116.54 | 733 | 717 | 140.0 |
| B | 12 | 111 | 16514 | 112.82 | 733 | 717 | 140.0 |
| C | 14 | 225 | 477511 | 3013.06 | 682 | 687 | 158.3 |
| C | 14 | 238 | 111689 | 701.42 | 682 | 687 | 158.3 |
| C | 3 | 233 | 49148 | 306.23 | 682 | 687 | 158.3 |
| D | 1 | 3 | 359131 | 2091.71 | 715 | 699 | 171.4 |
| D | 1 | 52 | 272249 | 1584.69 | 715 | 699 | 171.4 |
| D | 7 | 80 | 271763 | 1581.86 | 715 | 699 | 171.4 |
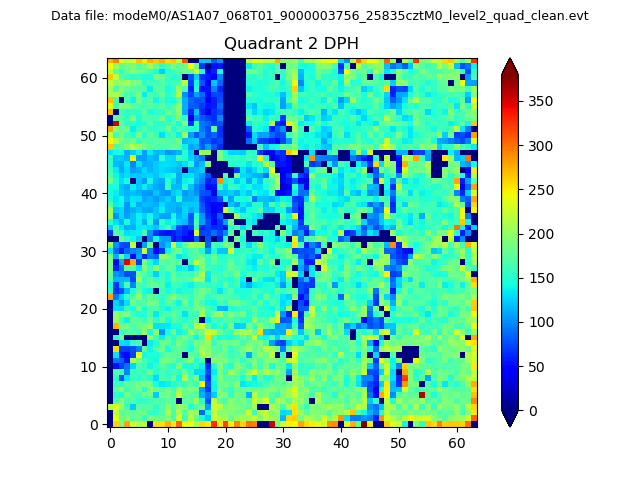
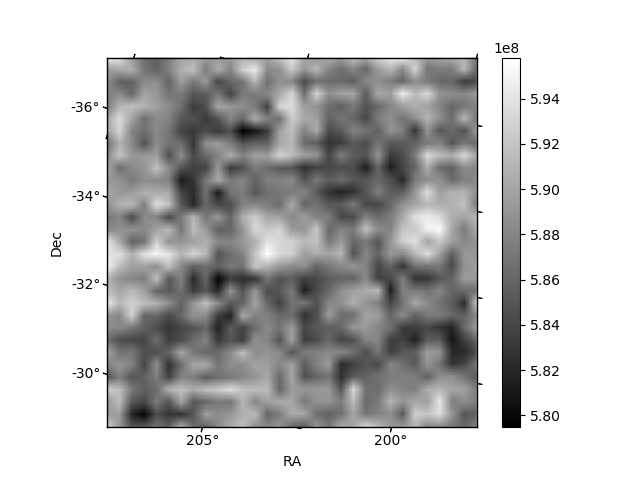
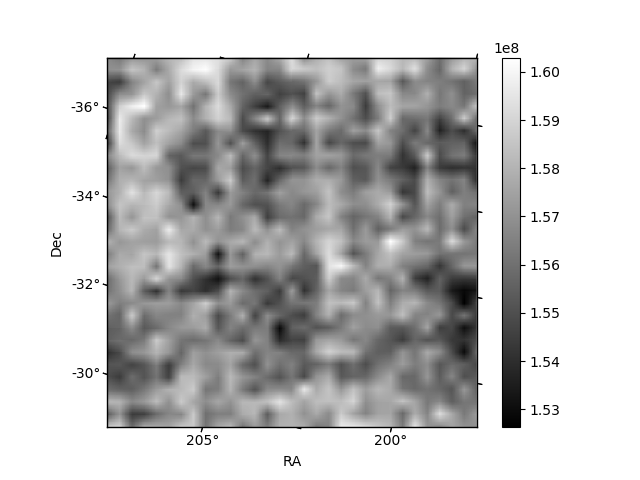
Histogram calculated using DETX and DETY for each event in the final _common_clean file
| Quadrant A | 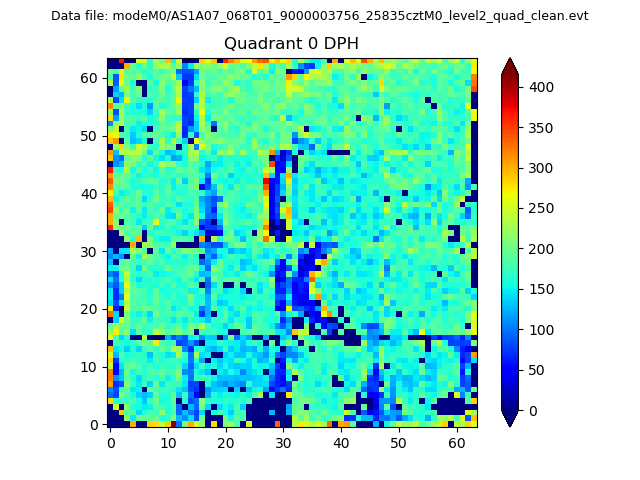 |
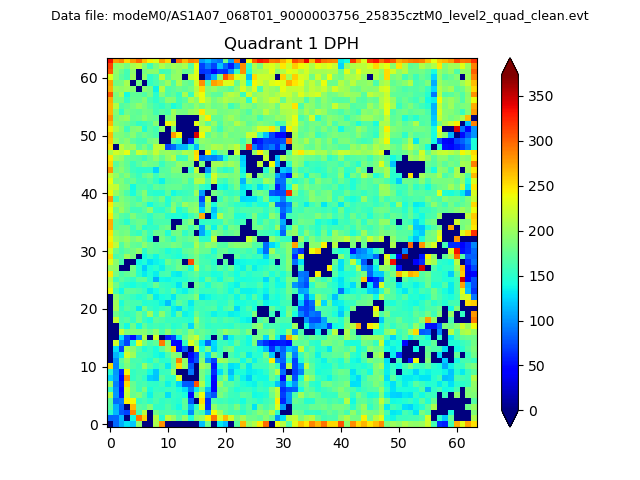 |
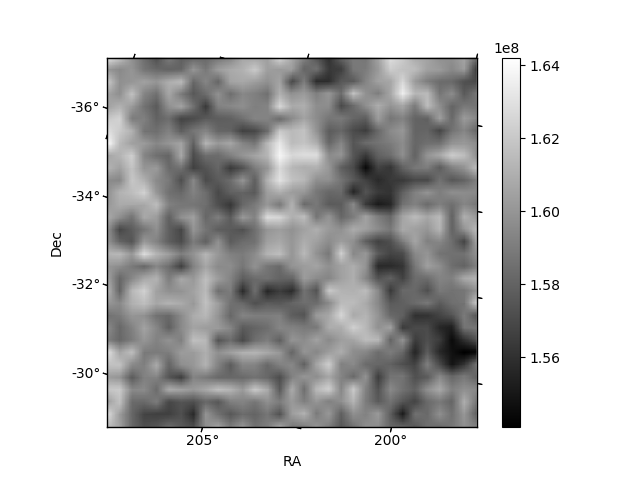
Quadrant B |
|---|---|---|---|
| Quadrant D | 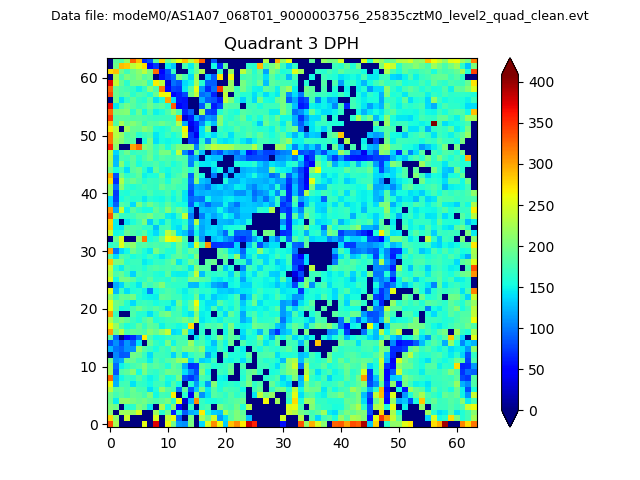 |
 |
Quadrant C |
| Plot type | Count rate plots | Images |
|---|---|---|
| Comparison with Poisson distribution Blue bars denote a histogram of data divided into 1 sec bins. Red curve is a Poisson curve with rate = median count rate of data. |
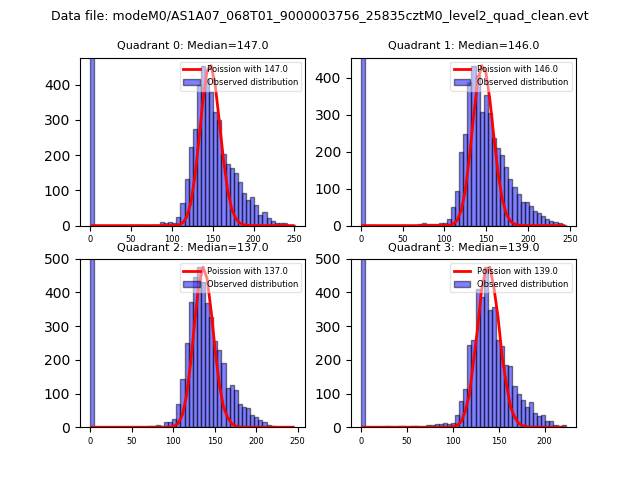 |
 |
| Quadrant-wise count rates Data is divided into 100 sec bins |
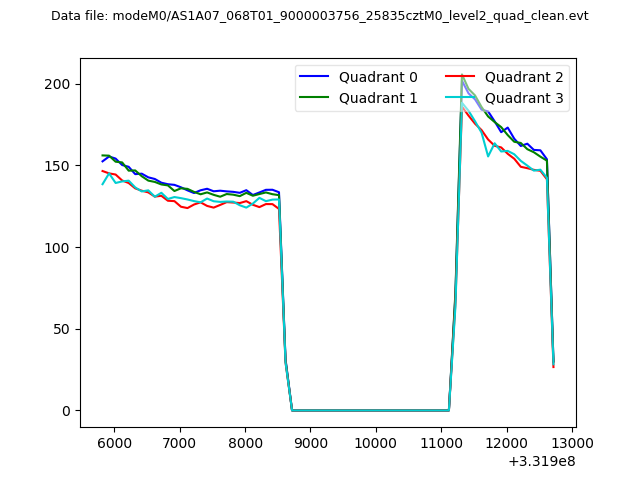 |
|
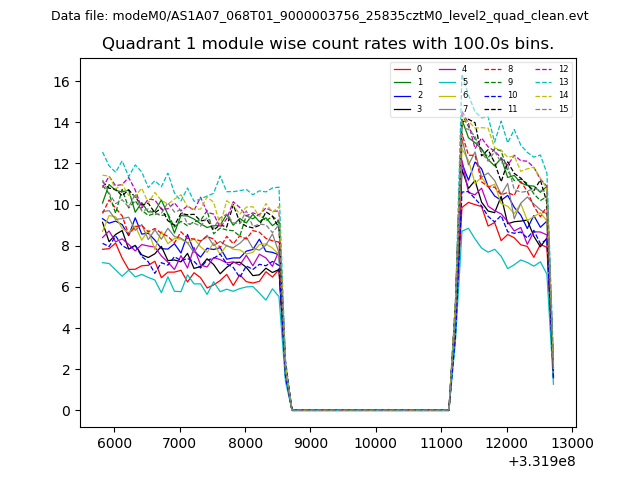
| Module-wise count rates for Quadrant A Data is divided into 100 sec bins |
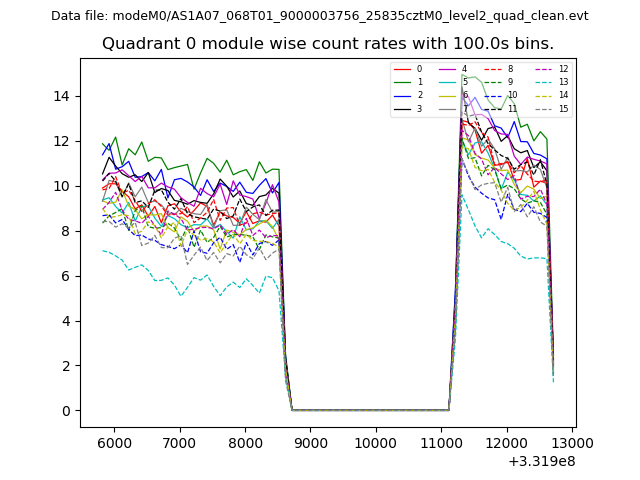 |
 |
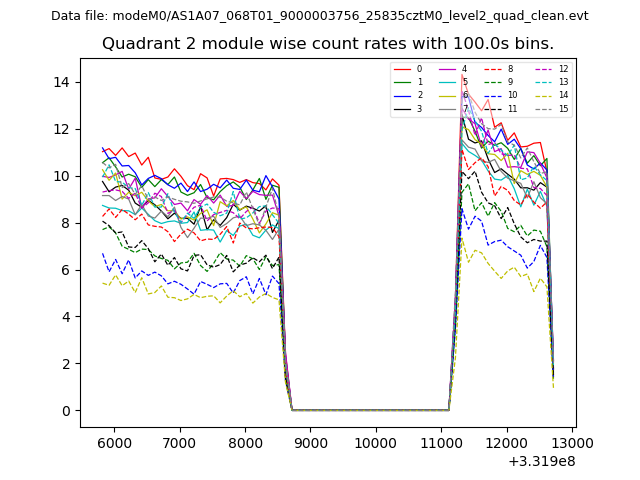
| Module-wise count rates for Quadrant B Data is divided into 100 sec bins |
 |
 |
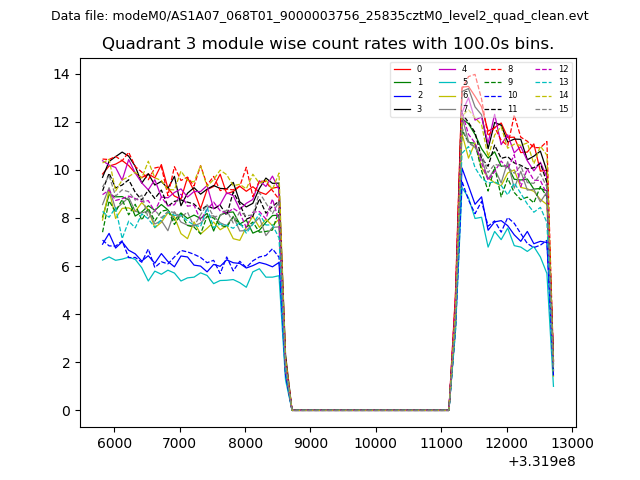
| Module-wise count rates for Quadrant C Data is divided into 100 sec bins |
 |
 |
| Module-wise count rates for Quadrant D Data is divided into 100 sec bins |
 |
 |
| Parameter | Plot |
|---|---|
| CZT HV Monitor | 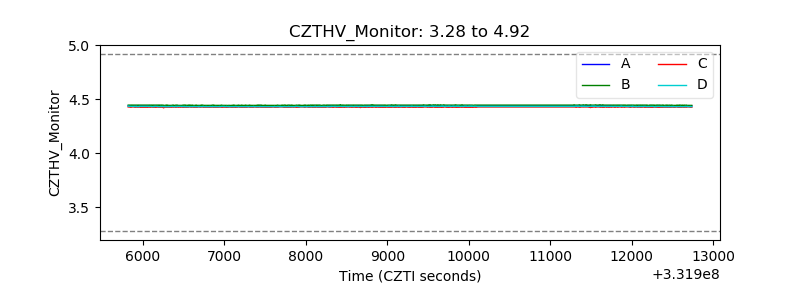 |
| D_VDD | 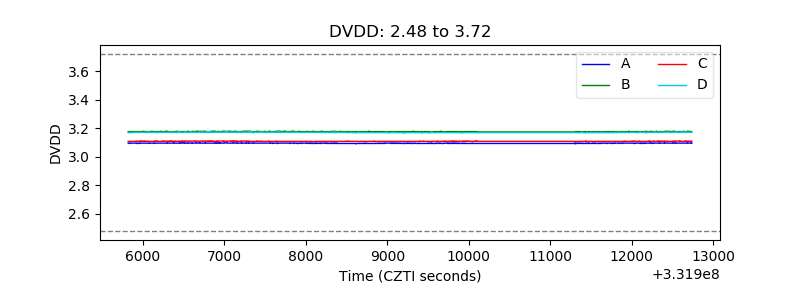 |
| Temperature 1 | 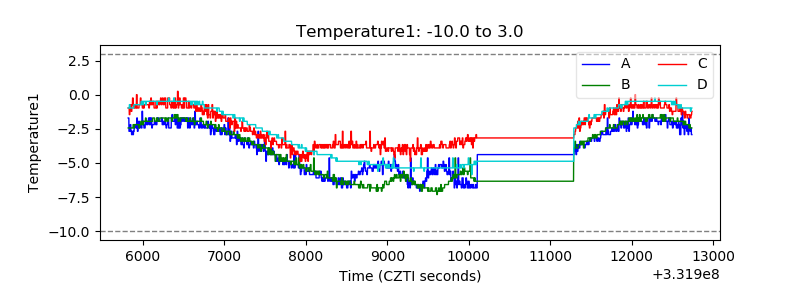 |
| Veto HV Monitor | 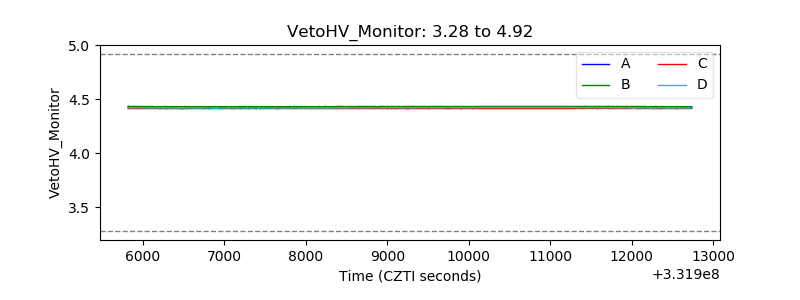 |
| Veto LLD | 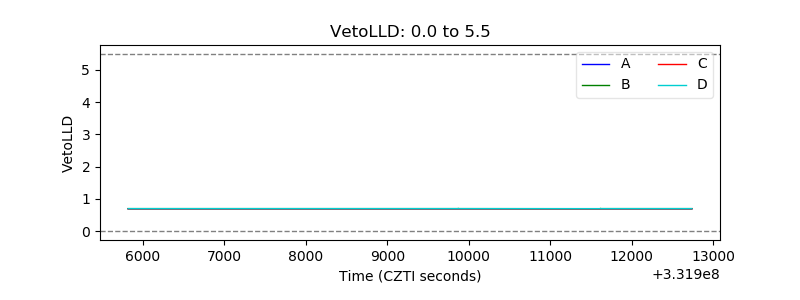 |
| Alpha Counter | 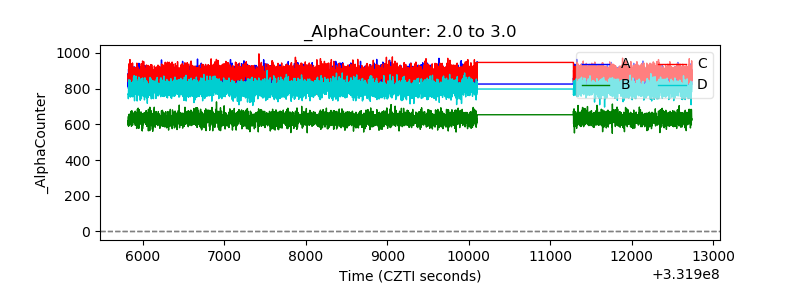 |
| _CPM_Rate | 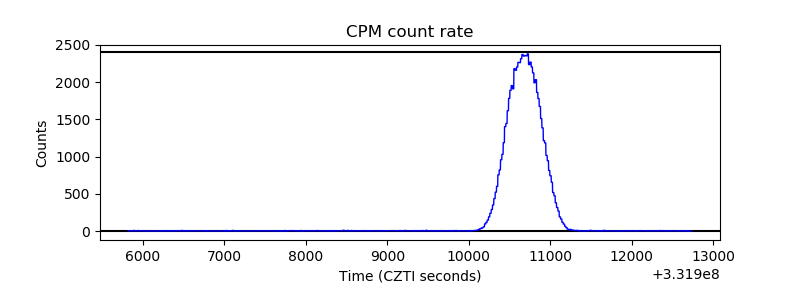 |
| CZT Counter | 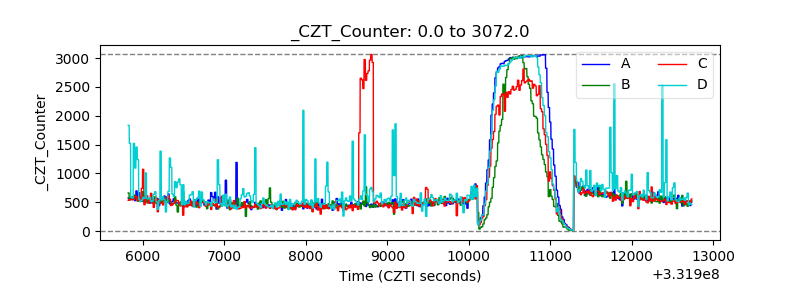 |
| +2.5 Volts monitor |  |
| +5 Volts monitor |  |
| _ROLL_ROT | 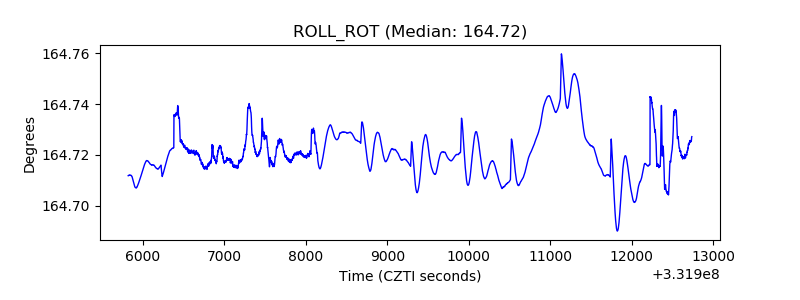 |
| _Roll_DEC | 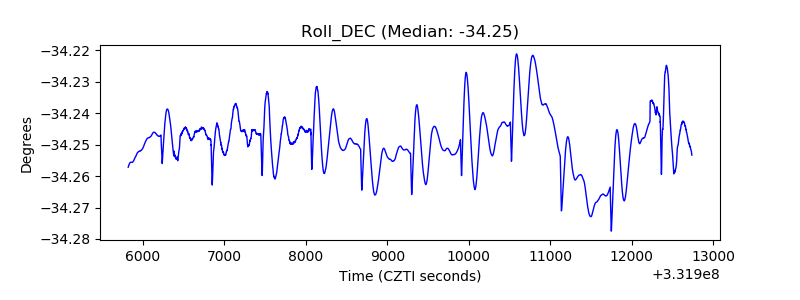 |
| _Roll_RA | 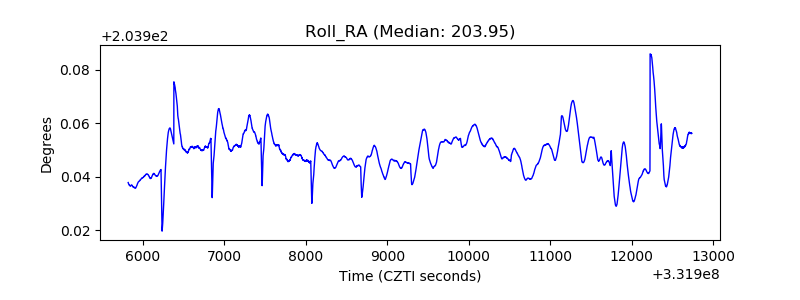 |
| Veto Counter | 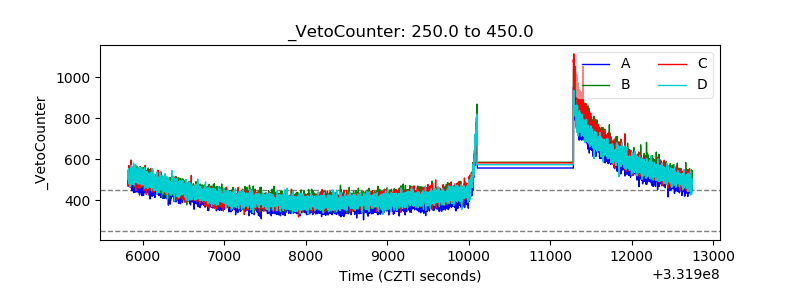 |