| Param | Original file | Final file |
|---|---|---|
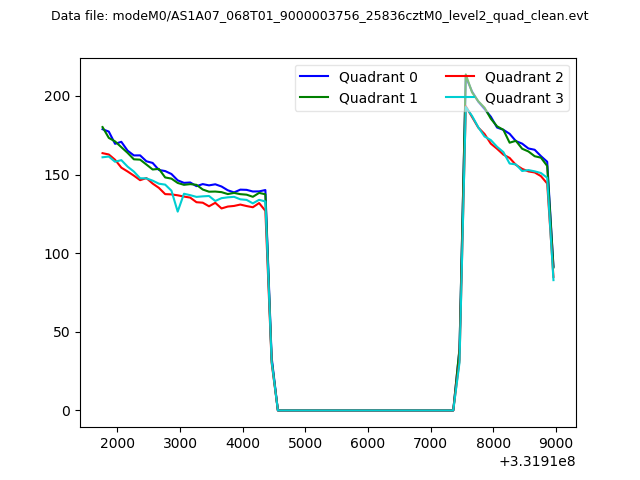
| Filename | modeM0/AS1A07_068T01_9000003756_25836cztM0_level2.evt | modeM0/AS1A07_068T01_9000003756_25836cztM0_level2_quad_clean.evt |
| Size (bytes) | 455,558,400 | 99,552,960 |
| Size | 434.5 MB | 94.9 MB |
| Events in quadrant A | 3,151,181 | 676,775 |
| Events in quadrant B | 3,181,642 | 669,105 |
| Events in quadrant C | 3,113,705 | 621,564 |
| Events in quadrant D | 3,942,493 | 628,259 |
| Mode M0 | |||
|---|---|---|---|
| Quadrant | BADHDUFLAG | Total packets | Discarded packets |
| A | 0 | 13172 | 0 |
| B | 0 | 13221 | 0 |
| C | 0 | 13076 | 0 |
| D | 0 | 15643 | 0 |
| Mode M9 | |||
|---|---|---|---|
| Quadrant | BADHDUFLAG | Total packets | Discarded packets |
| A | 0 | 12 | 0 |
| B | 0 | 12 | 0 |
| C | 0 | 12 | 0 |
| D | 0 | 12 | 0 |
| Quadrant | Total seconds | Saturated seconds | Saturation percentage |
|---|---|---|---|
| A | 5997 | 79 | 1.317325% |
| B | 5998 | 74 | 1.233745% |
| C | 5998 | 104 | 1.733911% |
| D | 5997 | 119 | 1.984325% |
Noise dominated data is calculated using 1-second bins in cleaned event files. If a bin has >2000 counts, and if more than 50% of those come from <1% of pixels, then it is considered to be noise-dominated and hence unusable.
| Quadrant | # 1 sec bins | Bins with >0 counts | Bins with >2000 counts | High rate bins dominated by noise | Noise dominated (total time) | Noise dominated (detector-on time) | Marked lightcurve |
|---|---|---|---|---|---|---|---|
| A | 7262 | 5998 | 0 | 0 | 0.00% | 0.00% | 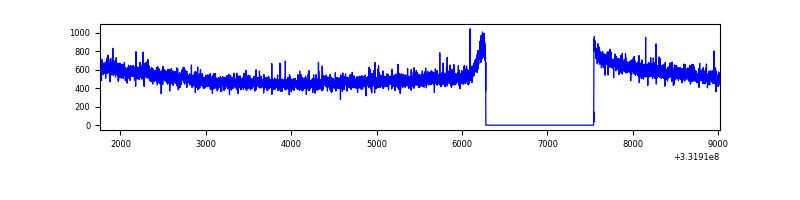 |
| B | 7263 | 5999 | 0 | 0 | 0.00% | 0.00% | 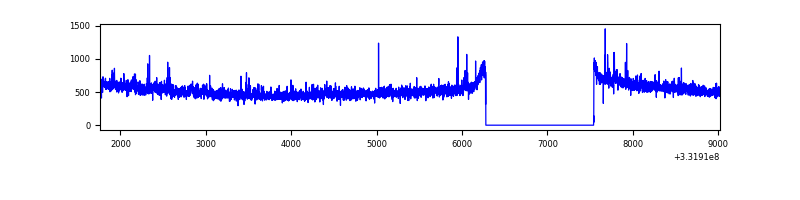 |
| C | 7263 | 5999 | 2 | 2 | 0.03% | 0.03% | 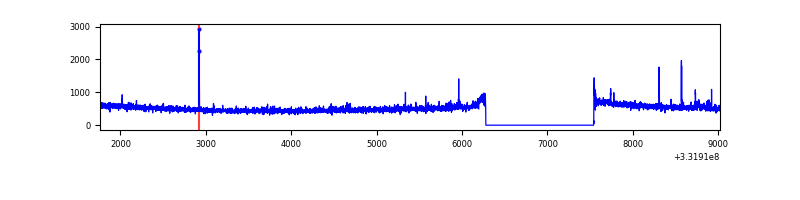 |
| D | 7262 | 5998 | 43 | 43 | 0.59% | 0.72% | 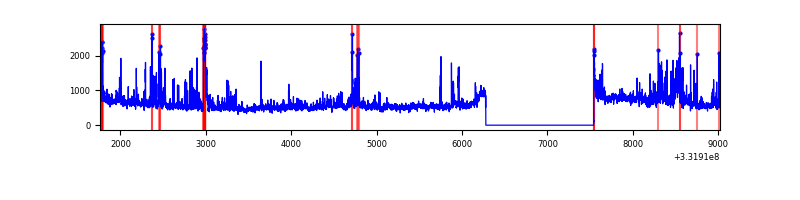 |
Top three noisy pixels from each quadrant. If the there are fewer than three noisy pixels in the level2.evt file, extra rows are filled as -1
| Pixel properties | Quadrant properties | ||||||
|---|---|---|---|---|---|---|---|
| Quadrant | DetID | PixID | Counts | Sigma | Mean | Median | Sigma |
| A | 6 | 16 | 22082 | 131.94 | 811 | 797 | 161.3 |
| A | 13 | 254 | 8475 | 47.59 | 811 | 797 | 161.3 |
| A | 0 | 226 | 7049 | 38.75 | 811 | 797 | 161.3 |
| B | 0 | 219 | 39658 | 259.81 | 789 | 773 | 149.7 |
| B | 12 | 111 | 17117 | 109.2 | 789 | 773 | 149.7 |
| B | 11 | 111 | 15626 | 99.24 | 789 | 773 | 149.7 |
| C | 14 | 238 | 122420 | 700.94 | 746 | 751 | 173.6 |
| C | 3 | 233 | 60777 | 345.81 | 746 | 751 | 173.6 |
| C | 14 | 225 | 23358 | 130.24 | 746 | 751 | 173.6 |
| D | 1 | 3 | 405775 | 2207.08 | 768 | 750 | 183.5 |
| D | 1 | 52 | 377003 | 2050.3 | 768 | 750 | 183.5 |
| D | 12 | 233 | 101402 | 548.48 | 768 | 750 | 183.5 |
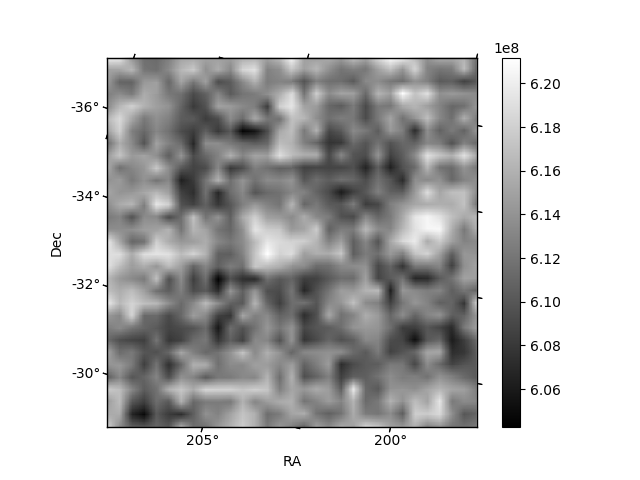
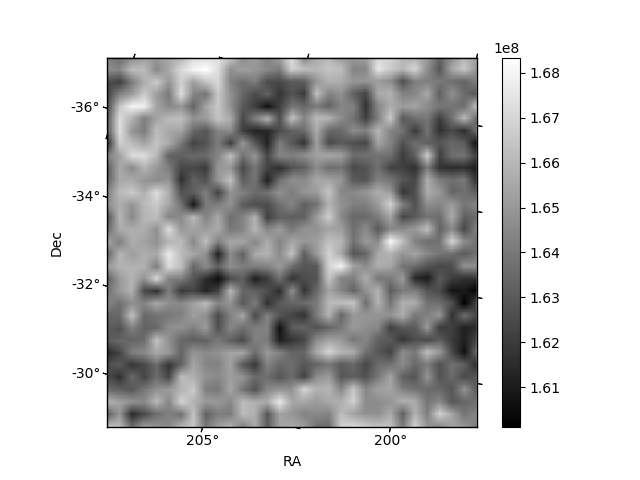
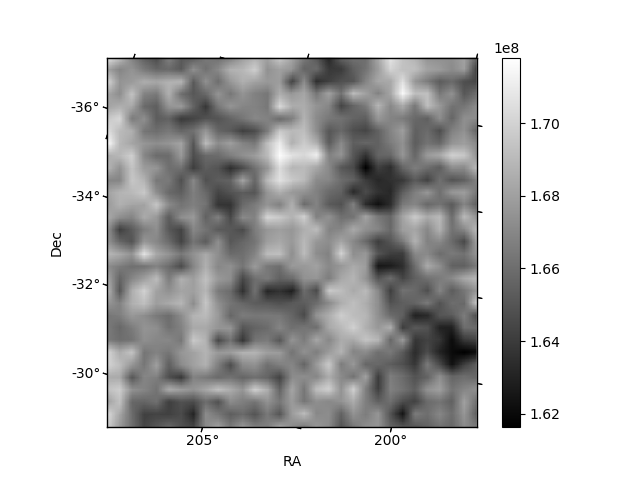
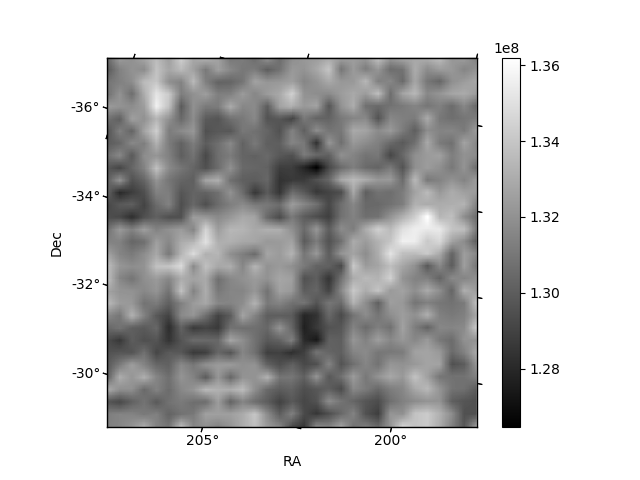
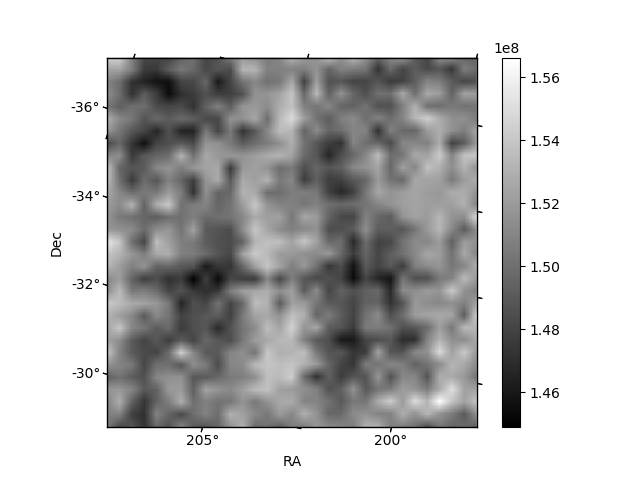
Histogram calculated using DETX and DETY for each event in the final _common_clean file
| Quadrant A | 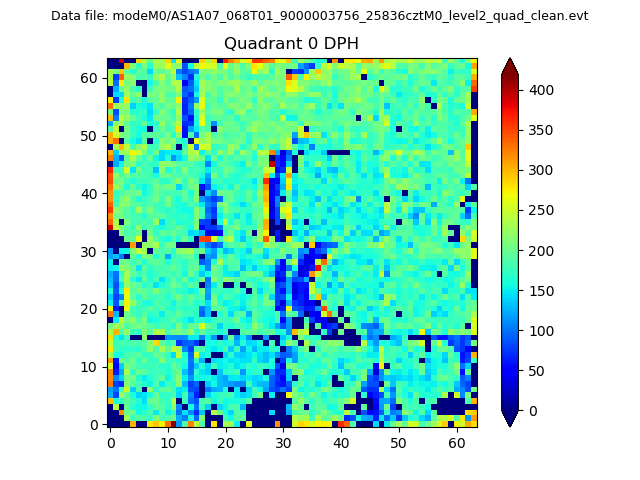 |
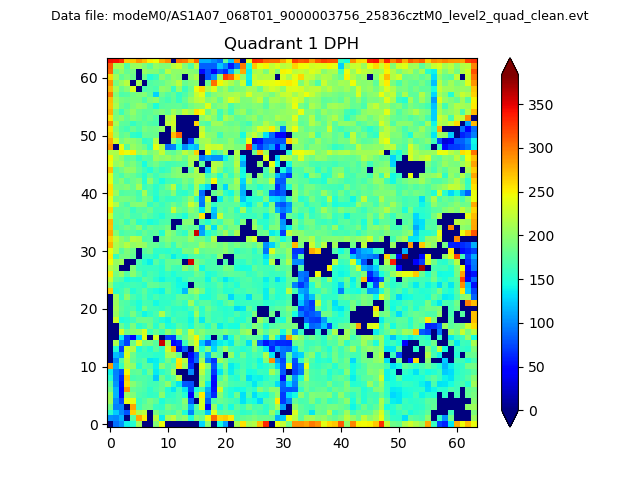 |
Quadrant B |
|---|---|---|---|
| Quadrant D |  |
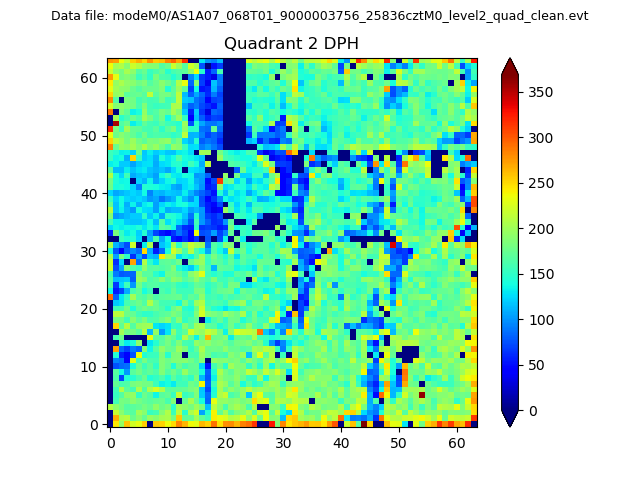 |
Quadrant C |
| Plot type | Count rate plots | Images |
|---|---|---|
| Comparison with Poisson distribution Blue bars denote a histogram of data divided into 1 sec bins. Red curve is a Poisson curve with rate = median count rate of data. |
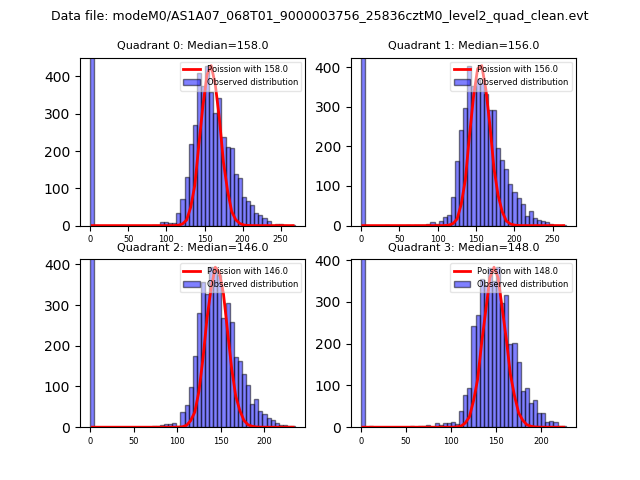 |
 |
| Quadrant-wise count rates Data is divided into 100 sec bins |
 |
|
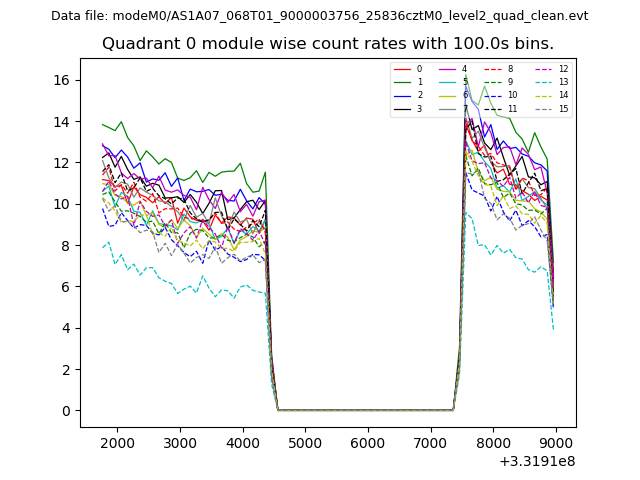
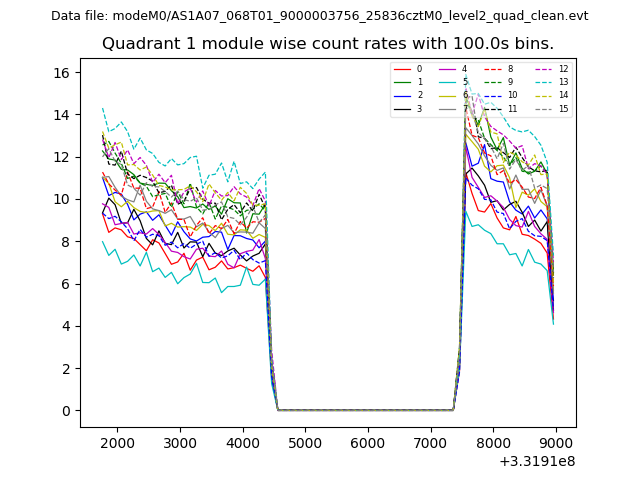
| Module-wise count rates for Quadrant A Data is divided into 100 sec bins |
 |
 |
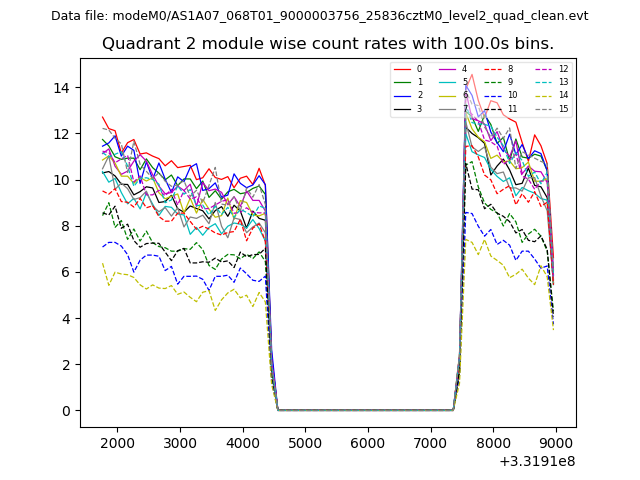
| Module-wise count rates for Quadrant B Data is divided into 100 sec bins |
 |
 |
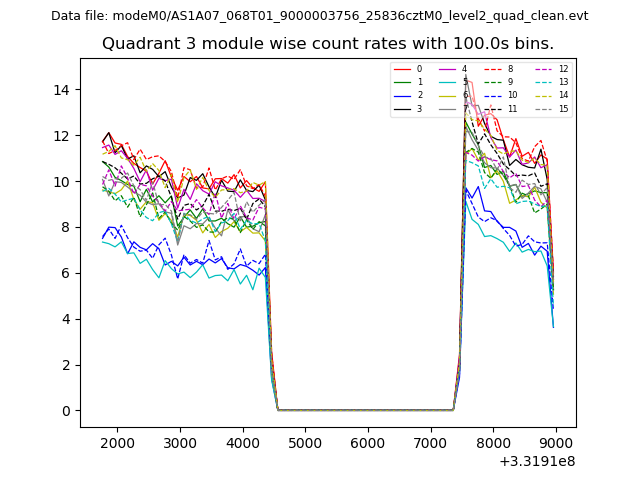
| Module-wise count rates for Quadrant C Data is divided into 100 sec bins |
 |
 |
| Module-wise count rates for Quadrant D Data is divided into 100 sec bins |
 |
 |
| Parameter | Plot |
|---|---|
| CZT HV Monitor | 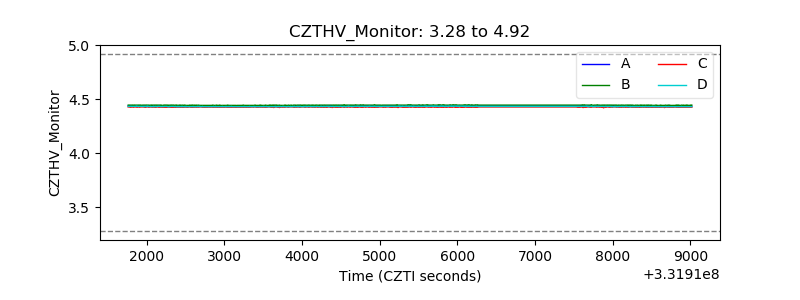 |
| D_VDD | 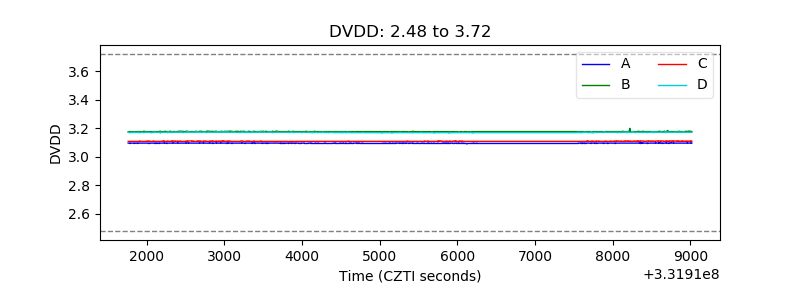 |
| Temperature 1 | 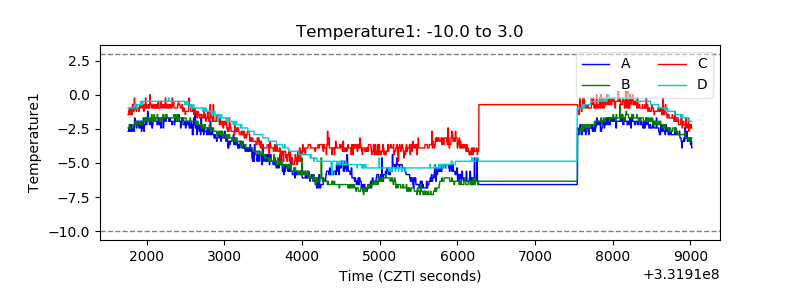 |
| Veto HV Monitor | 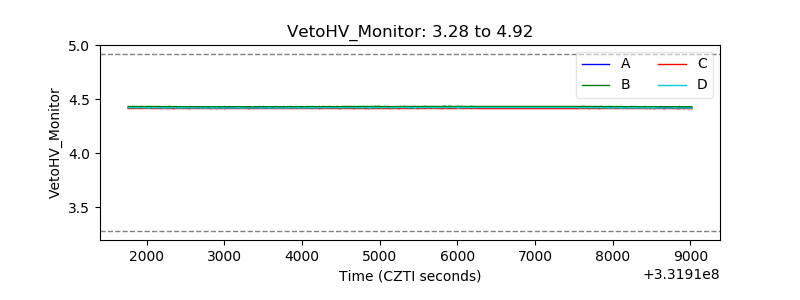 |
| Veto LLD | 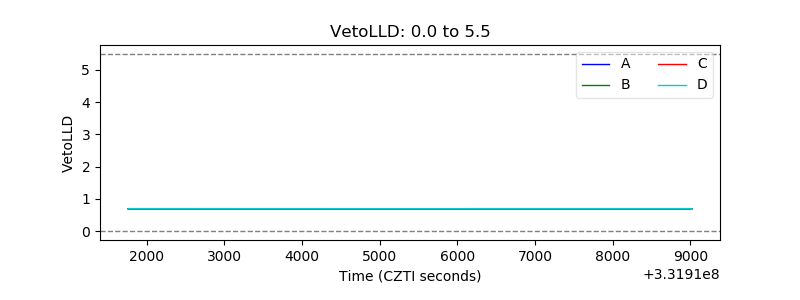 |
| Alpha Counter |  |
| _CPM_Rate | 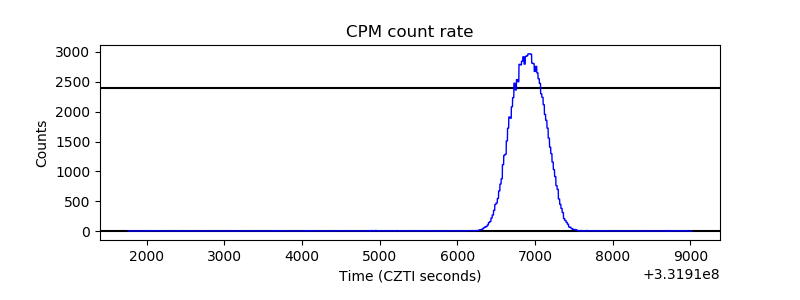 |
| CZT Counter |  |
| +2.5 Volts monitor |  |
| +5 Volts monitor |  |
| _ROLL_ROT | 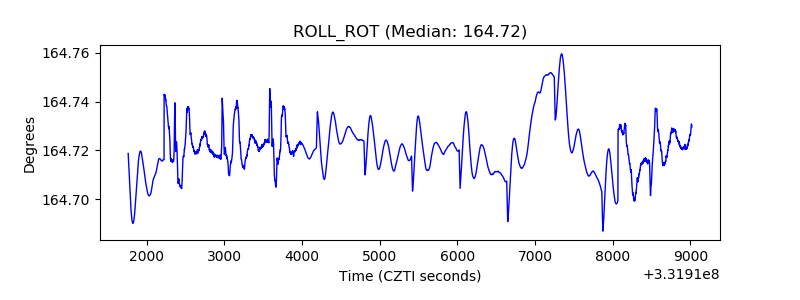 |
| _Roll_DEC | 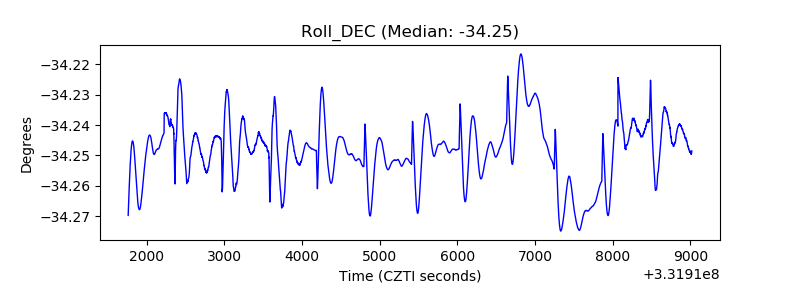 |
| _Roll_RA |  |
| Veto Counter | 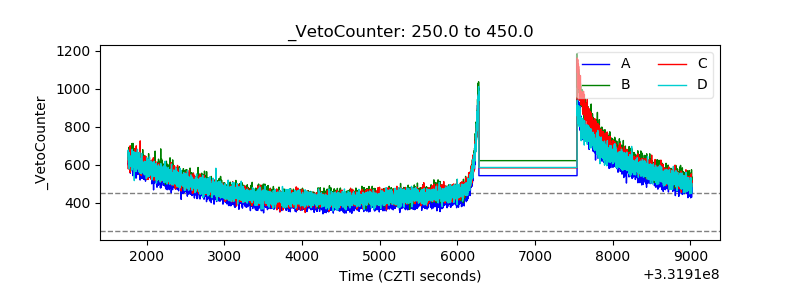 |