| Param | Original file | Final file |
|---|---|---|
| Filename | modeM0/AS1A07_068T01_9000003756_25839cztM0_level2.evt | modeM0/AS1A07_068T01_9000003756_25839cztM0_level2_quad_clean.evt |
| Size (bytes) | 1,226,361,600 | 202,515,840 |
| Size | 1.1 GB | 193.1 MB |
| Events in quadrant A | 8,230,666 | 1,317,411 |
| Events in quadrant B | 7,730,392 | 1,338,058 |
| Events in quadrant C | 7,593,334 | 1,242,832 |
| Events in quadrant D | 12,573,531 | 1,199,390 |
| Mode M0 | |||
|---|---|---|---|
| Quadrant | BADHDUFLAG | Total packets | Discarded packets |
| A | 0 | 33815 | 0 |
| B | 0 | 32257 | 0 |
| C | 0 | 32025 | 0 |
| D | 0 | 47782 | 0 |
| Mode M9 | |||
|---|---|---|---|
| Quadrant | BADHDUFLAG | Total packets | Discarded packets |
| A | 0 | 40 | 0 |
| B | 0 | 40 | 0 |
| C | 0 | 40 | 0 |
| D | 0 | 40 | 0 |
| Quadrant | Total seconds | Saturated seconds | Saturation percentage |
|---|---|---|---|
| A | 15005 | 318 | 2.119294% |
| B | 15007 | 173 | 1.152795% |
| C | 15006 | 260 | 1.732640% |
| D | 15005 | 931 | 6.204598% |
Noise dominated data is calculated using 1-second bins in cleaned event files. If a bin has >2000 counts, and if more than 50% of those come from <1% of pixels, then it is considered to be noise-dominated and hence unusable.
| Quadrant | # 1 sec bins | Bins with >0 counts | Bins with >2000 counts | High rate bins dominated by noise | Noise dominated (total time) | Noise dominated (detector-on time) | Marked lightcurve |
|---|---|---|---|---|---|---|---|
| A | 18976 | 15010 | 120 | 120 | 0.63% | 0.80% | 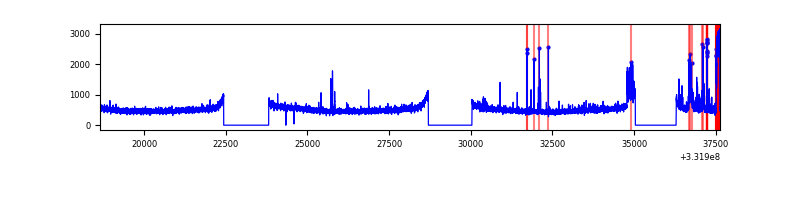 |
| B | 18977 | 15011 | 5 | 5 | 0.03% | 0.03% | 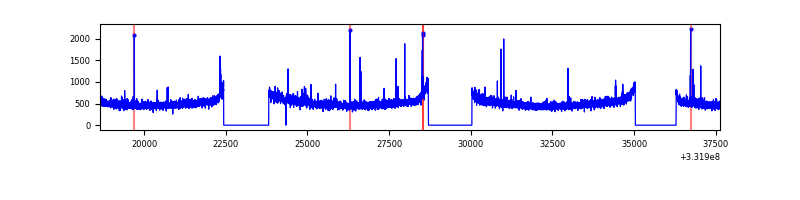 |
| C | 18977 | 15010 | 13 | 13 | 0.07% | 0.09% | 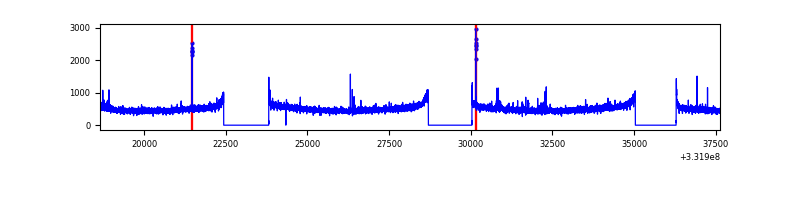 |
| D | 18977 | 15010 | 869 | 869 | 4.58% | 5.79% | 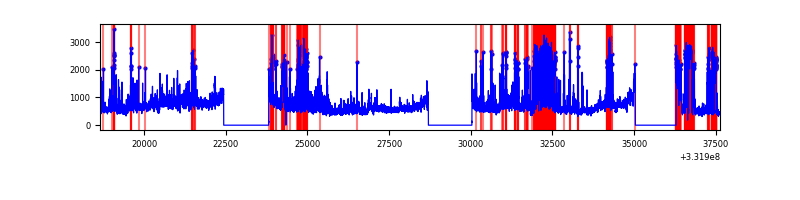 |
Top three noisy pixels from each quadrant. If the there are fewer than three noisy pixels in the level2.evt file, extra rows are filled as -1
| Pixel properties | Quadrant properties | ||||||
|---|---|---|---|---|---|---|---|
| Quadrant | DetID | PixID | Counts | Sigma | Mean | Median | Sigma |
| A | 0 | 13 | 685825 | 1767.54 | 1950 | 1918 | 386.9 |
| A | 6 | 16 | 29440 | 71.13 | 1950 | 1918 | 386.9 |
| A | 13 | 254 | 21368 | 50.27 | 1950 | 1918 | 386.9 |
| B | 0 | 219 | 48569 | 128.91 | 1934 | 1894 | 362.1 |
| B | 6 | 36 | 45067 | 119.24 | 1934 | 1894 | 362.1 |
| B | 12 | 111 | 44035 | 116.39 | 1934 | 1894 | 362.1 |
| C | 14 | 238 | 298483 | 702.1 | 1831 | 1847 | 422.5 |
| C | 3 | 233 | 121811 | 283.94 | 1831 | 1847 | 422.5 |
| C | 14 | 225 | 37028 | 83.27 | 1831 | 1847 | 422.5 |
| D | 7 | 80 | 2275665 | 5271.31 | 1818 | 1774 | 431.4 |
| D | 1 | 3 | 2256813 | 5227.61 | 1818 | 1774 | 431.4 |
| D | 1 | 52 | 821067 | 1899.28 | 1818 | 1774 | 431.4 |
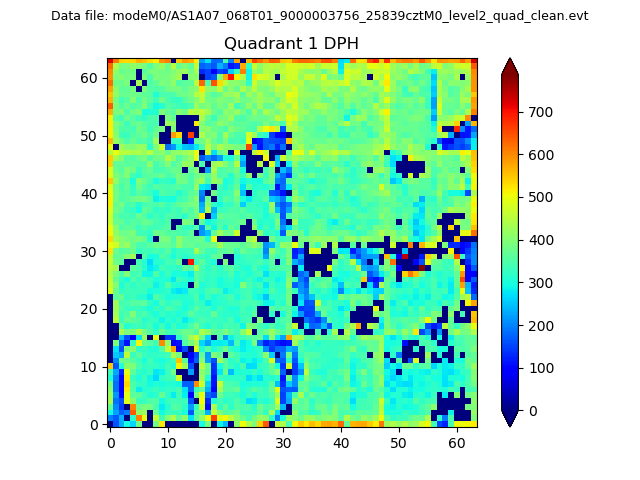
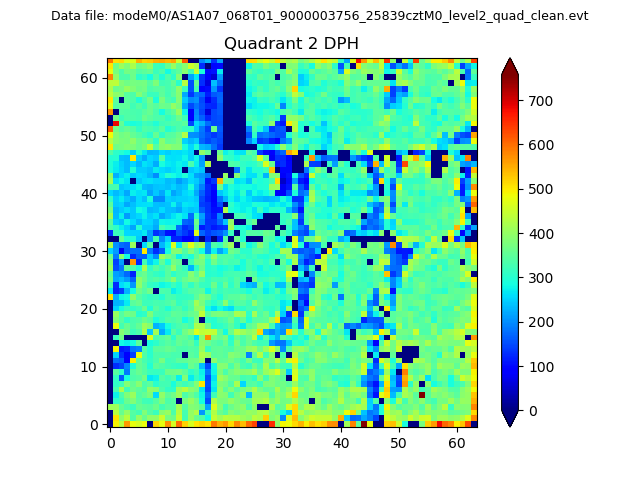
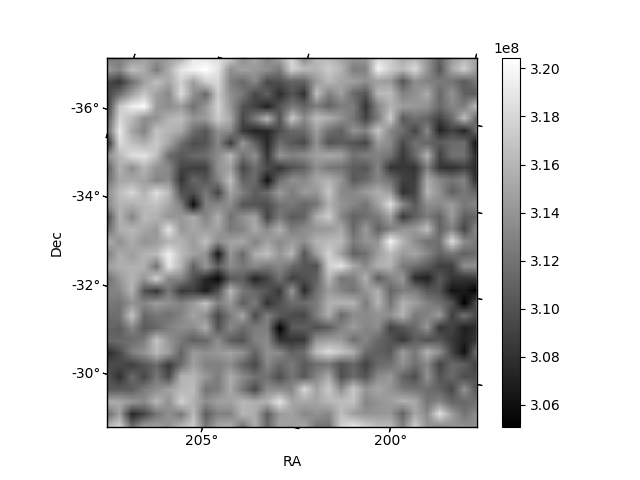
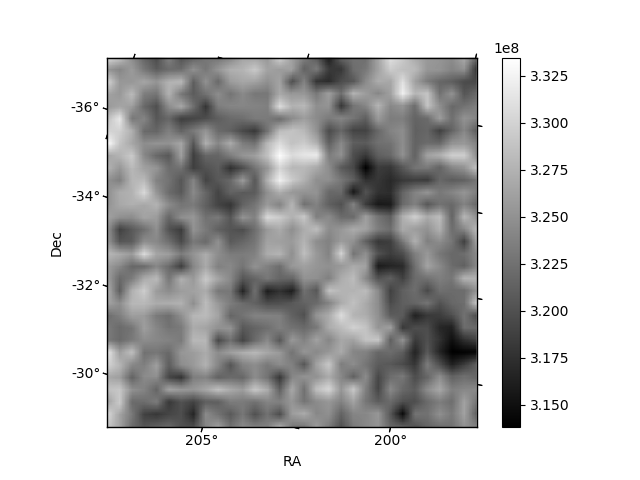
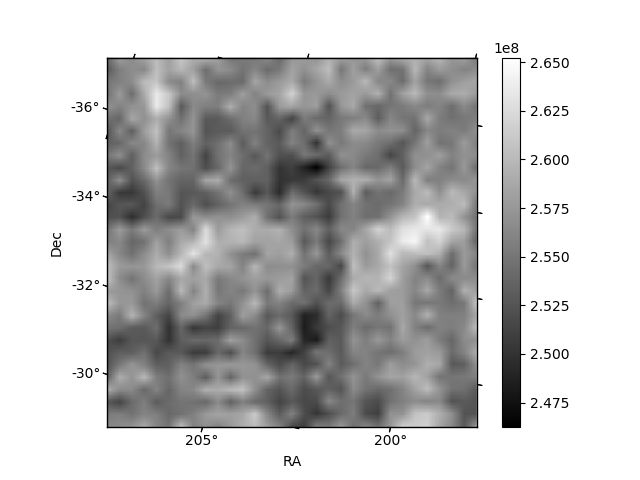
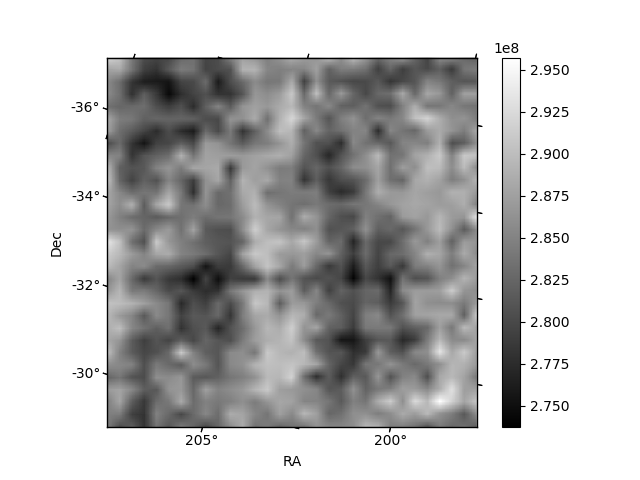
Histogram calculated using DETX and DETY for each event in the final _common_clean file
| Quadrant A |  |
 |
Quadrant B |
|---|---|---|---|
| Quadrant D | 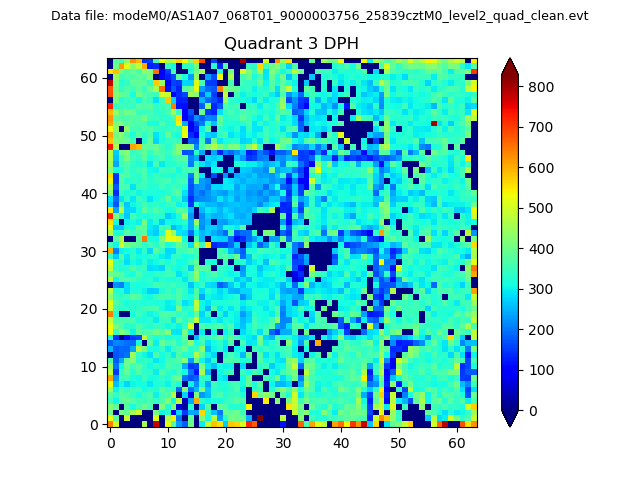 |
 |
Quadrant C |
| Plot type | Count rate plots | Images |
|---|---|---|
| Comparison with Poisson distribution Blue bars denote a histogram of data divided into 1 sec bins. Red curve is a Poisson curve with rate = median count rate of data. |
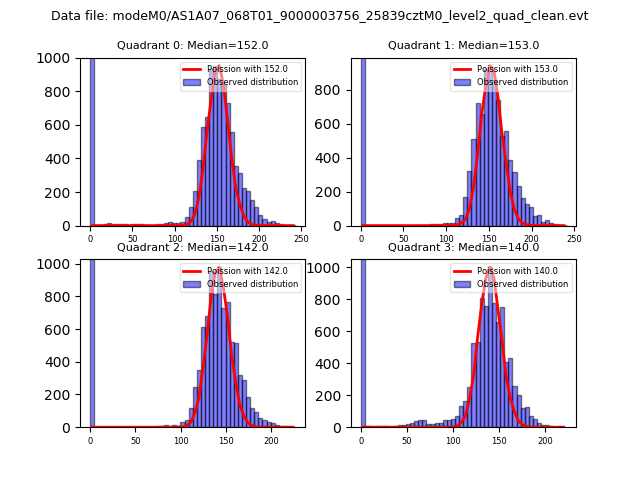 |
 |
| Quadrant-wise count rates Data is divided into 100 sec bins |
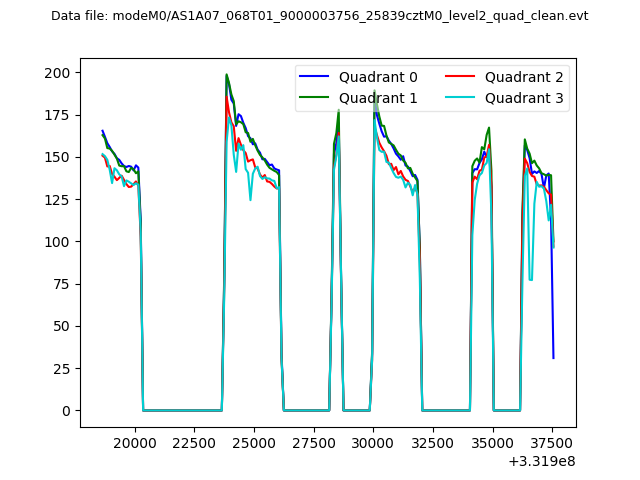 |
|
| Module-wise count rates for Quadrant A Data is divided into 100 sec bins |
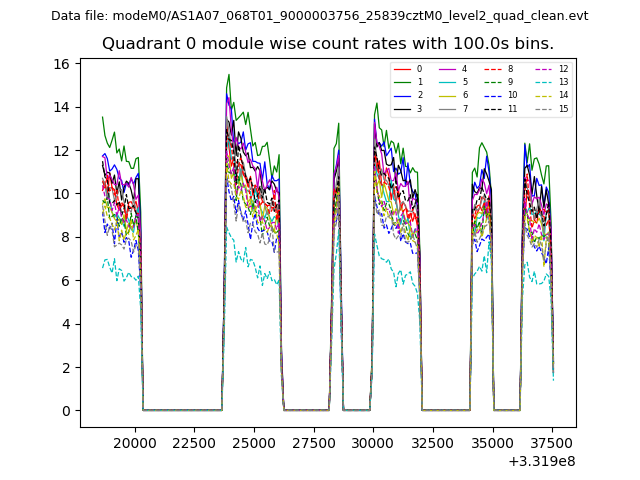 |
 |
| Module-wise count rates for Quadrant B Data is divided into 100 sec bins |
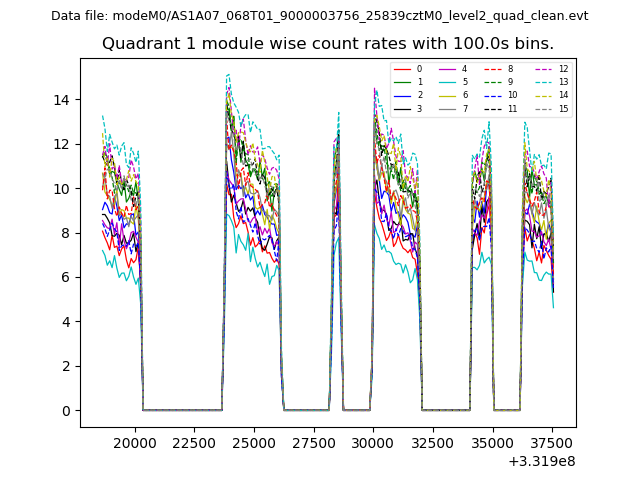 |
 |
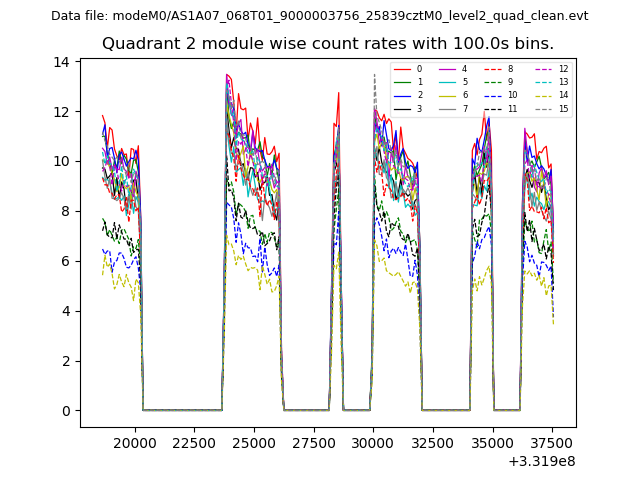
| Module-wise count rates for Quadrant C Data is divided into 100 sec bins |
 |
 |
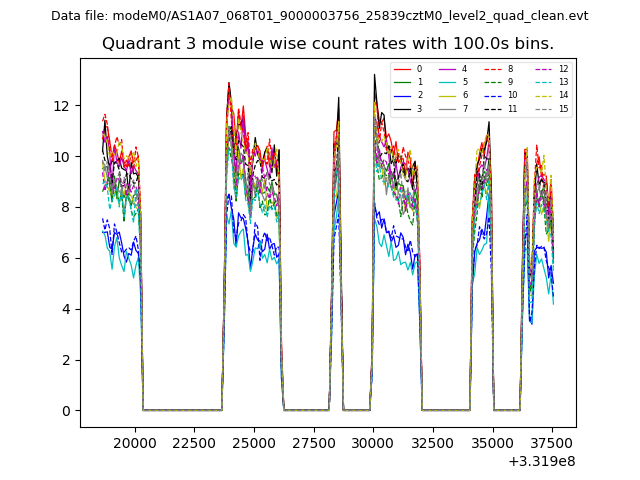
| Module-wise count rates for Quadrant D Data is divided into 100 sec bins |
 |
 |
| Parameter | Plot |
|---|---|
| CZT HV Monitor | 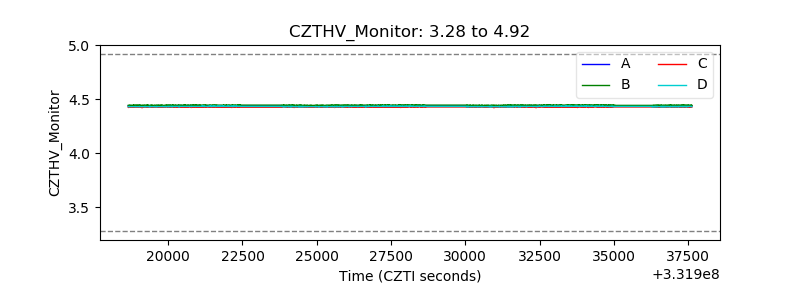 |
| D_VDD | 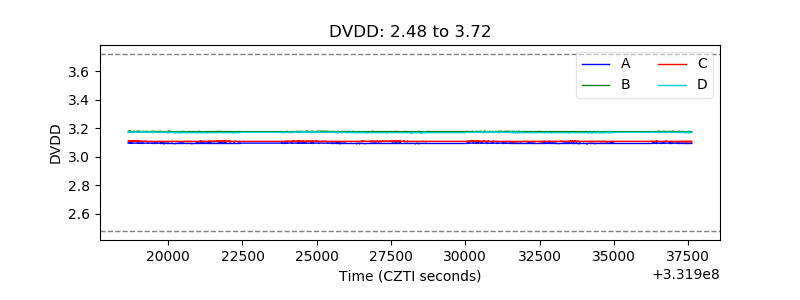 |
| Temperature 1 | 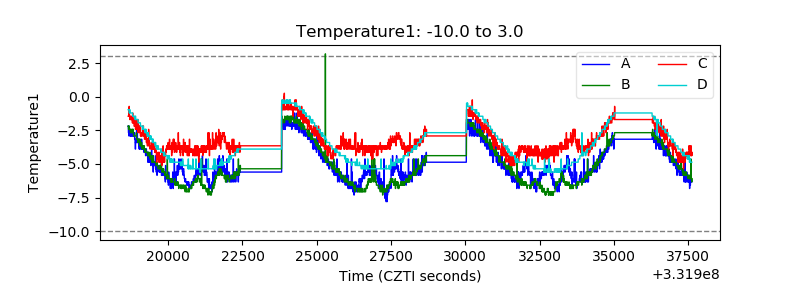 |
| Veto HV Monitor |  |
| Veto LLD | 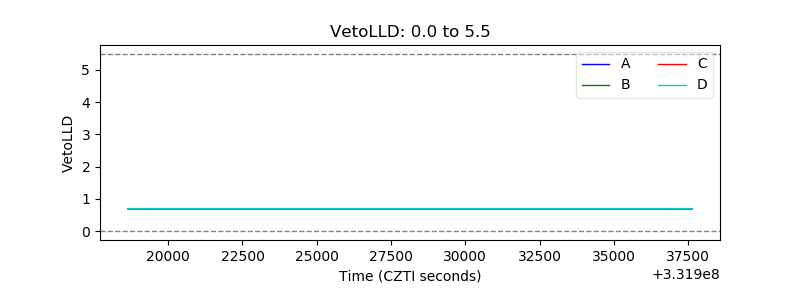 |
| Alpha Counter | 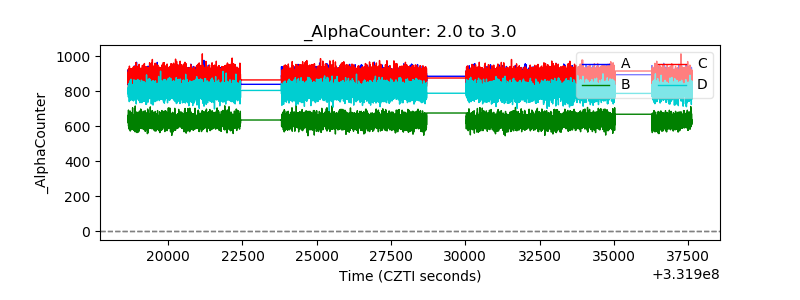 |
| _CPM_Rate | 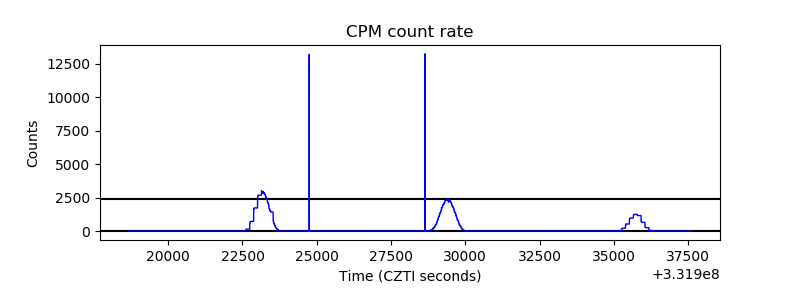 |
| CZT Counter | 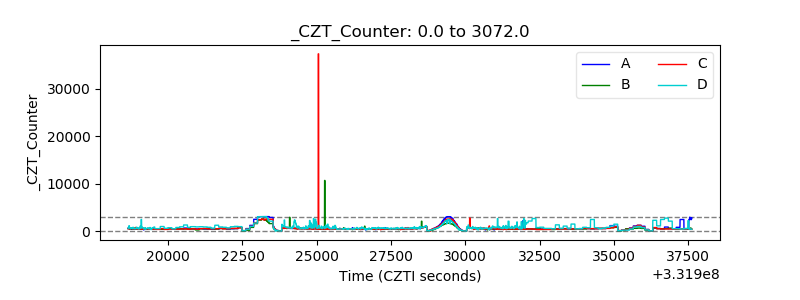 |
| +2.5 Volts monitor |  |
| +5 Volts monitor | 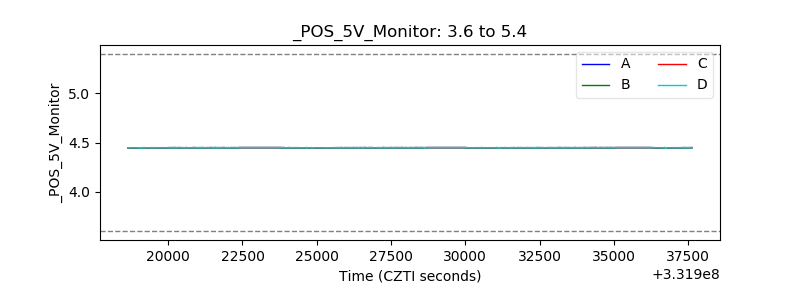 |
| _ROLL_ROT | 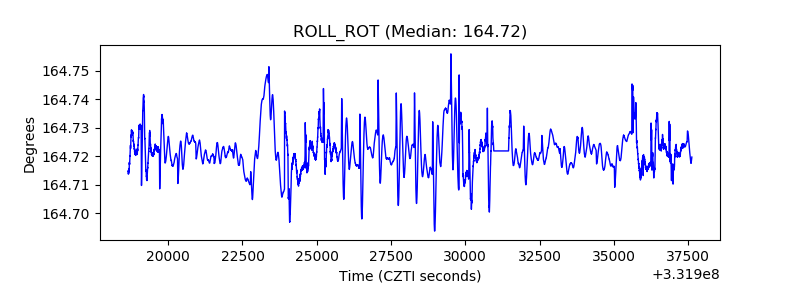 |
| _Roll_DEC | 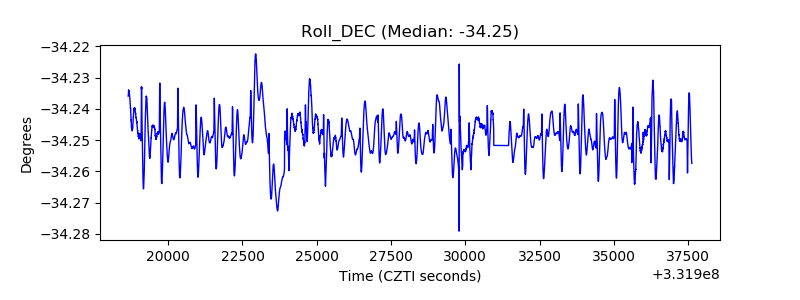 |
| _Roll_RA |  |
| Veto Counter | 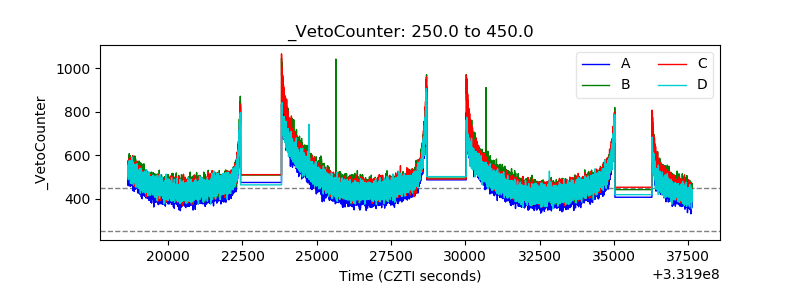 |