| Param | Original file | Final file |
|---|---|---|
| Filename | modeM0/AS1A07_068T01_9000003756_25840cztM0_level2.evt | modeM0/AS1A07_068T01_9000003756_25840cztM0_level2_quad_clean.evt |
| Size (bytes) | 523,264,320 | 93,096,000 |
| Size | 499.0 MB | 88.8 MB |
| Events in quadrant A | 4,662,506 | 595,860 |
| Events in quadrant B | 3,252,259 | 618,483 |
| Events in quadrant C | 3,231,050 | 580,647 |
| Events in quadrant D | 4,247,988 | 558,445 |
| Mode M0 | |||
|---|---|---|---|
| Quadrant | BADHDUFLAG | Total packets | Discarded packets |
| A | 0 | 18105 | 0 |
| B | 0 | 13853 | 0 |
| C | 0 | 13830 | 0 |
| D | 0 | 17175 | 0 |
| Mode M9 | |||
|---|---|---|---|
| Quadrant | BADHDUFLAG | Total packets | Discarded packets |
| A | 0 | 17 | 0 |
| B | 0 | 18 | 0 |
| C | 0 | 18 | 0 |
| D | 0 | 18 | 0 |
| Quadrant | Total seconds | Saturated seconds | Saturation percentage |
|---|---|---|---|
| A | 6685 | 335 | 5.011219% |
| B | 6685 | 34 | 0.508601% |
| C | 6685 | 53 | 0.792820% |
| D | 6685 | 320 | 4.786836% |
Noise dominated data is calculated using 1-second bins in cleaned event files. If a bin has >2000 counts, and if more than 50% of those come from <1% of pixels, then it is considered to be noise-dominated and hence unusable.
| Quadrant | # 1 sec bins | Bins with >0 counts | Bins with >2000 counts | High rate bins dominated by noise | Noise dominated (total time) | Noise dominated (detector-on time) | Marked lightcurve |
|---|---|---|---|---|---|---|---|
| A | 7645 | 6686 | 339 | 339 | 4.43% | 5.07% | 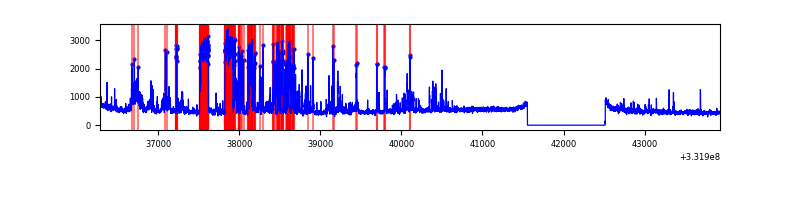 |
| B | 7645 | 6686 | 1 | 1 | 0.01% | 0.01% | 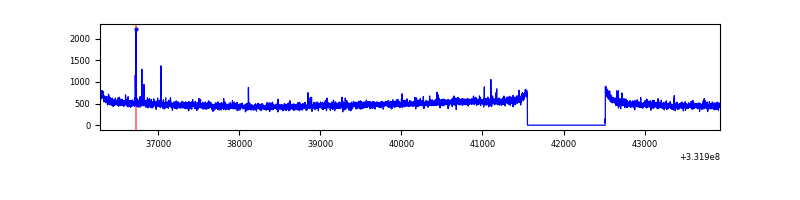 |
| C | 7645 | 6686 | 0 | 0 | 0.00% | 0.00% | 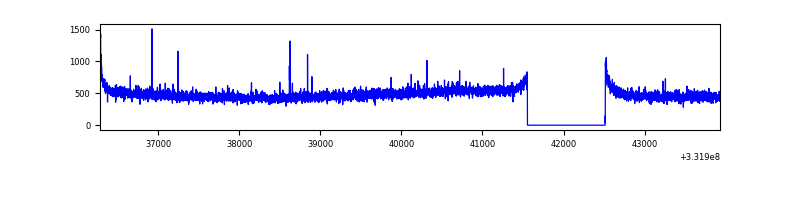 |
| D | 7645 | 6686 | 360 | 360 | 4.71% | 5.38% | 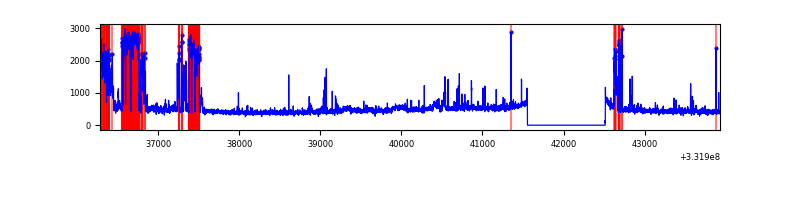 |
Top three noisy pixels from each quadrant. If the there are fewer than three noisy pixels in the level2.evt file, extra rows are filled as -1
| Pixel properties | Quadrant properties | ||||||
|---|---|---|---|---|---|---|---|
| Quadrant | DetID | PixID | Counts | Sigma | Mean | Median | Sigma |
| A | 0 | 13 | 1518830 | 9294.59 | 812 | 796 | 163.3 |
| A | 13 | 254 | 10130 | 57.15 | 812 | 796 | 163.3 |
| A | 6 | 16 | 9851 | 55.44 | 812 | 796 | 163.3 |
| B | 12 | 111 | 19118 | 115.53 | 824 | 803 | 158.5 |
| B | 11 | 111 | 17301 | 104.07 | 824 | 803 | 158.5 |
| B | 14 | 111 | 15649 | 93.65 | 824 | 803 | 158.5 |
| C | 14 | 238 | 126323 | 680.59 | 782 | 787 | 184.5 |
| C | 3 | 233 | 51830 | 276.73 | 782 | 787 | 184.5 |
| C | 13 | 61 | 5371 | 24.85 | 782 | 787 | 184.5 |
| D | 1 | 3 | 1032389 | 5527.57 | 777 | 759 | 186.6 |
| D | 1 | 52 | 178817 | 954.05 | 777 | 759 | 186.6 |
| D | 7 | 80 | 47267 | 249.19 | 777 | 759 | 186.6 |
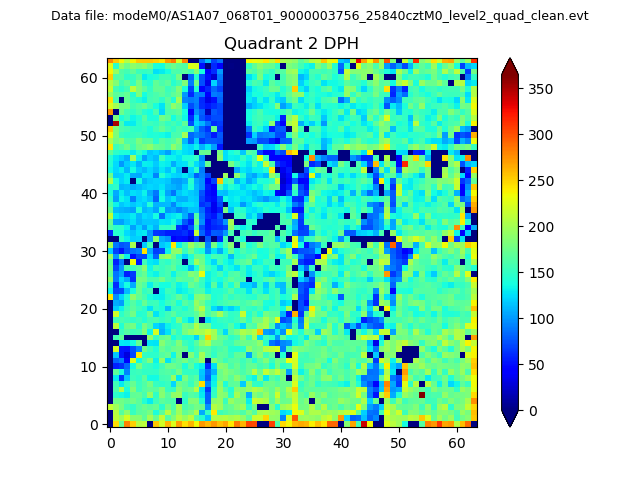
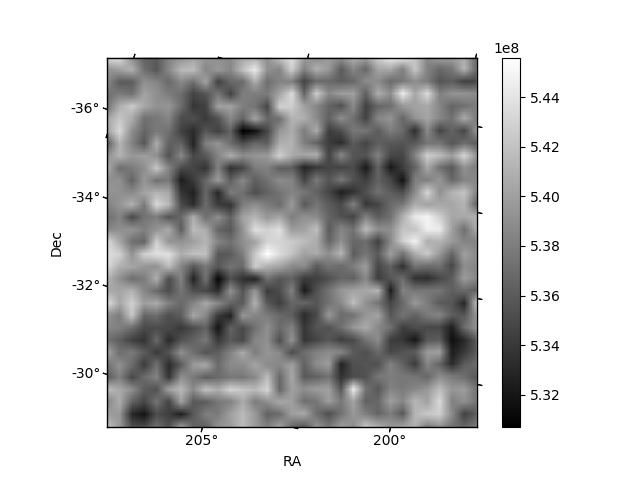
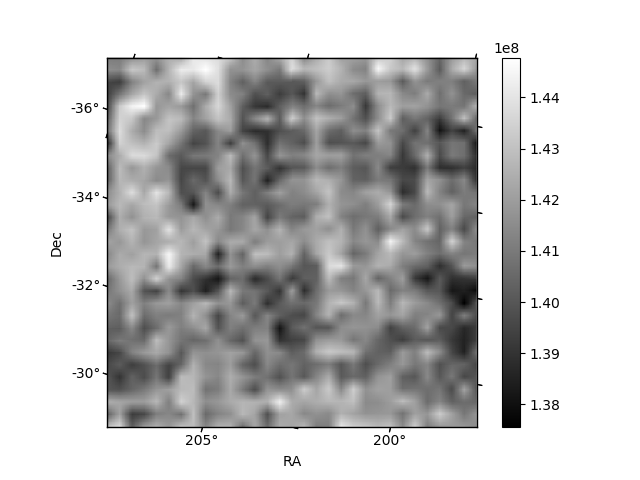
Histogram calculated using DETX and DETY for each event in the final _common_clean file
| Quadrant A | 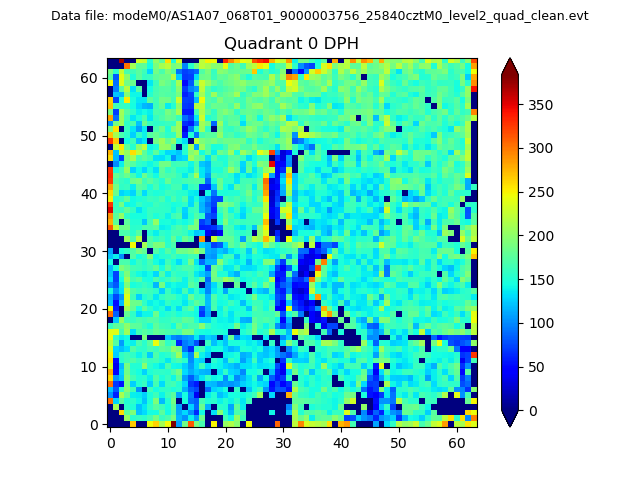 |
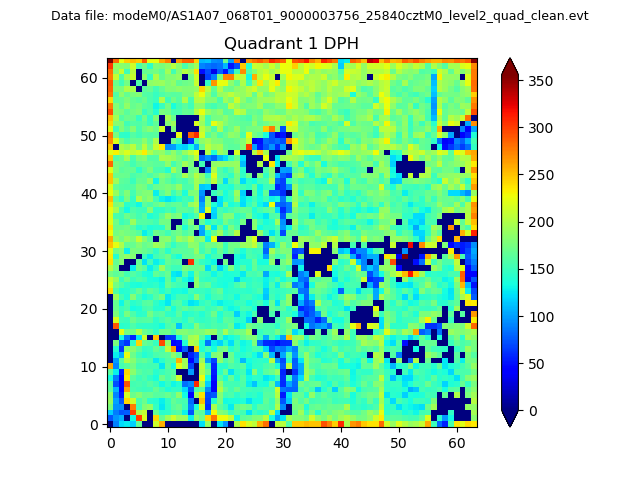 |
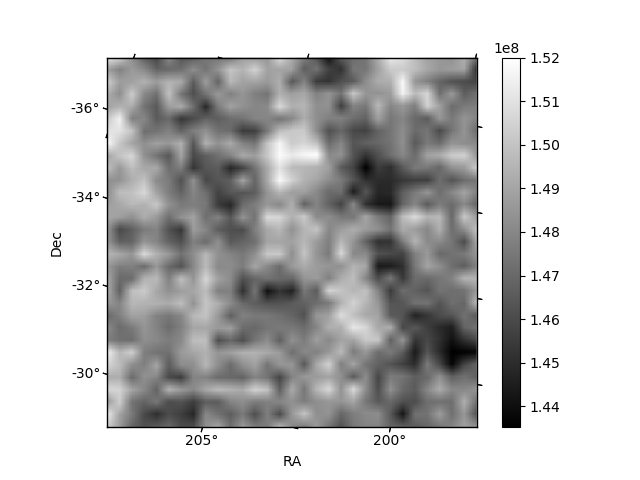
Quadrant B |
|---|---|---|---|
| Quadrant D | 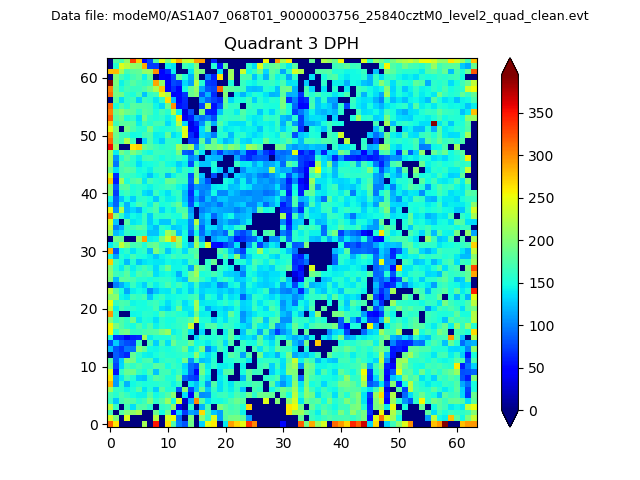 |
 |
Quadrant C |
| Plot type | Count rate plots | Images |
|---|---|---|
| Comparison with Poisson distribution Blue bars denote a histogram of data divided into 1 sec bins. Red curve is a Poisson curve with rate = median count rate of data. |
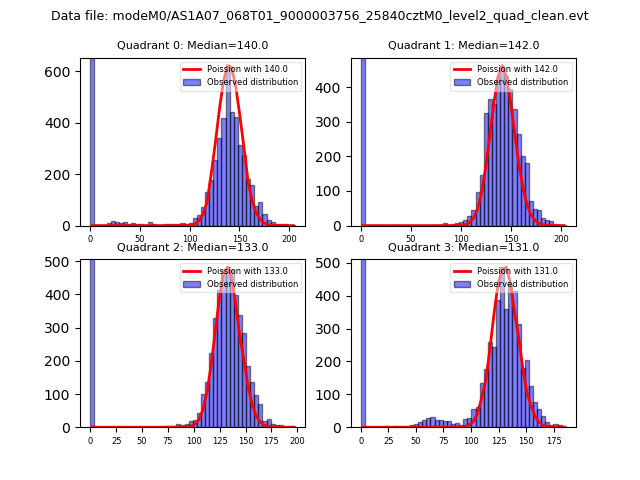 |
 |
| Quadrant-wise count rates Data is divided into 100 sec bins |
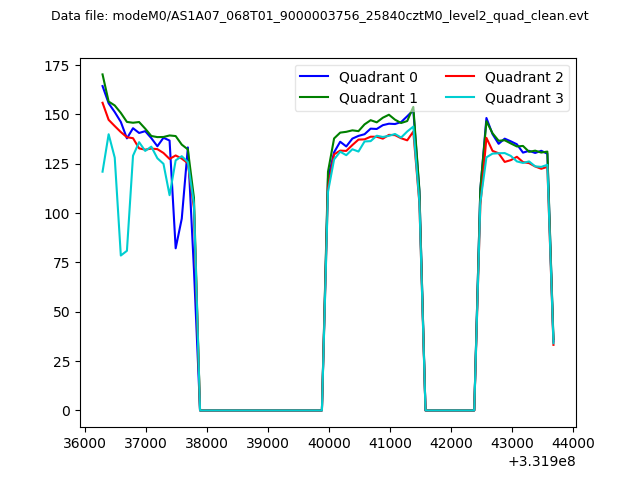 |
|
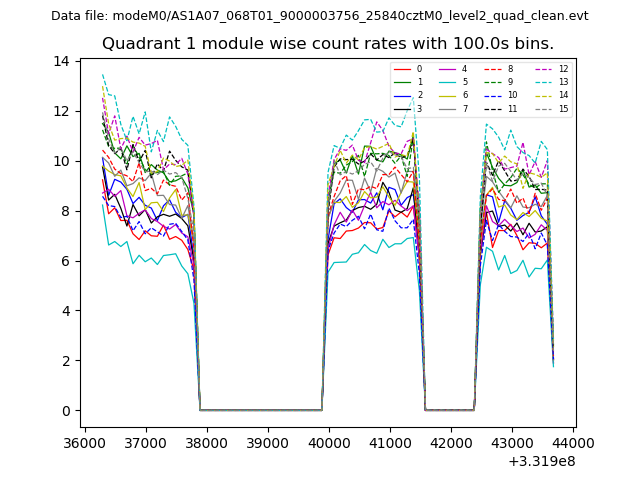
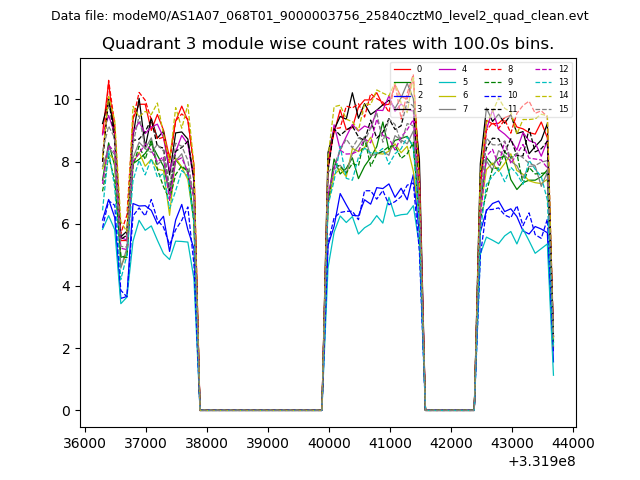
| Module-wise count rates for Quadrant A Data is divided into 100 sec bins |
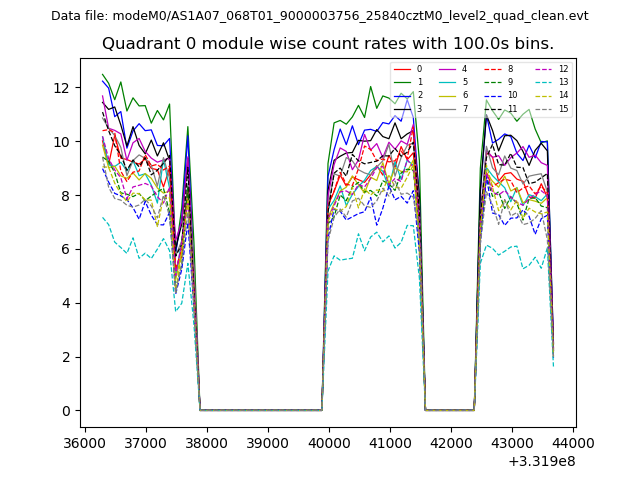 |
 |
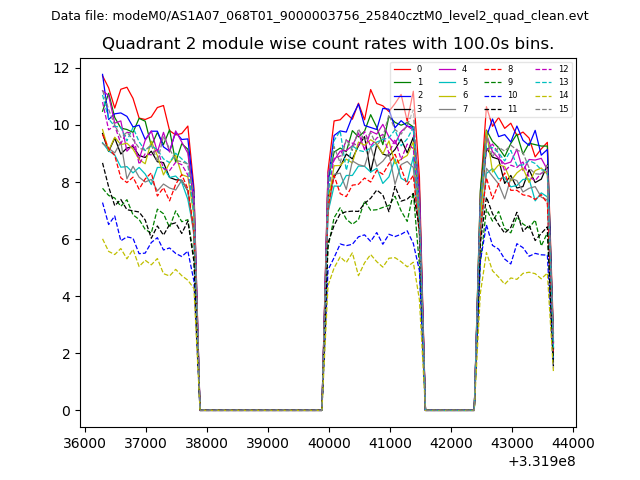
| Module-wise count rates for Quadrant B Data is divided into 100 sec bins |
 |
 |
| Module-wise count rates for Quadrant C Data is divided into 100 sec bins |
 |
 |
| Module-wise count rates for Quadrant D Data is divided into 100 sec bins |
 |
 |
| Parameter | Plot |
|---|---|
| CZT HV Monitor | 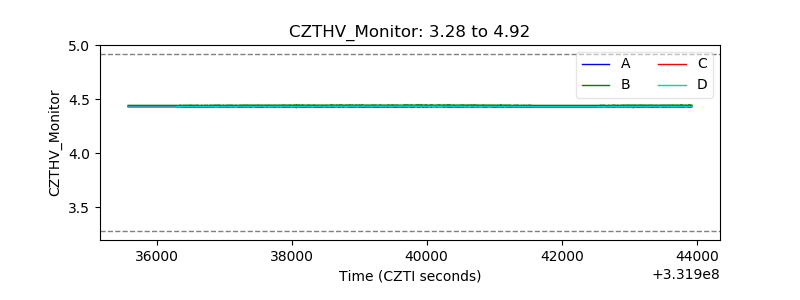 |
| D_VDD | 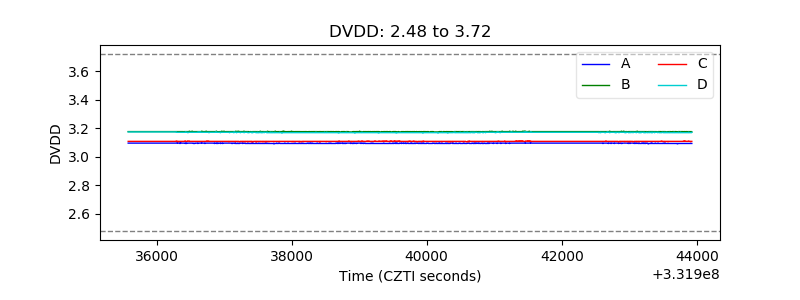 |
| Temperature 1 | 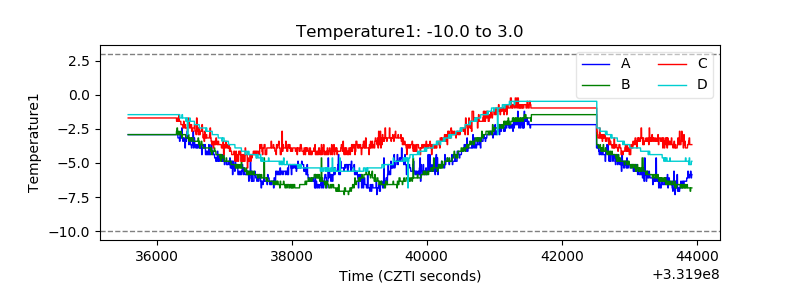 |
| Veto HV Monitor | 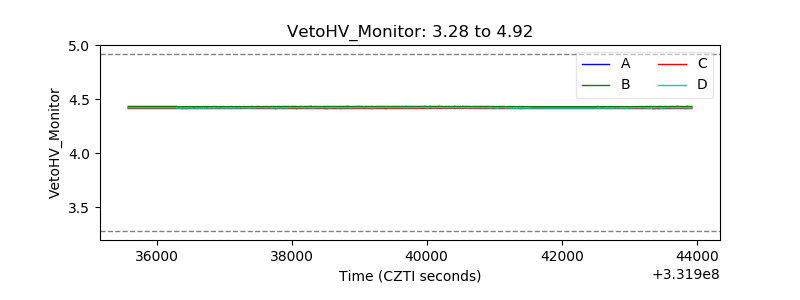 |
| Veto LLD | 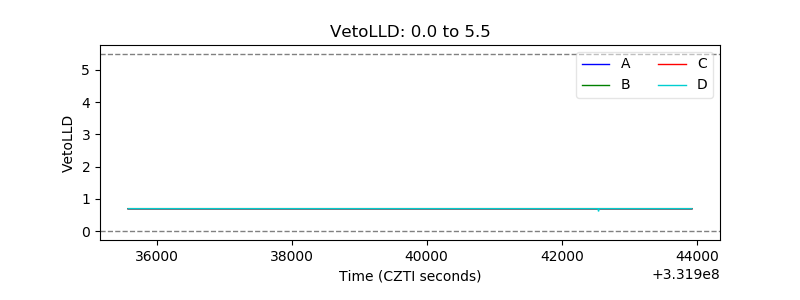 |
| Alpha Counter | 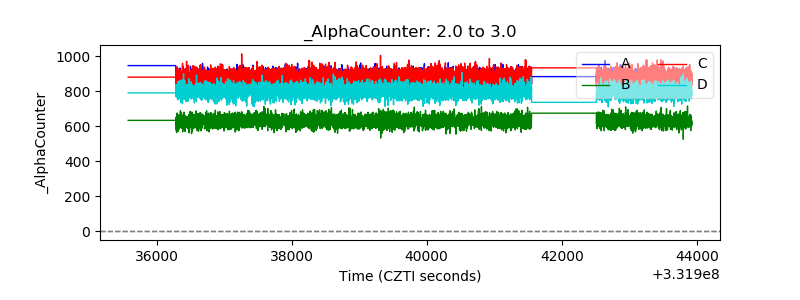 |
| _CPM_Rate | 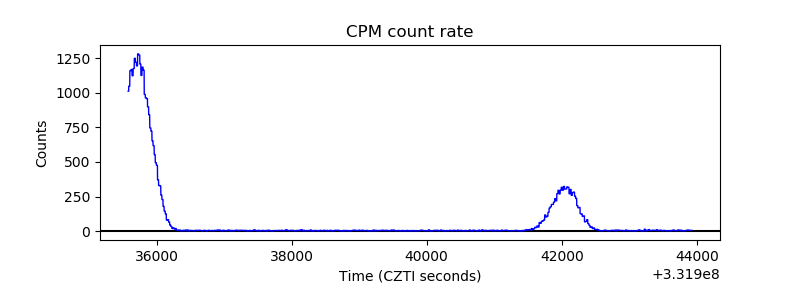 |
| CZT Counter | 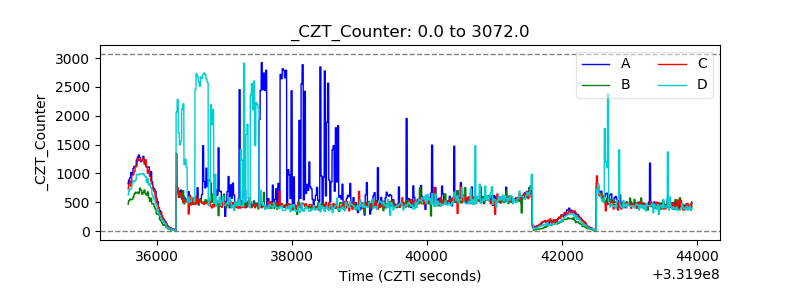 |
| +2.5 Volts monitor |  |
| +5 Volts monitor |  |
| _ROLL_ROT | 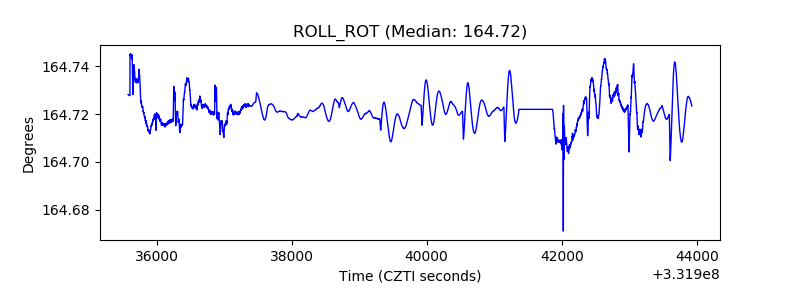 |
| _Roll_DEC | 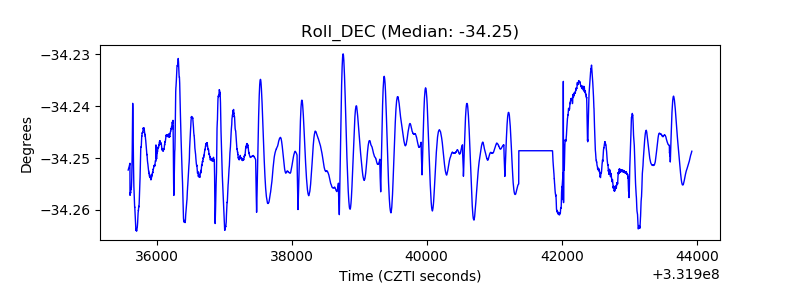 |
| _Roll_RA | 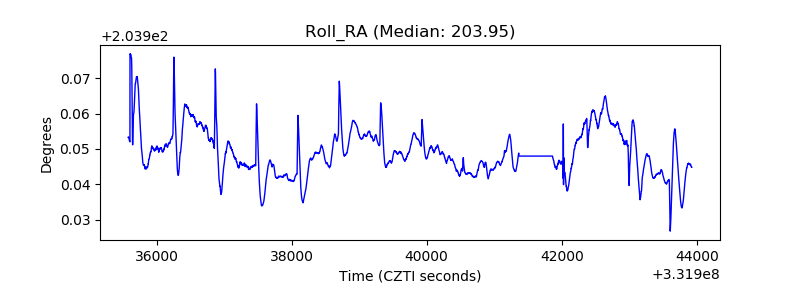 |
| Veto Counter | 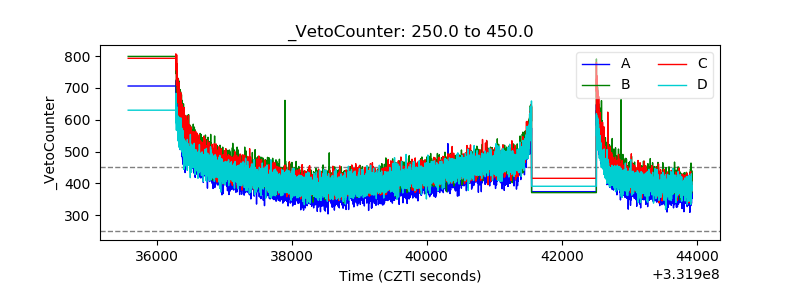 |