| Param | Original file | Final file |
|---|---|---|
| Filename | modeM0/AS1A07_068T01_9000003756_25841cztM0_level2.evt | modeM0/AS1A07_068T01_9000003756_25841cztM0_level2_quad_clean.evt |
| Size (bytes) | 468,967,680 | 92,131,200 |
| Size | 447.2 MB | 87.9 MB |
| Events in quadrant A | 3,407,654 | 588,398 |
| Events in quadrant B | 3,378,738 | 592,675 |
| Events in quadrant C | 3,347,664 | 559,683 |
| Events in quadrant D | 3,591,481 | 560,071 |
| Mode M0 | |||
|---|---|---|---|
| Quadrant | BADHDUFLAG | Total packets | Discarded packets |
| A | 0 | 14628 | 0 |
| B | 0 | 14500 | 0 |
| C | 0 | 14463 | 0 |
| D | 0 | 15580 | 0 |
| Mode M9 | |||
|---|---|---|---|
| Quadrant | BADHDUFLAG | Total packets | Discarded packets |
| A | 0 | 12 | 0 |
| B | 0 | 13 | 0 |
| C | 0 | 13 | 0 |
| D | 0 | 13 | 0 |
| Quadrant | Total seconds | Saturated seconds | Saturation percentage |
|---|---|---|---|
| A | 7024 | 34 | 0.484055% |
| B | 7024 | 37 | 0.526765% |
| C | 7024 | 54 | 0.768793% |
| D | 7024 | 42 | 0.597950% |
Noise dominated data is calculated using 1-second bins in cleaned event files. If a bin has >2000 counts, and if more than 50% of those come from <1% of pixels, then it is considered to be noise-dominated and hence unusable.
| Quadrant | # 1 sec bins | Bins with >0 counts | Bins with >2000 counts | High rate bins dominated by noise | Noise dominated (total time) | Noise dominated (detector-on time) | Marked lightcurve |
|---|---|---|---|---|---|---|---|
| A | 7614 | 7025 | 7 | 7 | 0.09% | 0.10% | 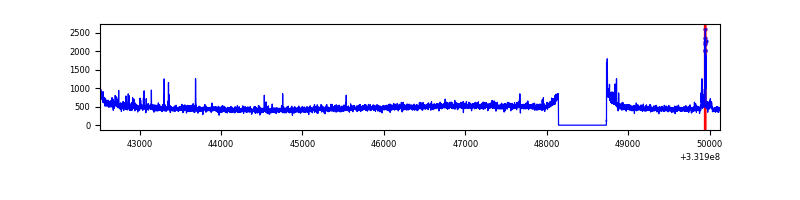 |
| B | 7614 | 7025 | 0 | 0 | 0.00% | 0.00% | 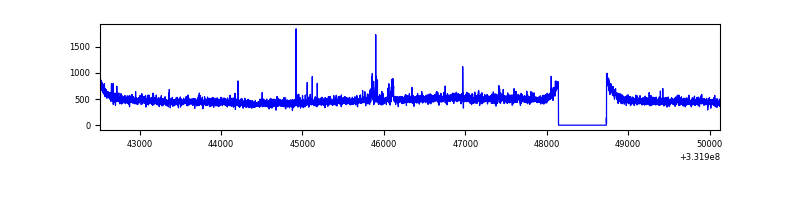 |
| C | 7614 | 7025 | 3 | 3 | 0.04% | 0.04% | 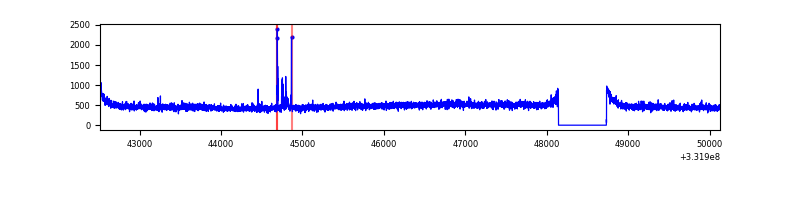 |
| D | 7614 | 7025 | 26 | 26 | 0.34% | 0.37% | 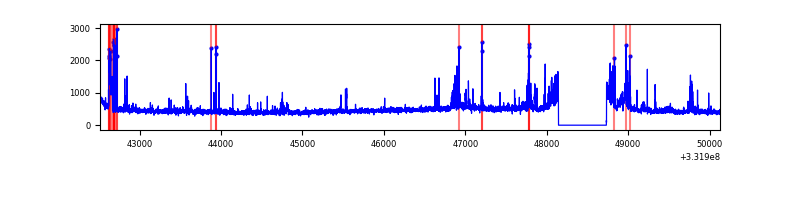 |
Top three noisy pixels from each quadrant. If the there are fewer than three noisy pixels in the level2.evt file, extra rows are filled as -1
| Pixel properties | Quadrant properties | ||||||
|---|---|---|---|---|---|---|---|
| Quadrant | DetID | PixID | Counts | Sigma | Mean | Median | Sigma |
| A | 0 | 13 | 93828 | 540.45 | 857 | 839 | 172.1 |
| A | 13 | 254 | 10572 | 56.57 | 857 | 839 | 172.1 |
| A | 3 | 137 | 8093 | 42.16 | 857 | 839 | 172.1 |
| B | 6 | 36 | 29397 | 174.09 | 852 | 831 | 164.1 |
| B | 12 | 111 | 20195 | 118.01 | 852 | 831 | 164.1 |
| B | 11 | 111 | 18196 | 105.83 | 852 | 831 | 164.1 |
| C | 14 | 238 | 128026 | 664.24 | 811 | 814 | 191.5 |
| C | 14 | 225 | 38160 | 195.0 | 811 | 814 | 191.5 |
| C | 3 | 233 | 24897 | 125.75 | 811 | 814 | 191.5 |
| D | 1 | 52 | 295584 | 1504.35 | 819 | 799 | 196.0 |
| D | 7 | 80 | 74779 | 377.53 | 819 | 799 | 196.0 |
| D | 1 | 3 | 68795 | 347.0 | 819 | 799 | 196.0 |
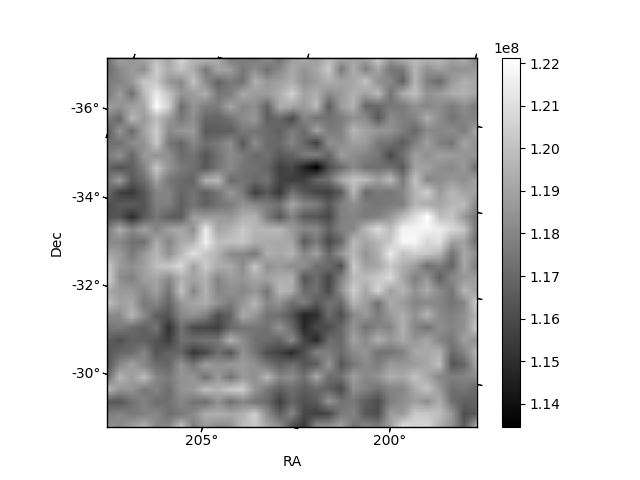
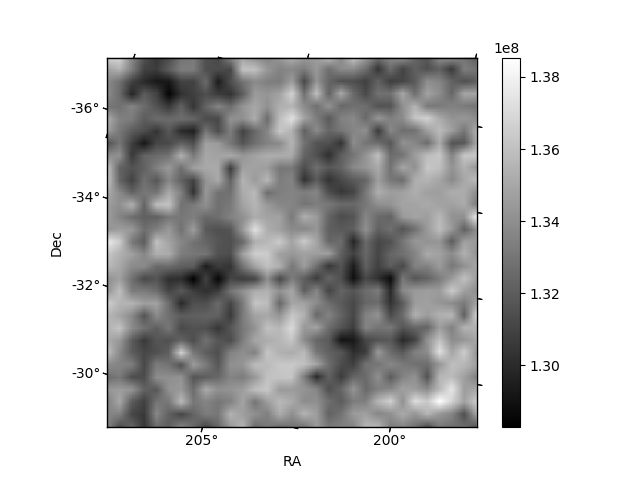
Histogram calculated using DETX and DETY for each event in the final _common_clean file
| Quadrant A | 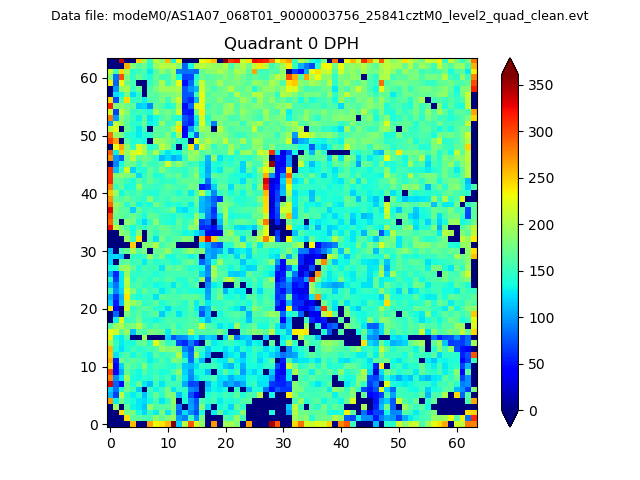 |
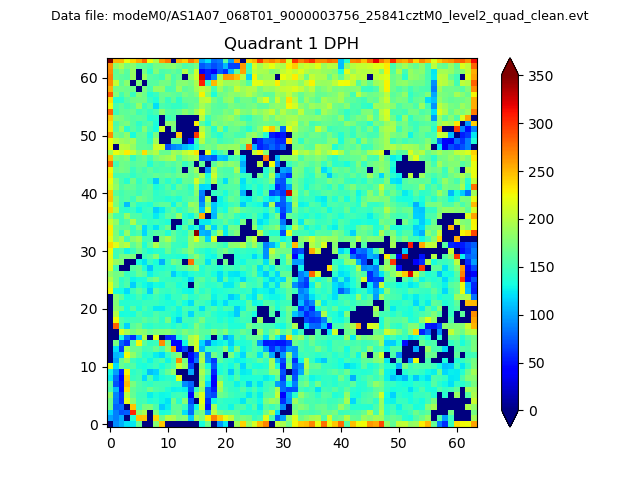 |
Quadrant B |
|---|---|---|---|
| Quadrant D | 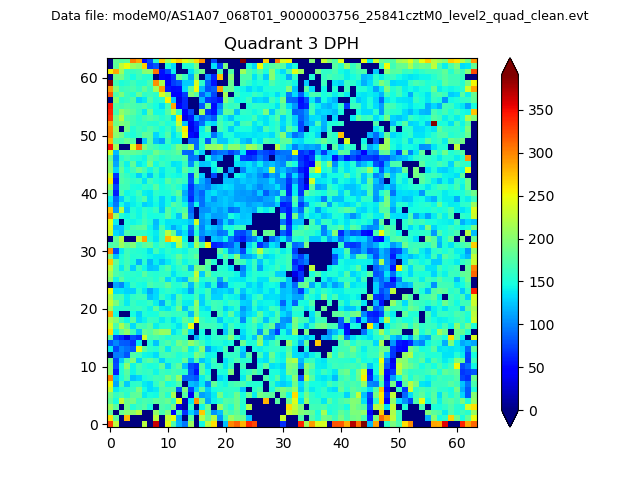 |
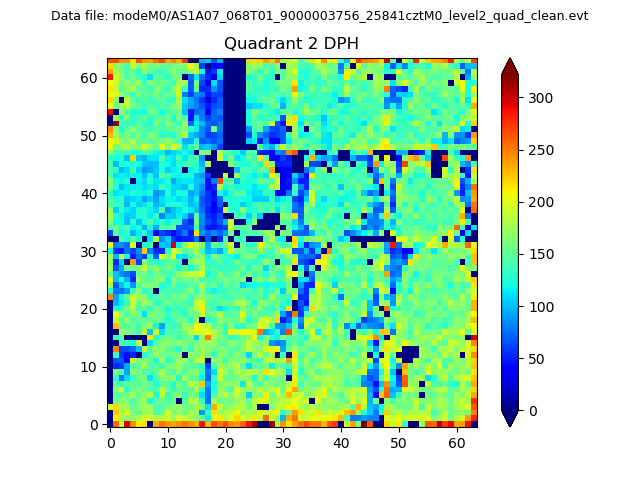 |
Quadrant C |
| Plot type | Count rate plots | Images |
|---|---|---|
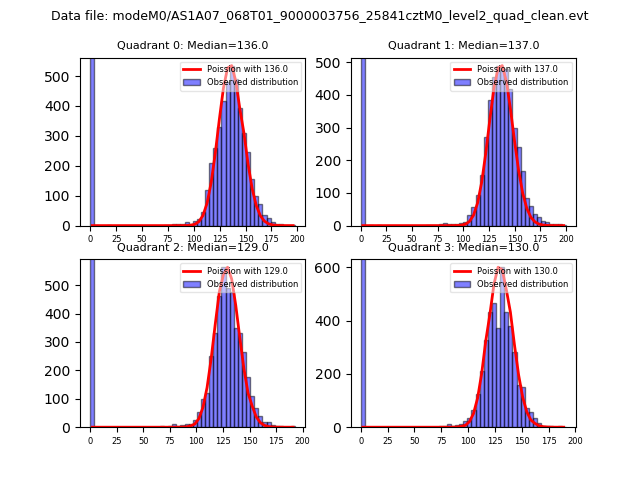
| Comparison with Poisson distribution Blue bars denote a histogram of data divided into 1 sec bins. Red curve is a Poisson curve with rate = median count rate of data. |
 |
 |
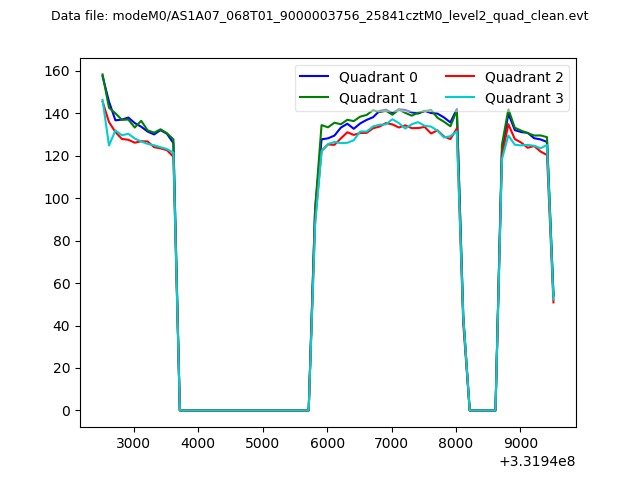
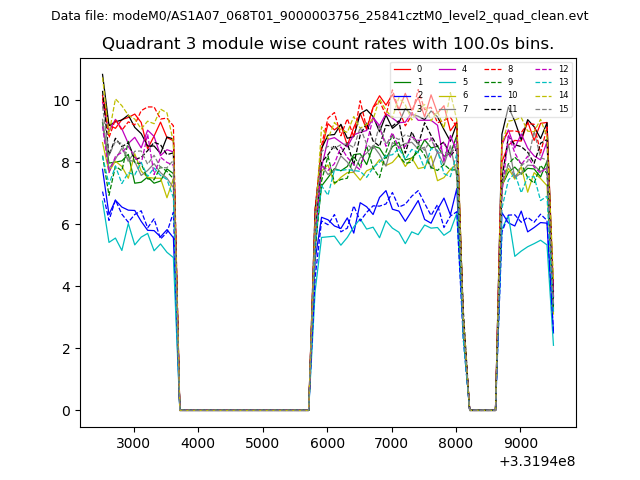
| Quadrant-wise count rates Data is divided into 100 sec bins |
 |
|
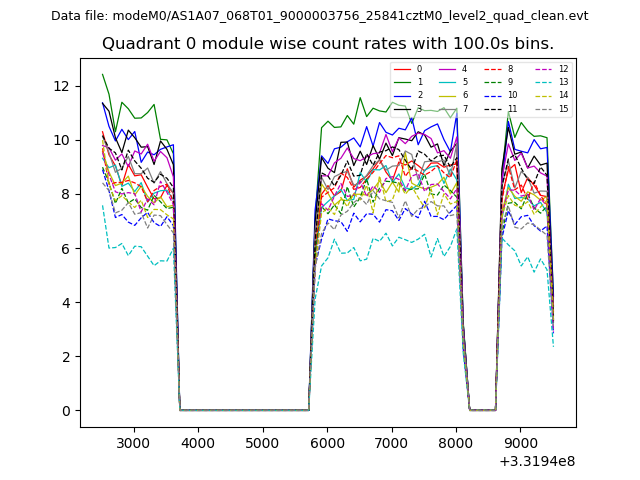
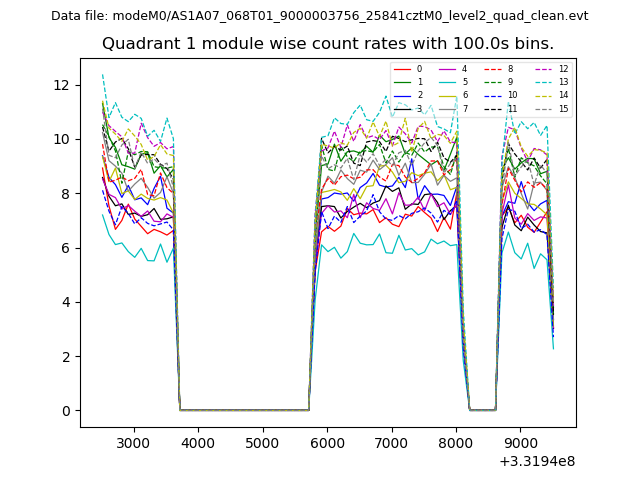
| Module-wise count rates for Quadrant A Data is divided into 100 sec bins |
 |
 |
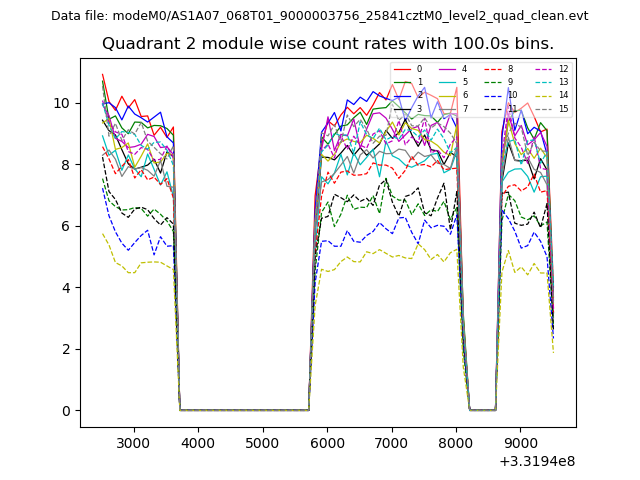
| Module-wise count rates for Quadrant B Data is divided into 100 sec bins |
 |
 |
| Module-wise count rates for Quadrant C Data is divided into 100 sec bins |
 |
 |
| Module-wise count rates for Quadrant D Data is divided into 100 sec bins |
 |
 |
| Parameter | Plot |
|---|---|
| CZT HV Monitor | 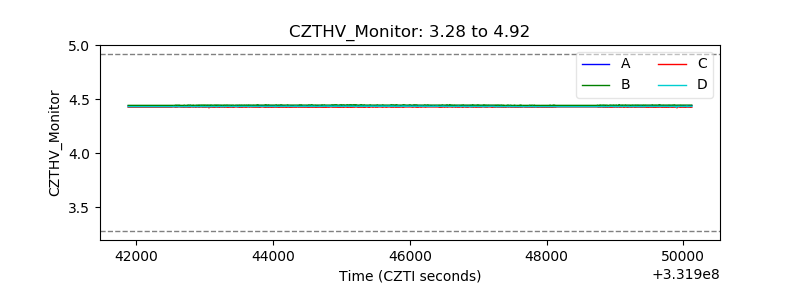 |
| D_VDD | 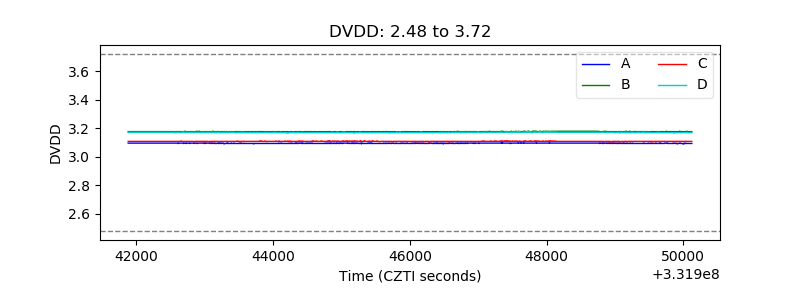 |
| Temperature 1 | 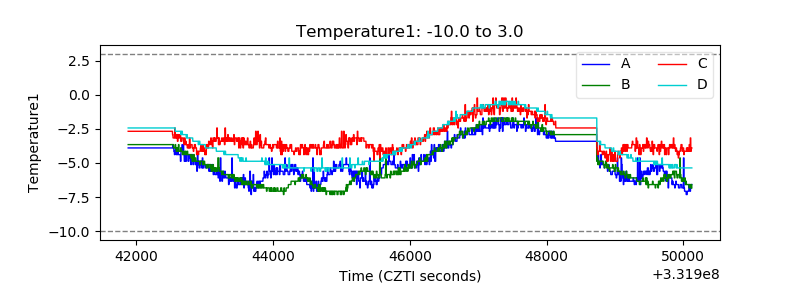 |
| Veto HV Monitor |  |
| Veto LLD | 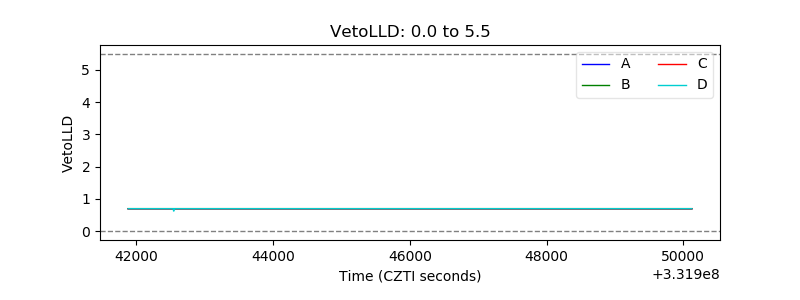 |
| Alpha Counter | 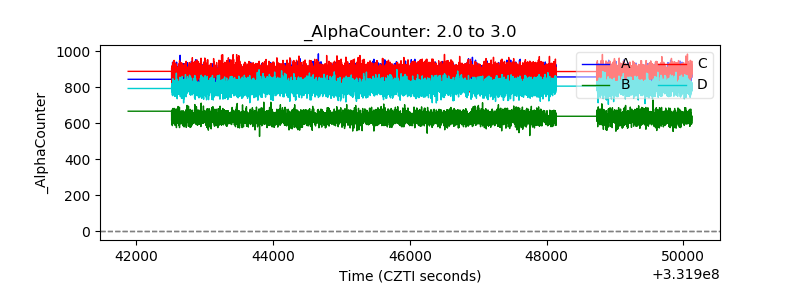 |
| _CPM_Rate |  |
| CZT Counter | 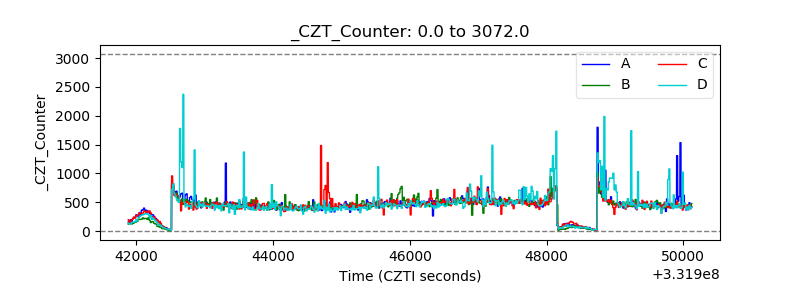 |
| +2.5 Volts monitor |  |
| +5 Volts monitor |  |
| _ROLL_ROT | 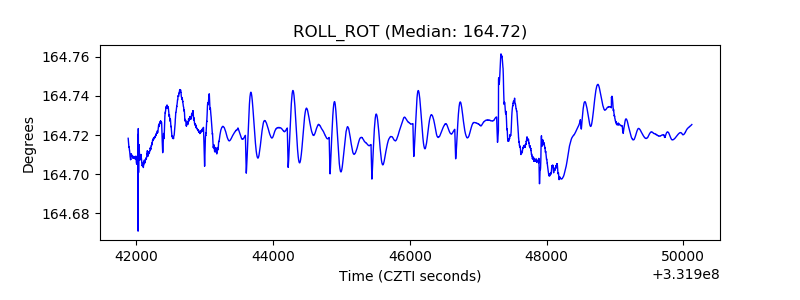 |
| _Roll_DEC | 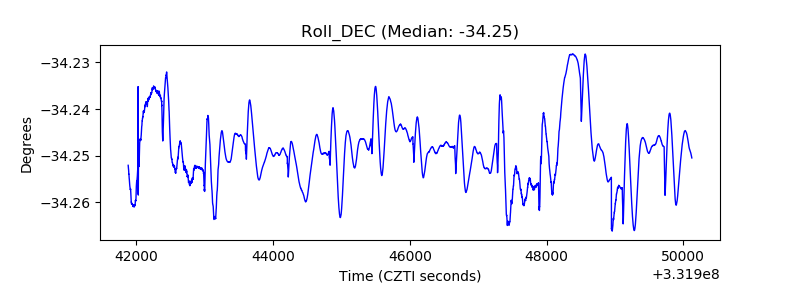 |
| _Roll_RA | 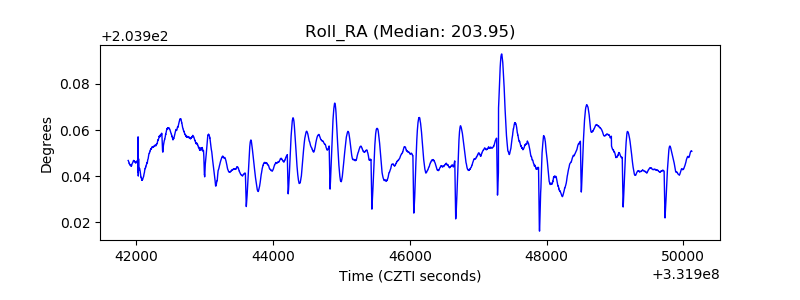 |
| Veto Counter | 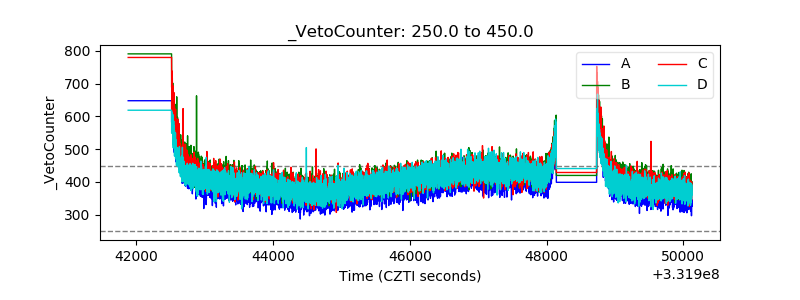 |