| Param | Original file | Final file |
|---|---|---|
| Filename | modeM0/AS1A07_068T01_9000003756_25842cztM0_level2.evt | modeM0/AS1A07_068T01_9000003756_25842cztM0_level2_quad_clean.evt |
| Size (bytes) | 573,891,840 | 104,374,080 |
| Size | 547.3 MB | 99.5 MB |
| Events in quadrant A | 4,081,883 | 664,667 |
| Events in quadrant B | 3,947,729 | 667,741 |
| Events in quadrant C | 3,996,961 | 631,918 |
| Events in quadrant D | 4,800,940 | 630,290 |
| Mode M0 | |||
|---|---|---|---|
| Quadrant | BADHDUFLAG | Total packets | Discarded packets |
| A | 0 | 17326 | 0 |
| B | 0 | 16891 | 0 |
| C | 0 | 17151 | 0 |
| D | 0 | 19952 | 0 |
| Mode M9 | |||
|---|---|---|---|
| Quadrant | BADHDUFLAG | Total packets | Discarded packets |
| A | 0 | 9 | 0 |
| B | 0 | 9 | 0 |
| C | 0 | 9 | 0 |
| D | 0 | 9 | 0 |
| Quadrant | Total seconds | Saturated seconds | Saturation percentage |
|---|---|---|---|
| A | 8143 | 92 | 1.129805% |
| B | 8144 | 112 | 1.375246% |
| C | 8144 | 120 | 1.473477% |
| D | 8144 | 141 | 1.731336% |
Noise dominated data is calculated using 1-second bins in cleaned event files. If a bin has >2000 counts, and if more than 50% of those come from <1% of pixels, then it is considered to be noise-dominated and hence unusable.
| Quadrant | # 1 sec bins | Bins with >0 counts | Bins with >2000 counts | High rate bins dominated by noise | Noise dominated (total time) | Noise dominated (detector-on time) | Marked lightcurve |
|---|---|---|---|---|---|---|---|
| A | 9043 | 8145 | 14 | 14 | 0.15% | 0.17% |  |
| B | 9044 | 8146 | 2 | 2 | 0.02% | 0.02% |  |
| C | 9044 | 8146 | 6 | 6 | 0.07% | 0.07% |  |
| D | 9044 | 8146 | 78 | 78 | 0.86% | 0.96% |  |
Top three noisy pixels from each quadrant. If the there are fewer than three noisy pixels in the level2.evt file, extra rows are filled as -1
| Pixel properties | Quadrant properties | ||||||
|---|---|---|---|---|---|---|---|
| Quadrant | DetID | PixID | Counts | Sigma | Mean | Median | Sigma |
| A | 0 | 13 | 179740 | 881.09 | 1007 | 986 | 202.9 |
| A | 6 | 16 | 18069 | 84.2 | 1007 | 986 | 202.9 |
| A | 13 | 254 | 11834 | 53.47 | 1007 | 986 | 202.9 |
| B | 12 | 111 | 24236 | 120.5 | 999 | 972 | 193.1 |
| B | 11 | 111 | 21741 | 107.57 | 999 | 972 | 193.1 |
| B | 14 | 111 | 19477 | 95.85 | 999 | 972 | 193.1 |
| C | 14 | 238 | 147733 | 651.31 | 954 | 959 | 225.4 |
| C | 14 | 225 | 99867 | 438.91 | 954 | 959 | 225.4 |
| C | 3 | 233 | 34607 | 149.31 | 954 | 959 | 225.4 |
| D | 1 | 52 | 964159 | 4166.4 | 965 | 941 | 231.2 |
| D | 7 | 80 | 77144 | 329.62 | 965 | 941 | 231.2 |
| D | 14 | 35 | 44335 | 187.7 | 965 | 941 | 231.2 |
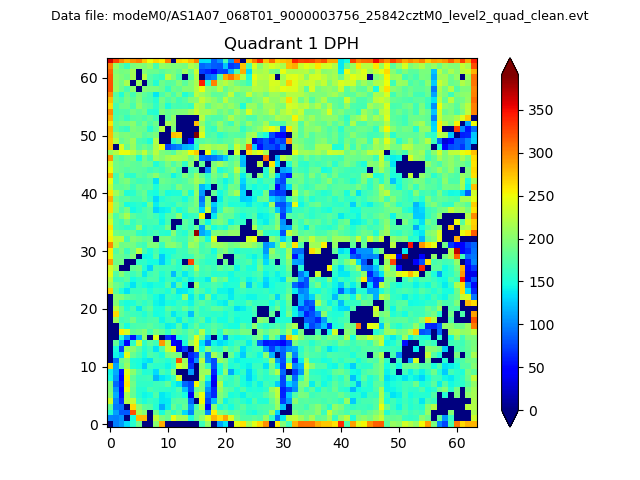
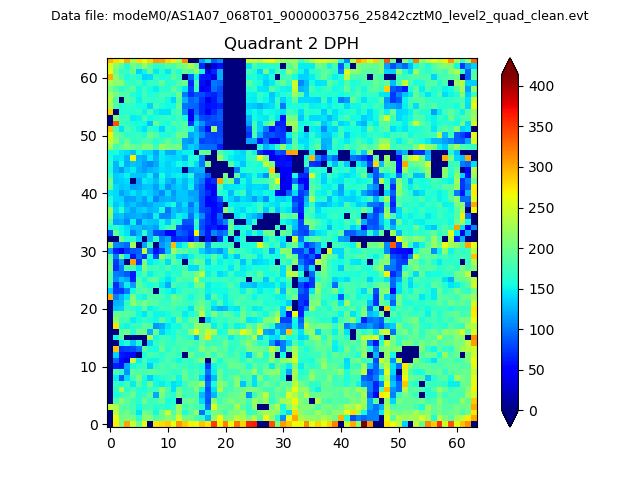
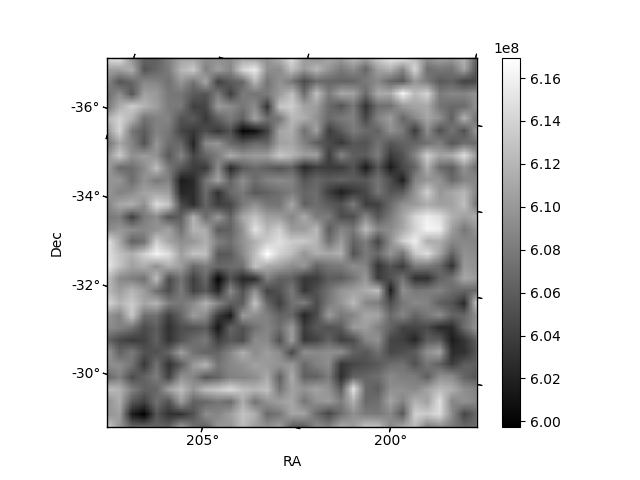
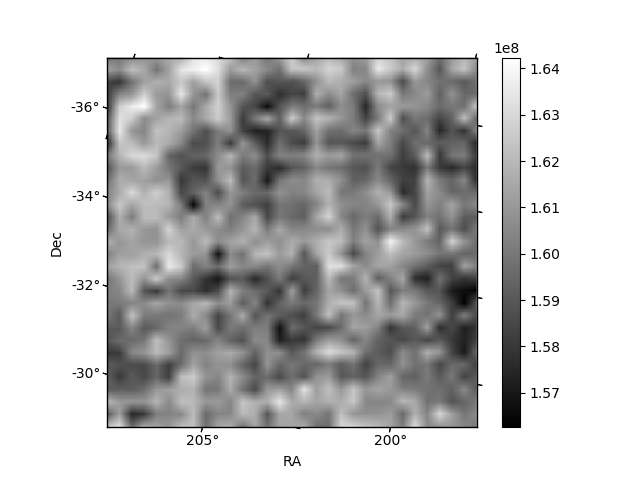
Histogram calculated using DETX and DETY for each event in the final _common_clean file
| Quadrant A |  |
 |
Quadrant B |
|---|---|---|---|
| Quadrant D | 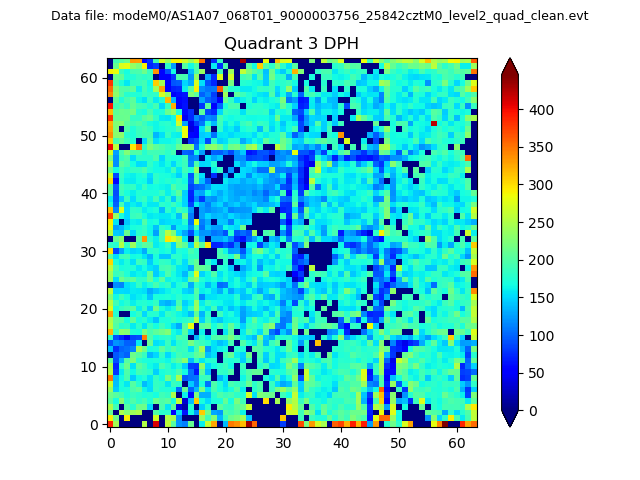 |
 |
Quadrant C |
| Plot type | Count rate plots | Images |
|---|---|---|
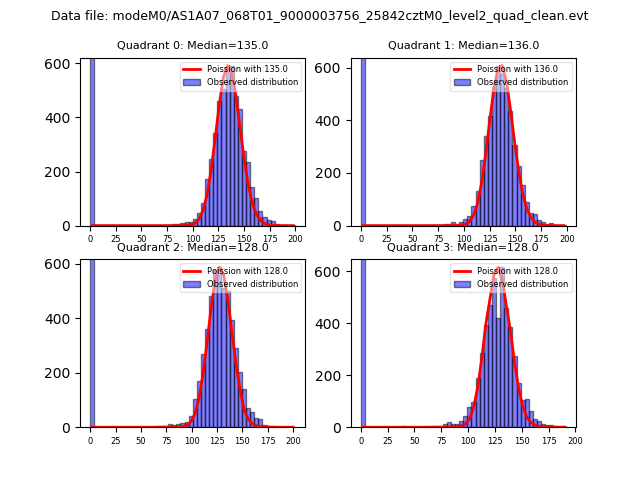
| Comparison with Poisson distribution Blue bars denote a histogram of data divided into 1 sec bins. Red curve is a Poisson curve with rate = median count rate of data. |
 |
 |
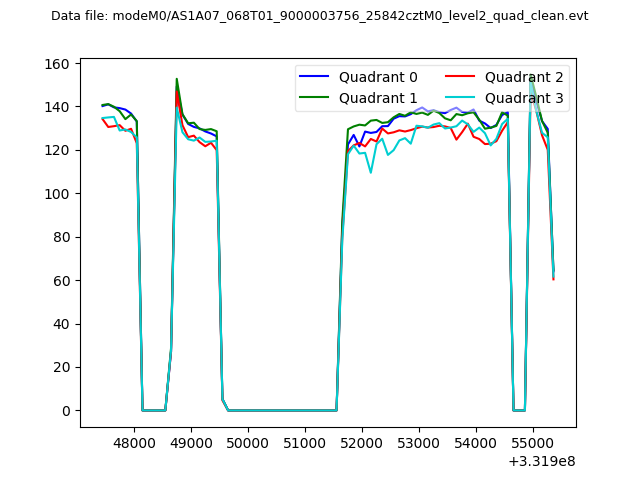
| Quadrant-wise count rates Data is divided into 100 sec bins |
 |
|
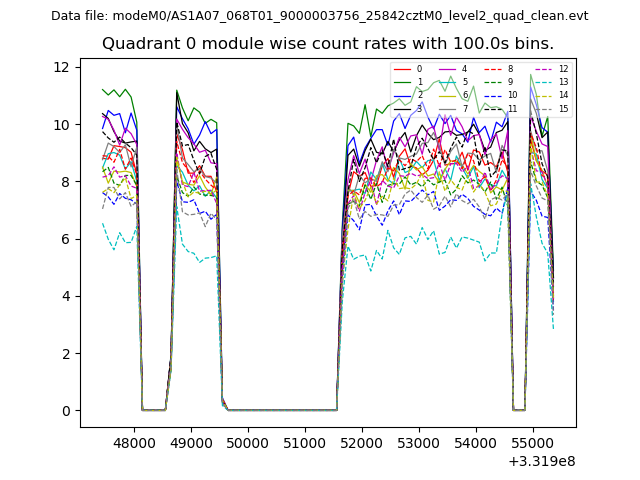
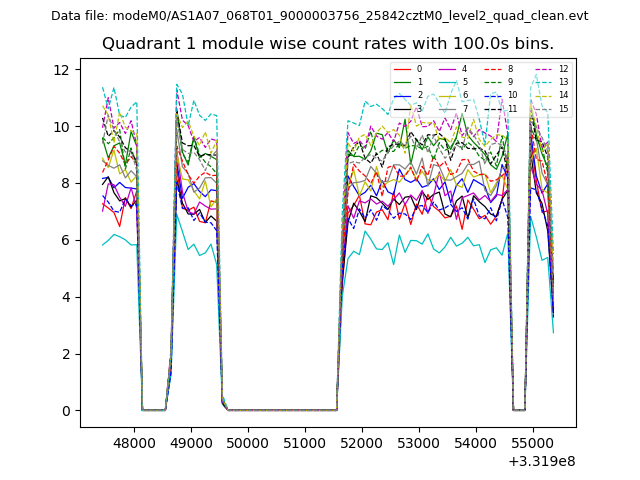
| Module-wise count rates for Quadrant A Data is divided into 100 sec bins |
 |
 |
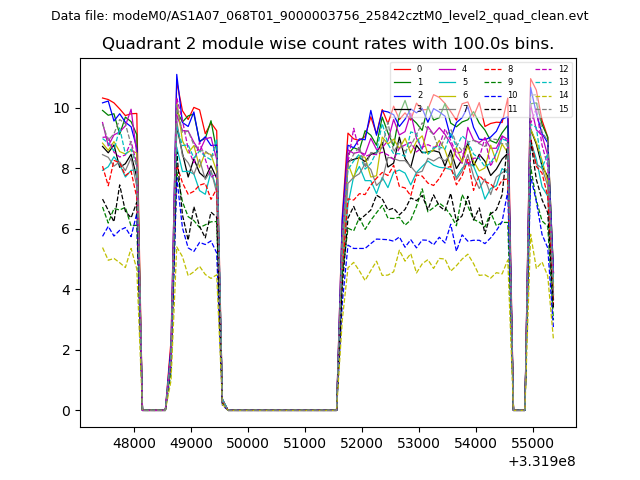
| Module-wise count rates for Quadrant B Data is divided into 100 sec bins |
 |
 |
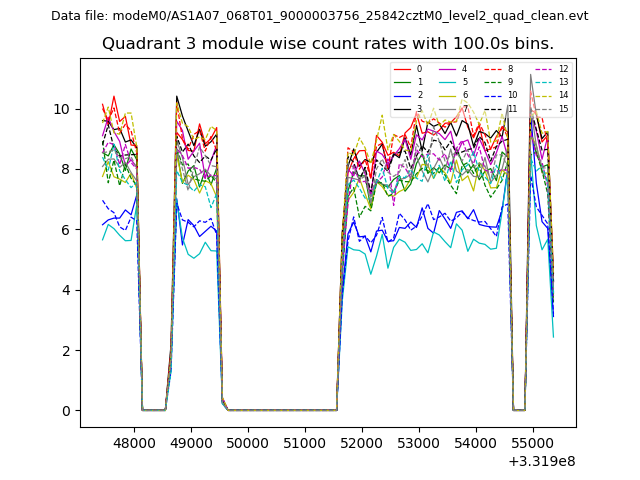
| Module-wise count rates for Quadrant C Data is divided into 100 sec bins |
 |
 |
| Module-wise count rates for Quadrant D Data is divided into 100 sec bins |
 |
 |
| Parameter | Plot |
|---|---|
| CZT HV Monitor | 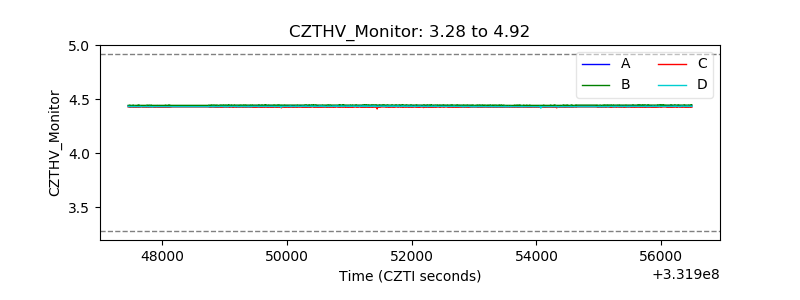 |
| D_VDD | 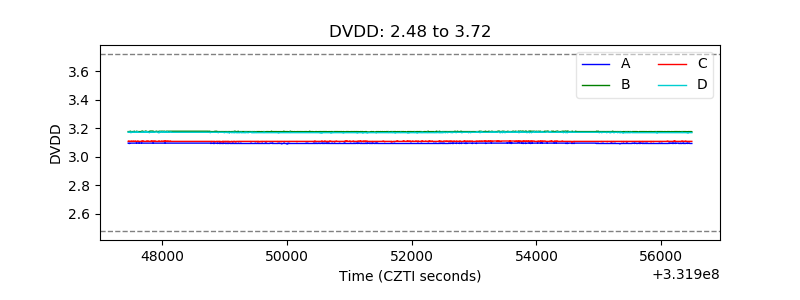 |
| Temperature 1 | 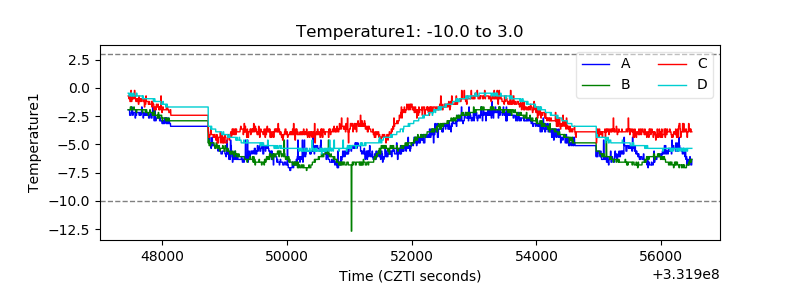 |
| Veto HV Monitor | 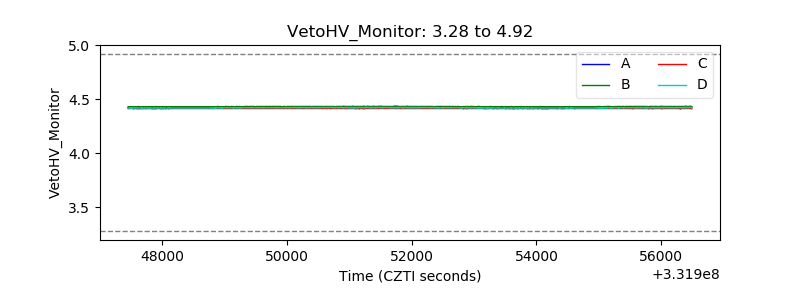 |
| Veto LLD | 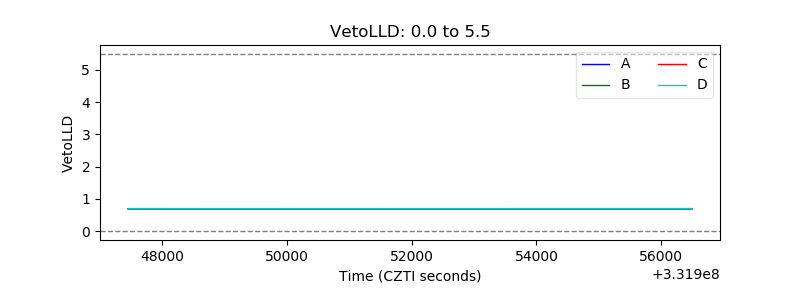 |
| Alpha Counter | 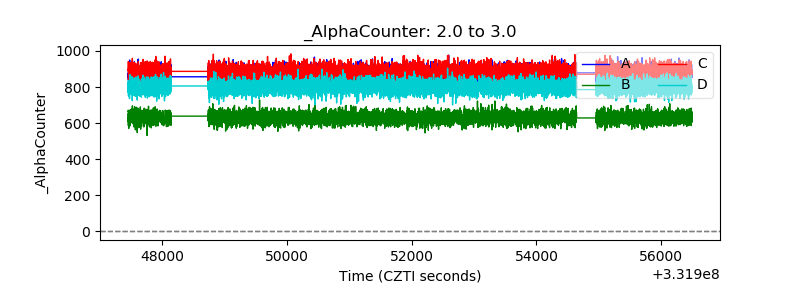 |
| _CPM_Rate |  |
| CZT Counter | 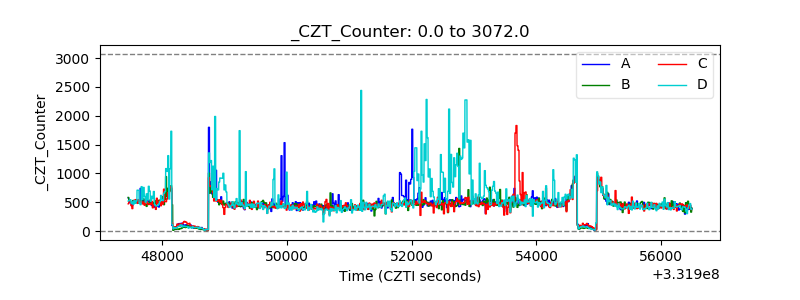 |
| +2.5 Volts monitor |  |
| +5 Volts monitor |  |
| _ROLL_ROT | 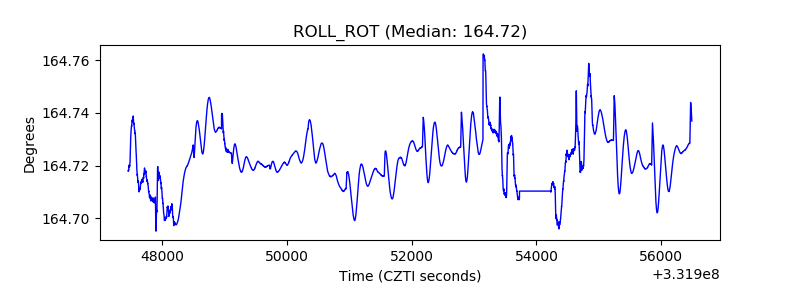 |
| _Roll_DEC |  |
| _Roll_RA |  |
| Veto Counter | 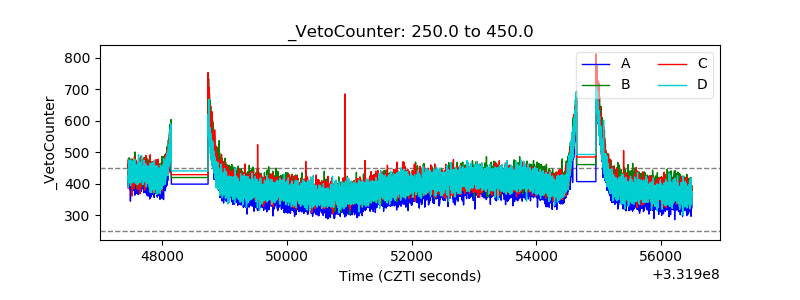 |