| Param | Original file | Final file |
|---|---|---|
| Filename | modeM0/AS1A07_068T01_9000003756_25843cztM0_level2.evt | modeM0/AS1A07_068T01_9000003756_25843cztM0_level2_quad_clean.evt |
| Size (bytes) | 571,743,360 | 91,183,680 |
| Size | 545.3 MB | 87.0 MB |
| Events in quadrant A | 4,194,449 | 563,378 |
| Events in quadrant B | 3,918,543 | 569,863 |
| Events in quadrant C | 3,900,118 | 537,804 |
| Events in quadrant D | 4,757,459 | 531,859 |
| Mode M0 | |||
|---|---|---|---|
| Quadrant | BADHDUFLAG | Total packets | Discarded packets |
| A | 0 | 17640 | 0 |
| B | 0 | 16773 | 0 |
| C | 0 | 16856 | 0 |
| D | 0 | 19758 | 0 |
| Mode M9 | |||
|---|---|---|---|
| Quadrant | BADHDUFLAG | Total packets | Discarded packets |
| A | 0 | 7 | 0 |
| B | 0 | 7 | 0 |
| C | 0 | 7 | 0 |
| D | 0 | 7 | 0 |
| Quadrant | Total seconds | Saturated seconds | Saturation percentage |
|---|---|---|---|
| A | 8031 | 120 | 1.494210% |
| B | 8032 | 174 | 2.166335% |
| C | 8031 | 198 | 2.465446% |
| D | 8031 | 265 | 3.299714% |
Noise dominated data is calculated using 1-second bins in cleaned event files. If a bin has >2000 counts, and if more than 50% of those come from <1% of pixels, then it is considered to be noise-dominated and hence unusable.
| Quadrant | # 1 sec bins | Bins with >0 counts | Bins with >2000 counts | High rate bins dominated by noise | Noise dominated (total time) | Noise dominated (detector-on time) | Marked lightcurve |
|---|---|---|---|---|---|---|---|
| A | 8706 | 8033 | 0 | 0 | 0.00% | 0.00% | 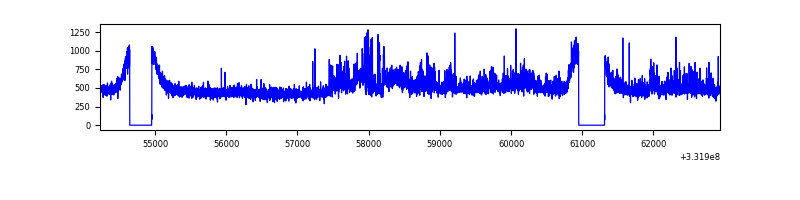 |
| B | 8707 | 8034 | 6 | 6 | 0.07% | 0.07% | 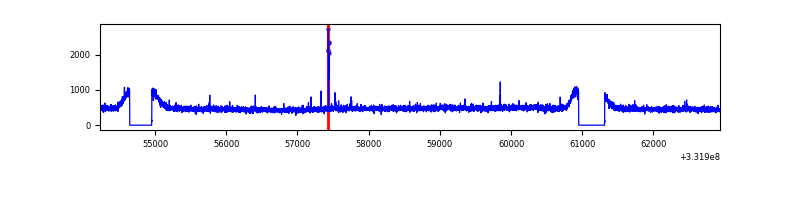 |
| C | 8706 | 8033 | 19 | 19 | 0.22% | 0.24% | 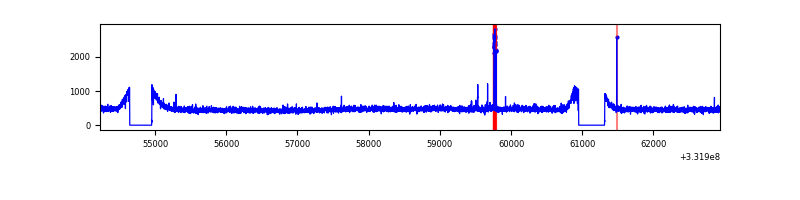 |
| D | 8706 | 8033 | 171 | 171 | 1.96% | 2.13% | 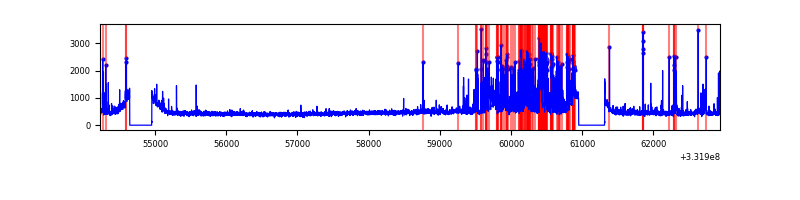 |
Top three noisy pixels from each quadrant. If the there are fewer than three noisy pixels in the level2.evt file, extra rows are filled as -1
| Pixel properties | Quadrant properties | ||||||
|---|---|---|---|---|---|---|---|
| Quadrant | DetID | PixID | Counts | Sigma | Mean | Median | Sigma |
| A | 6 | 16 | 352063 | 1745.17 | 991 | 970 | 201.2 |
| A | 0 | 13 | 17609 | 82.71 | 991 | 970 | 201.2 |
| A | 13 | 254 | 11997 | 54.81 | 991 | 970 | 201.2 |
| B | 12 | 111 | 24045 | 120.66 | 984 | 956 | 191.4 |
| B | 11 | 111 | 21938 | 109.65 | 984 | 956 | 191.4 |
| B | 0 | 219 | 21831 | 109.09 | 984 | 956 | 191.4 |
| C | 14 | 238 | 148333 | 657.37 | 942 | 946 | 224.2 |
| C | 3 | 233 | 72857 | 320.74 | 942 | 946 | 224.2 |
| C | 13 | 61 | 6459 | 24.59 | 942 | 946 | 224.2 |
| D | 12 | 233 | 545707 | 2391.42 | 946 | 922 | 227.8 |
| D | 1 | 52 | 413415 | 1810.7 | 946 | 922 | 227.8 |
| D | 7 | 80 | 124589 | 542.86 | 946 | 922 | 227.8 |
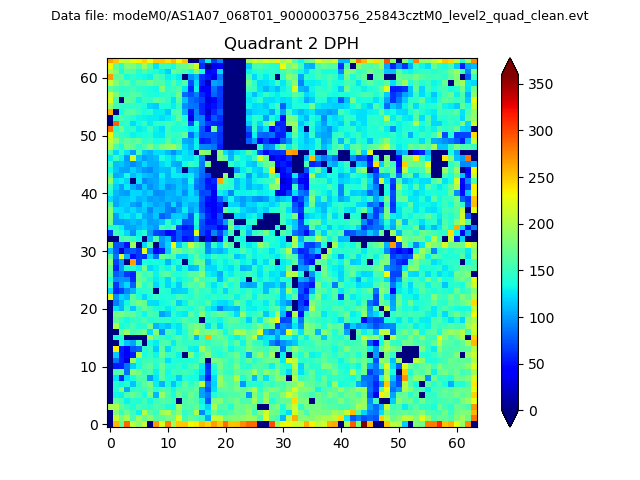
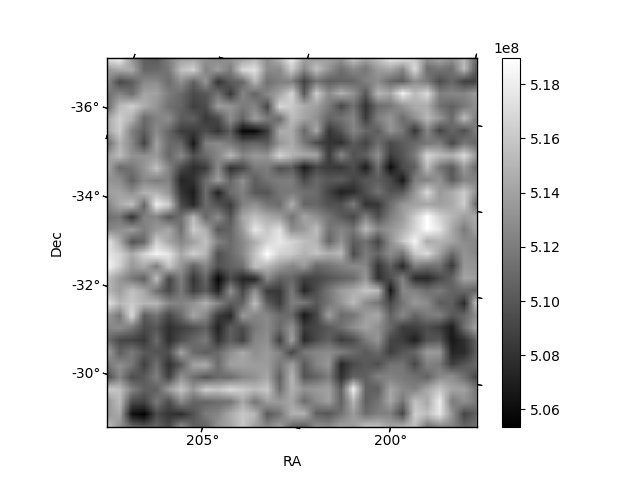
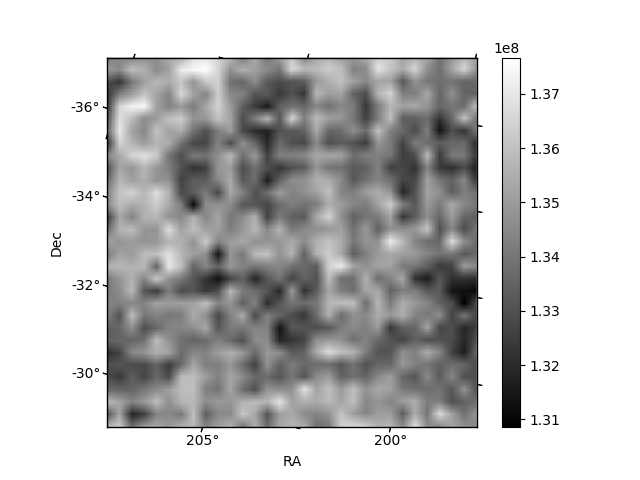
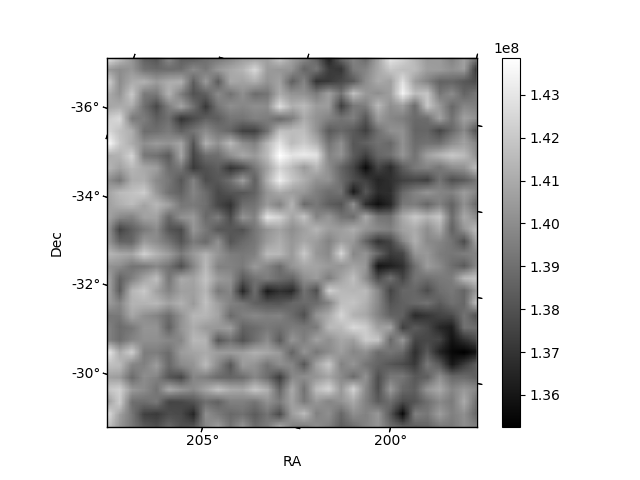
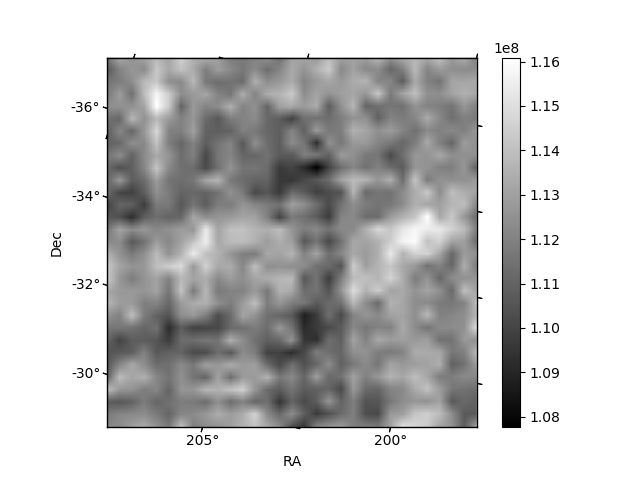
Histogram calculated using DETX and DETY for each event in the final _common_clean file
| Quadrant A | 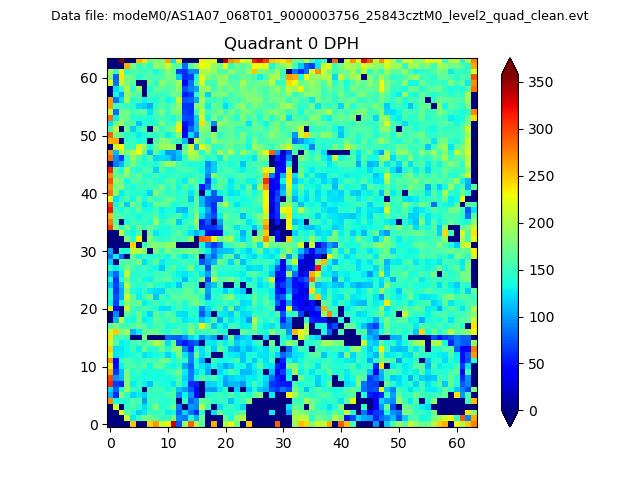 |
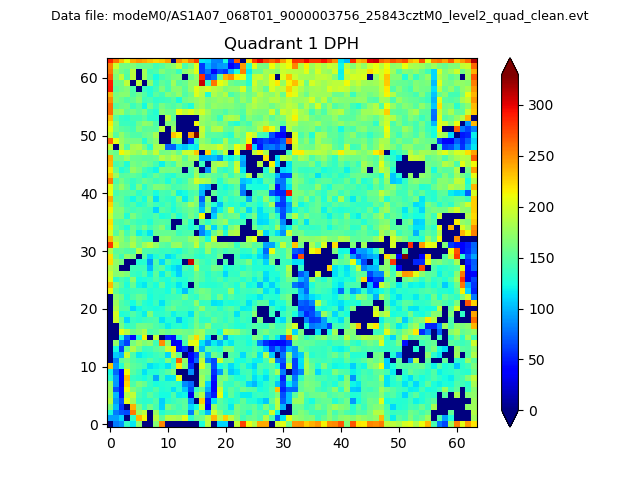 |
Quadrant B |
|---|---|---|---|
| Quadrant D | 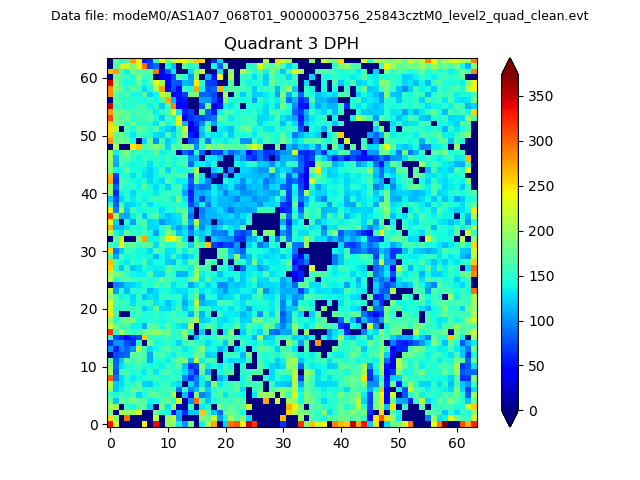 |
 |
Quadrant C |
| Plot type | Count rate plots | Images |
|---|---|---|
| Comparison with Poisson distribution Blue bars denote a histogram of data divided into 1 sec bins. Red curve is a Poisson curve with rate = median count rate of data. |
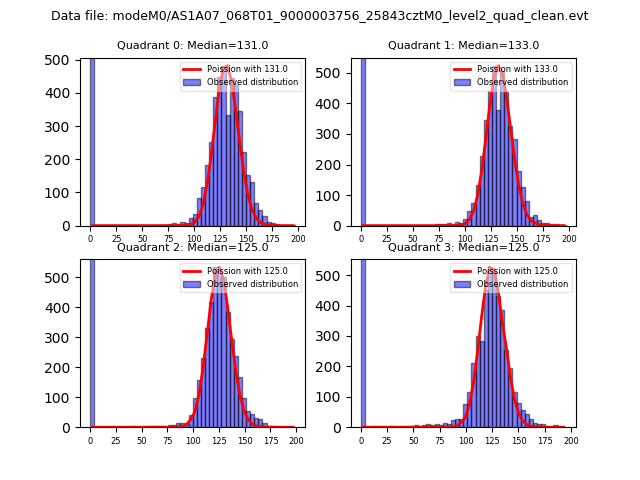 |
 |
| Quadrant-wise count rates Data is divided into 100 sec bins |
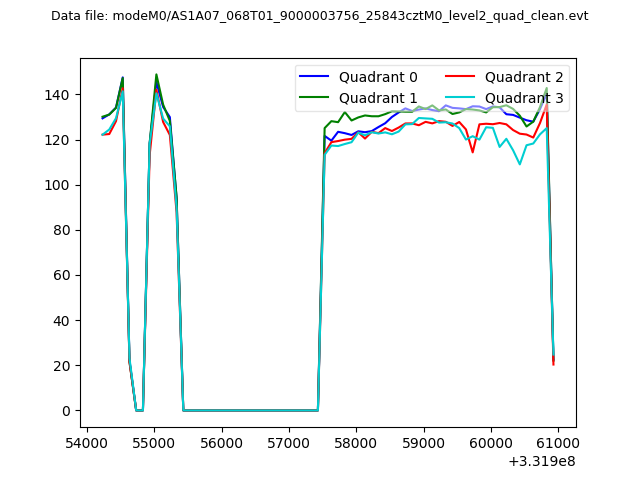 |
|
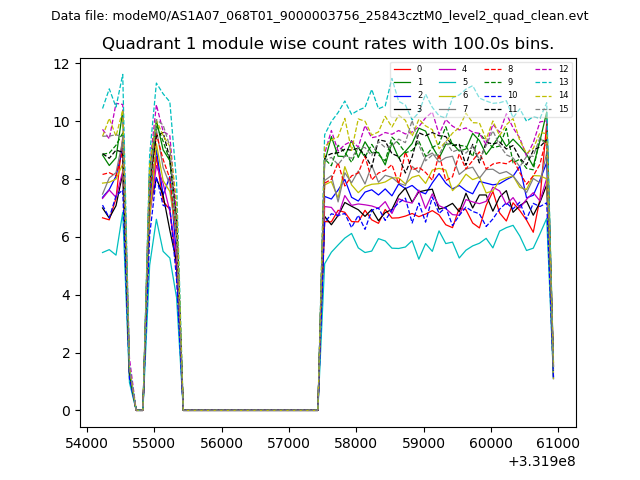
| Module-wise count rates for Quadrant A Data is divided into 100 sec bins |
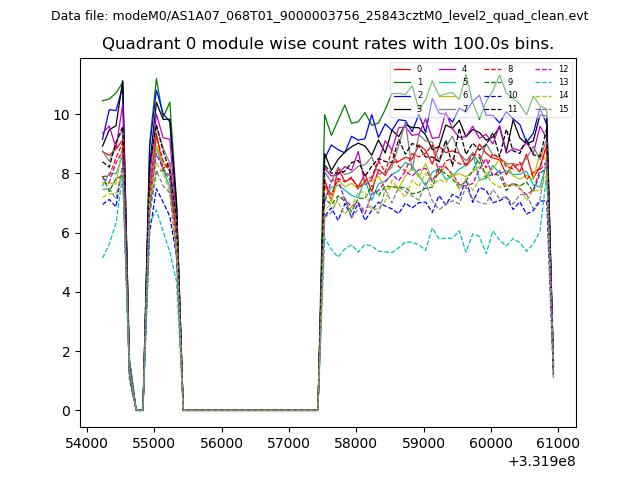 |
 |
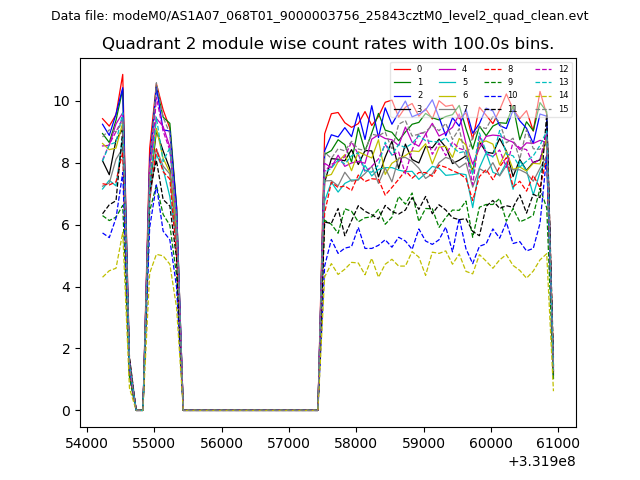
| Module-wise count rates for Quadrant B Data is divided into 100 sec bins |
 |
 |
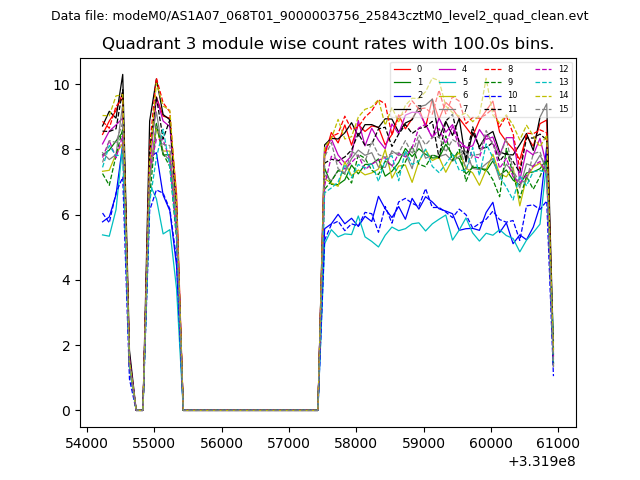
| Module-wise count rates for Quadrant C Data is divided into 100 sec bins |
 |
 |
| Module-wise count rates for Quadrant D Data is divided into 100 sec bins |
 |
 |
| Parameter | Plot |
|---|---|
| CZT HV Monitor | 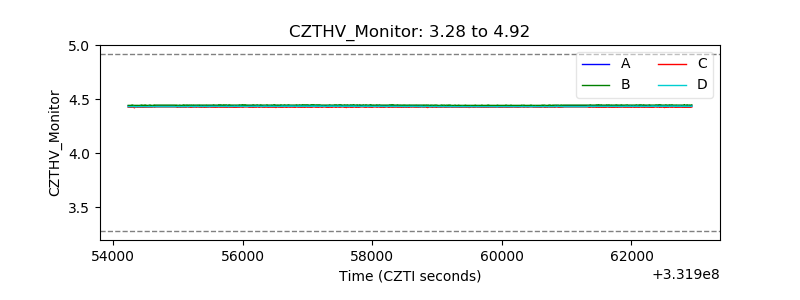 |
| D_VDD | 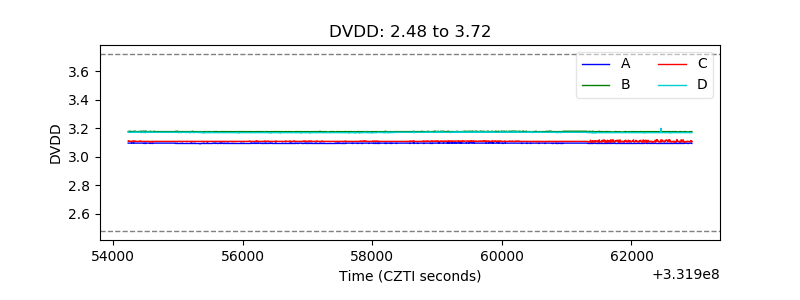 |
| Temperature 1 | 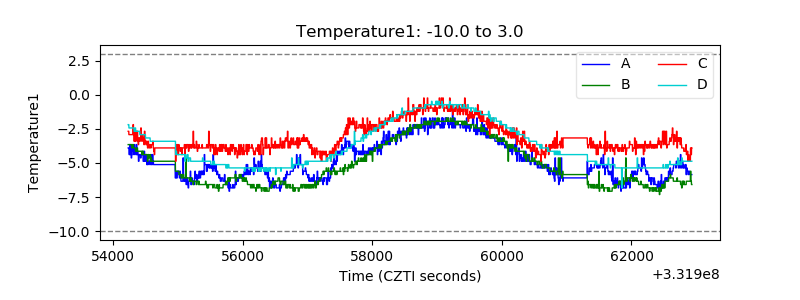 |
| Veto HV Monitor | 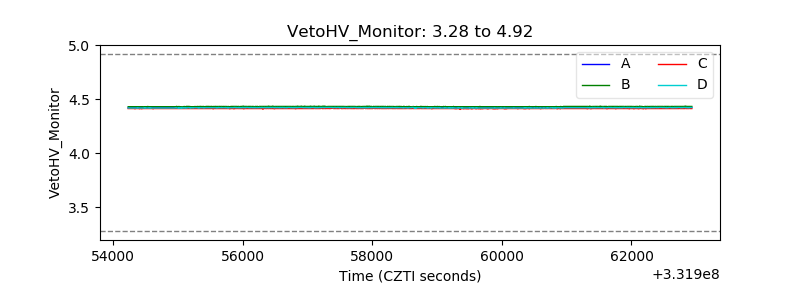 |
| Veto LLD | 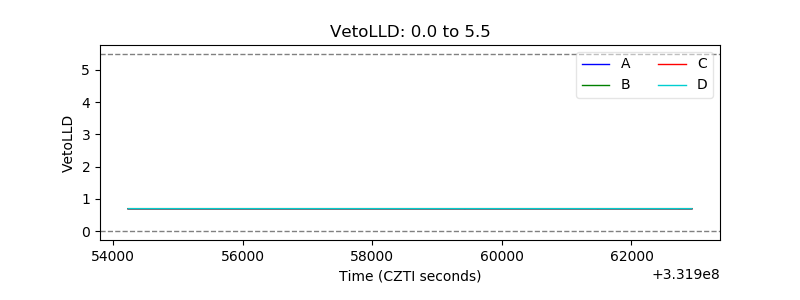 |
| Alpha Counter | 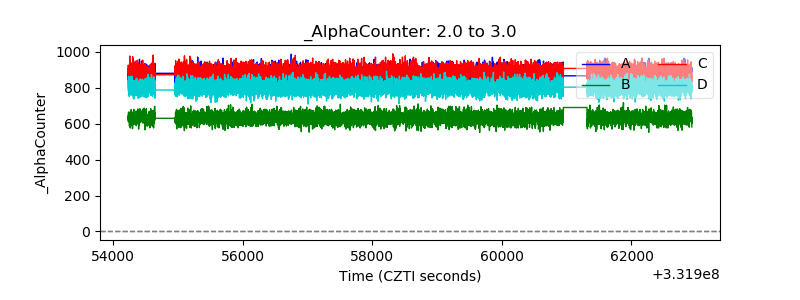 |
| _CPM_Rate | 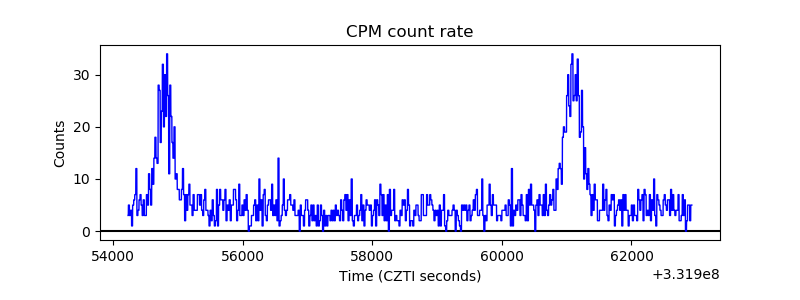 |
| CZT Counter | 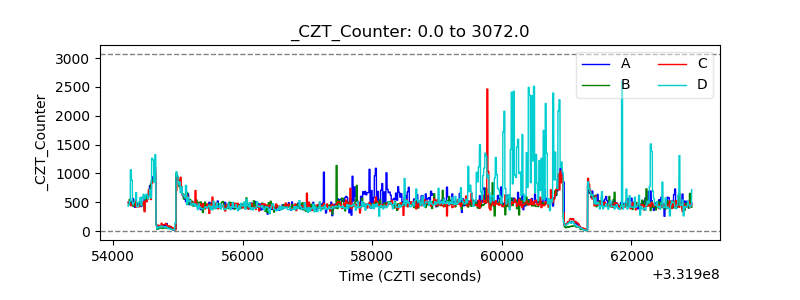 |
| +2.5 Volts monitor |  |
| +5 Volts monitor |  |
| _ROLL_ROT | 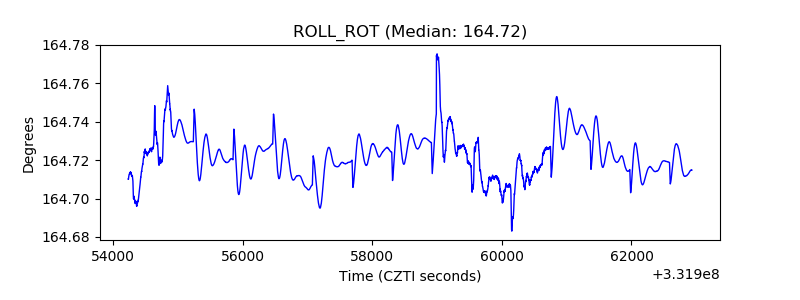 |
| _Roll_DEC | 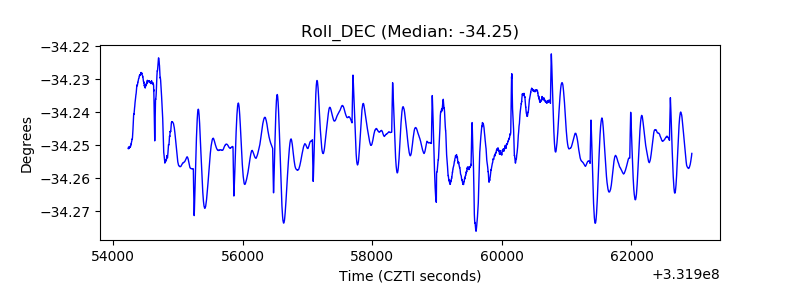 |
| _Roll_RA | 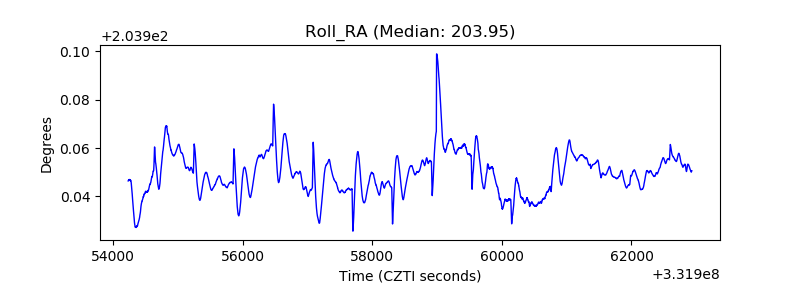 |
| Veto Counter | 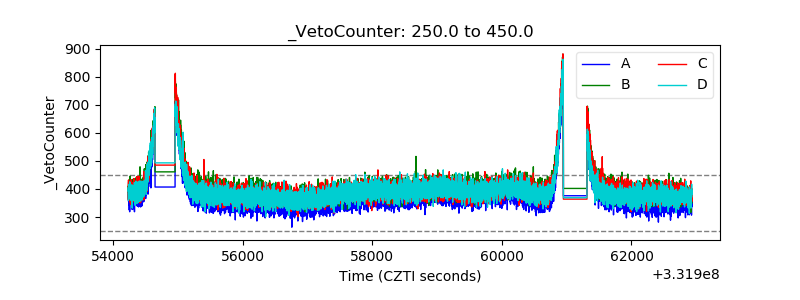 |