| Param | Original file | Final file |
|---|---|---|
| Filename | modeM0/AS1A07_068T01_9000003756_25846cztM0_level2.evt | modeM0/AS1A07_068T01_9000003756_25846cztM0_level2_quad_clean.evt |
| Size (bytes) | 1,462,628,160 | 239,567,040 |
| Size | 1.4 GB | 228.5 MB |
| Events in quadrant A | 9,971,978 | 1,543,026 |
| Events in quadrant B | 8,918,945 | 1,556,457 |
| Events in quadrant C | 8,886,879 | 1,481,547 |
| Events in quadrant D | 15,262,972 | 1,393,687 |
| Mode M0 | |||
|---|---|---|---|
| Quadrant | BADHDUFLAG | Total packets | Discarded packets |
| A | 0 | 40949 | 0 |
| B | 0 | 38266 | 0 |
| C | 0 | 38192 | 0 |
| D | 0 | 57581 | 0 |
| Mode M9 | |||
|---|---|---|---|
| Quadrant | BADHDUFLAG | Total packets | Discarded packets |
| A | 0 | 23 | 0 |
| B | 0 | 23 | 0 |
| C | 0 | 23 | 0 |
| D | 0 | 23 | 0 |
| Quadrant | Total seconds | Saturated seconds | Saturation percentage |
|---|---|---|---|
| A | 18582 | 286 | 1.539124% |
| B | 18583 | 308 | 1.657429% |
| C | 18583 | 404 | 2.174030% |
| D | 18583 | 2036 | 10.956250% |
Noise dominated data is calculated using 1-second bins in cleaned event files. If a bin has >2000 counts, and if more than 50% of those come from <1% of pixels, then it is considered to be noise-dominated and hence unusable.
| Quadrant | # 1 sec bins | Bins with >0 counts | Bins with >2000 counts | High rate bins dominated by noise | Noise dominated (total time) | Noise dominated (detector-on time) | Marked lightcurve |
|---|---|---|---|---|---|---|---|
| A | 20892 | 18587 | 0 | 0 | 0.00% | 0.00% | 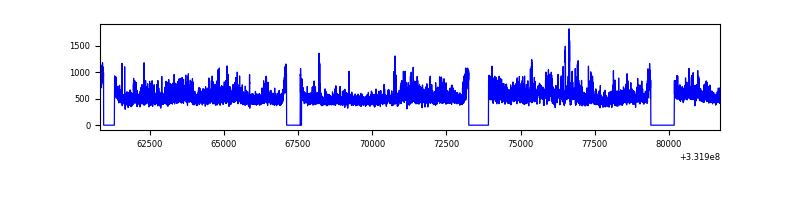 |
| B | 20893 | 18588 | 1 | 1 | 0.00% | 0.01% | 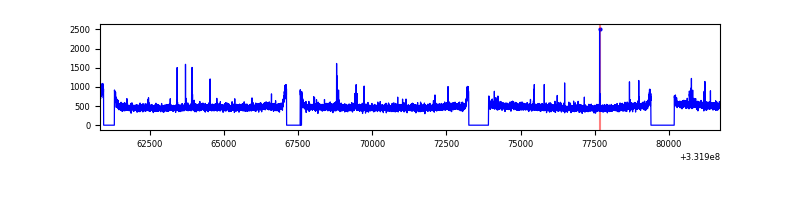 |
| C | 20893 | 18588 | 1 | 1 | 0.00% | 0.01% | 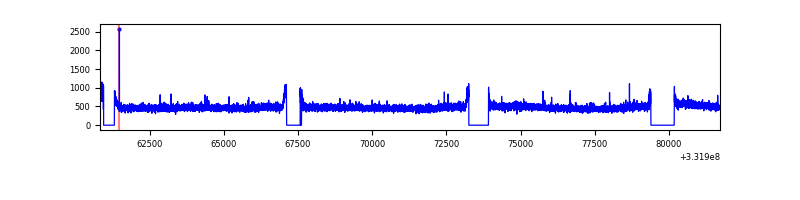 |
| D | 20893 | 18588 | 1714 | 1714 | 8.20% | 9.22% | 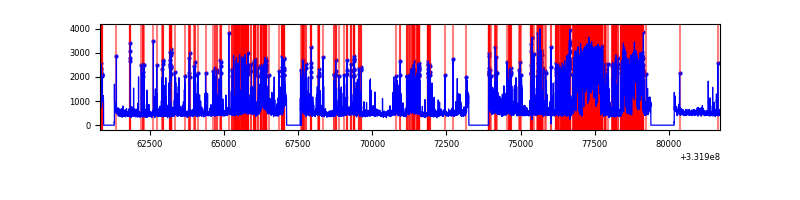 |
Top three noisy pixels from each quadrant. If the there are fewer than three noisy pixels in the level2.evt file, extra rows are filled as -1
| Pixel properties | Quadrant properties | ||||||
|---|---|---|---|---|---|---|---|
| Quadrant | DetID | PixID | Counts | Sigma | Mean | Median | Sigma |
| A | 6 | 16 | 1146129 | 2509.67 | 2279 | 2232 | 455.8 |
| A | 0 | 13 | 41529 | 86.22 | 2279 | 2232 | 455.8 |
| A | 13 | 254 | 24565 | 49.0 | 2279 | 2232 | 455.8 |
| B | 6 | 36 | 60250 | 134.21 | 2254 | 2197 | 432.6 |
| B | 12 | 111 | 55041 | 122.16 | 2254 | 2197 | 432.6 |
| B | 11 | 111 | 49992 | 110.49 | 2254 | 2197 | 432.6 |
| C | 14 | 238 | 343692 | 669.76 | 2168 | 2179 | 509.9 |
| C | 3 | 233 | 87455 | 167.24 | 2168 | 2179 | 509.9 |
| C | 13 | 61 | 14781 | 24.71 | 2168 | 2179 | 509.9 |
| D | 12 | 233 | 3334403 | 6613.25 | 2113 | 2061 | 503.9 |
| D | 1 | 52 | 3217410 | 6381.07 | 2113 | 2061 | 503.9 |
| D | 7 | 80 | 384891 | 759.75 | 2113 | 2061 | 503.9 |
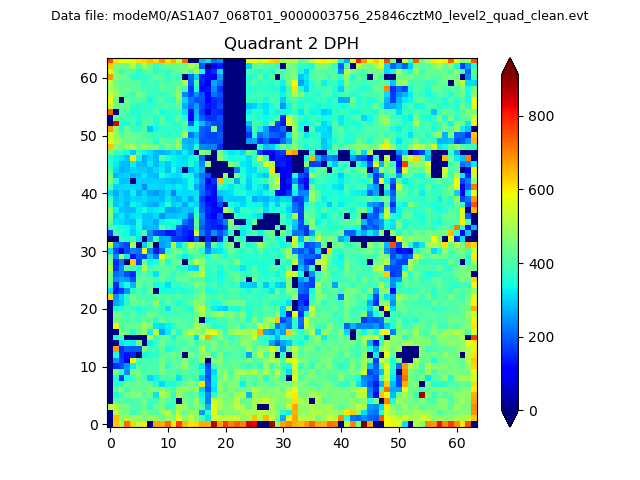
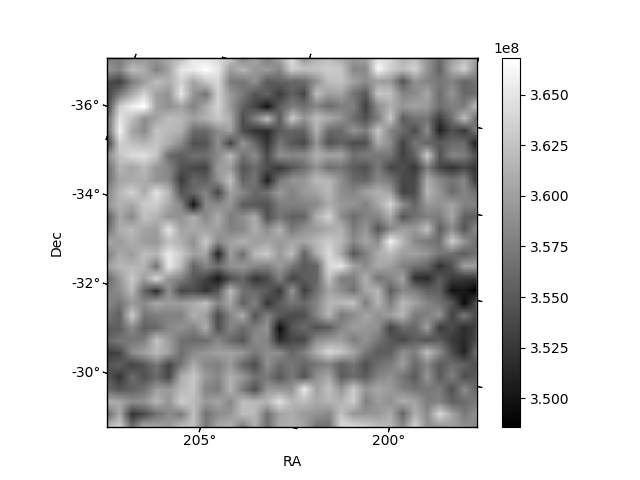
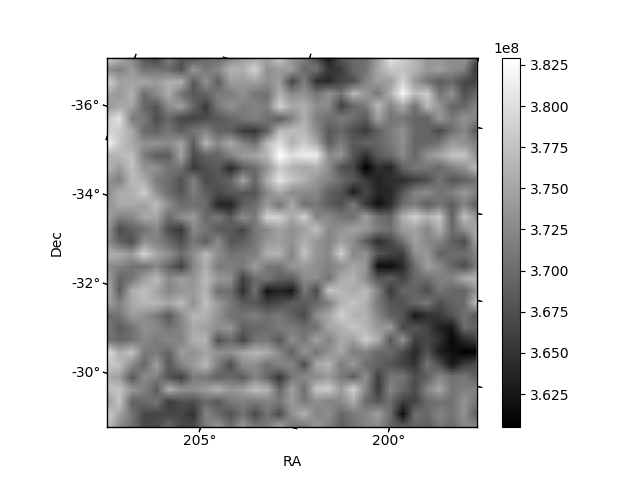
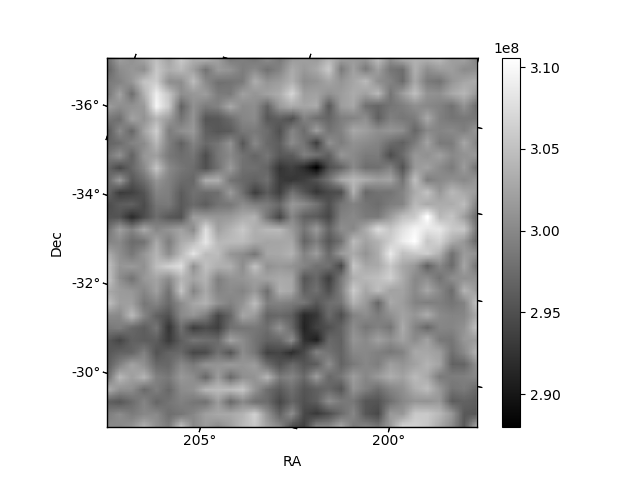
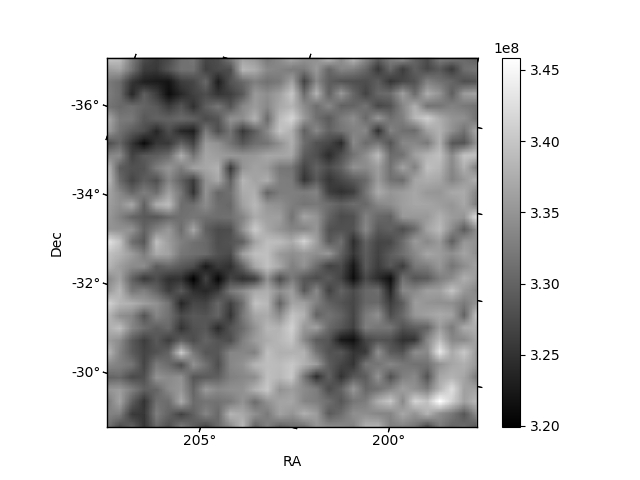
Histogram calculated using DETX and DETY for each event in the final _common_clean file
| Quadrant A | 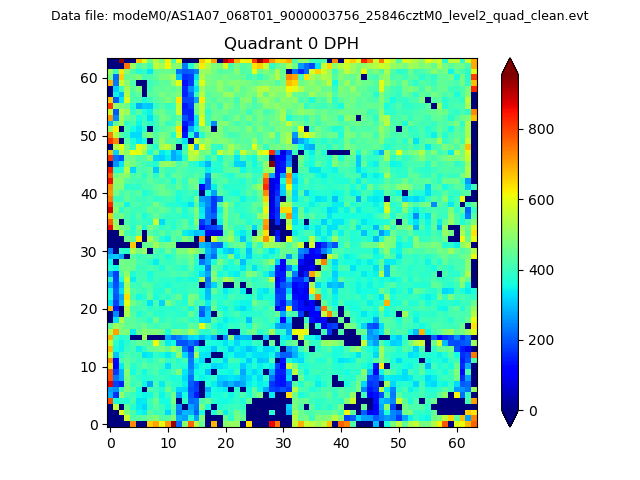 |
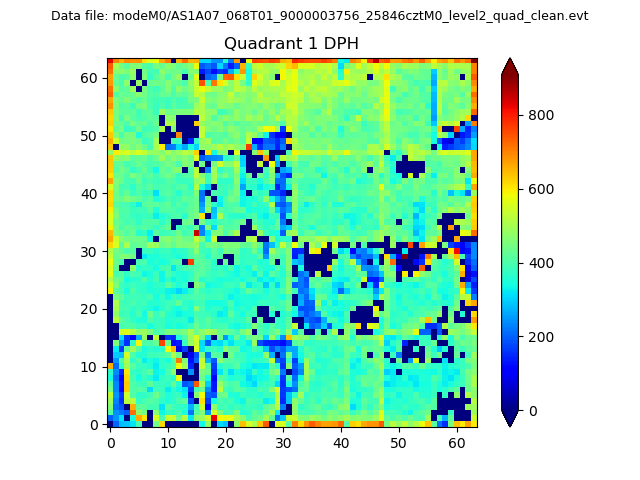 |
Quadrant B |
|---|---|---|---|
| Quadrant D | 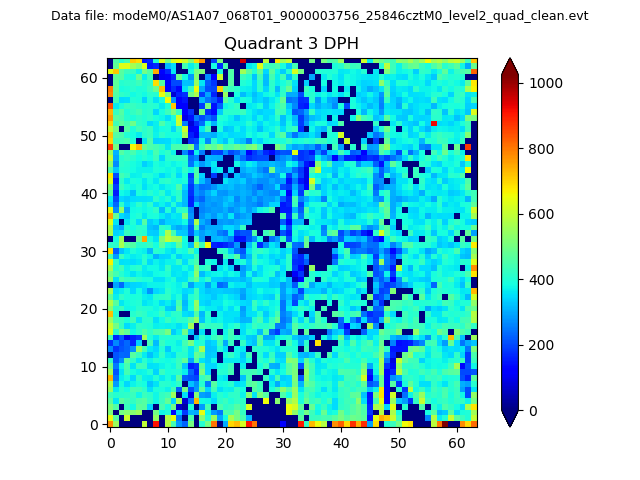 |
 |
Quadrant C |
| Plot type | Count rate plots | Images |
|---|---|---|
| Comparison with Poisson distribution Blue bars denote a histogram of data divided into 1 sec bins. Red curve is a Poisson curve with rate = median count rate of data. |
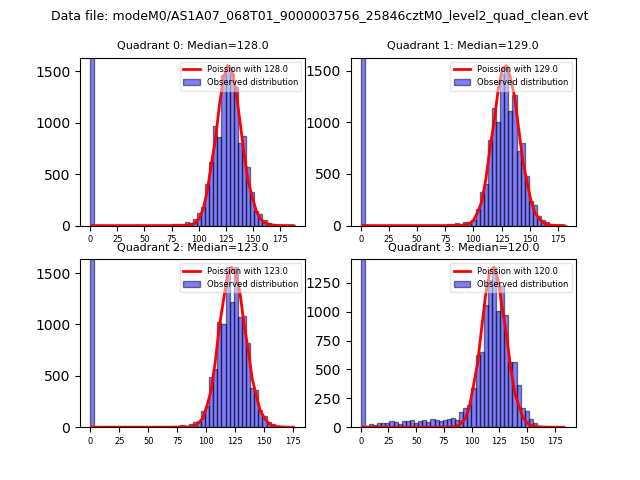 |
 |
| Quadrant-wise count rates Data is divided into 100 sec bins |
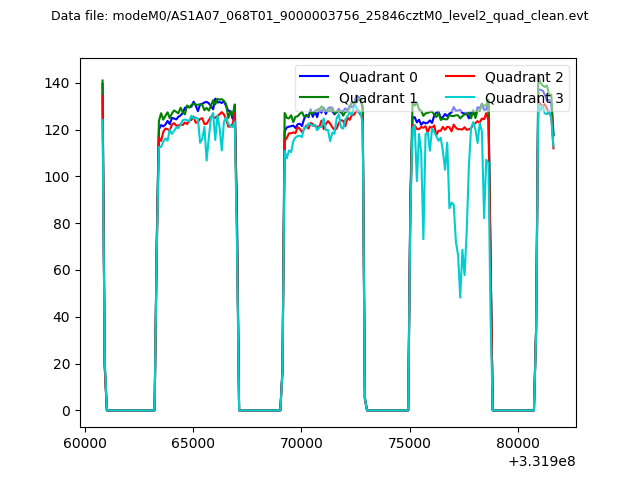 |
|
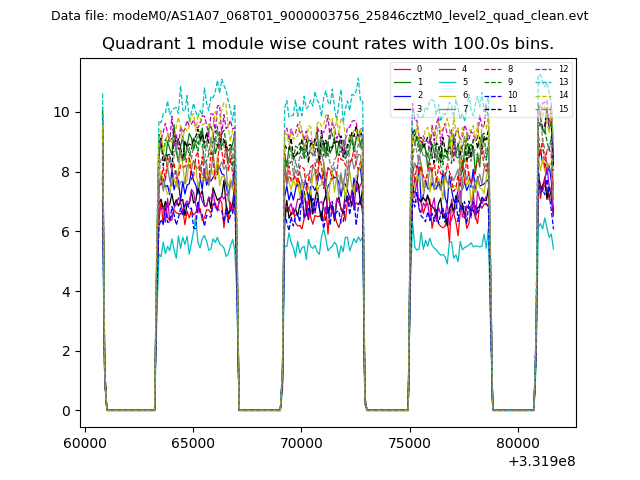
| Module-wise count rates for Quadrant A Data is divided into 100 sec bins |
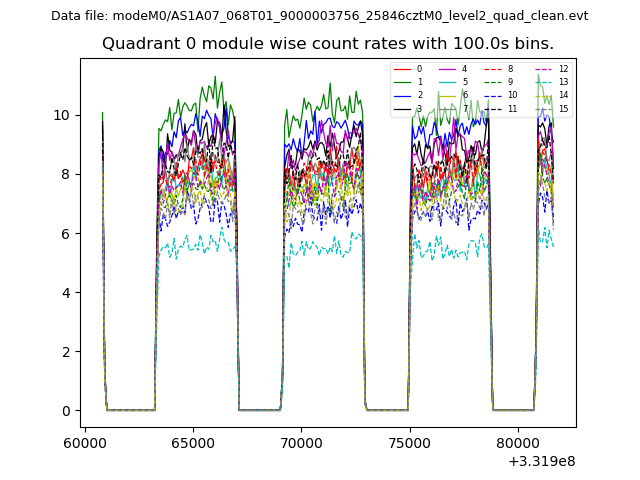 |
 |
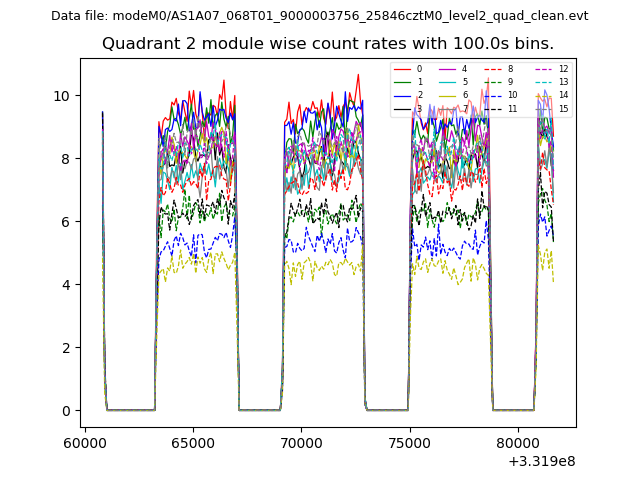
| Module-wise count rates for Quadrant B Data is divided into 100 sec bins |
 |
 |
| Module-wise count rates for Quadrant C Data is divided into 100 sec bins |
 |
 |
| Module-wise count rates for Quadrant D Data is divided into 100 sec bins |
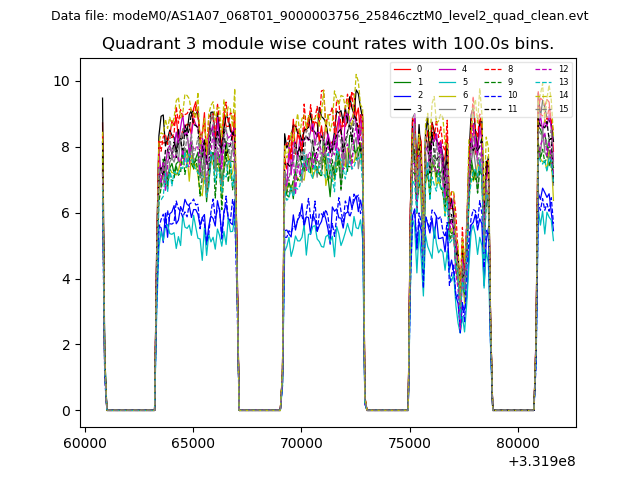 |
 |
| Parameter | Plot |
|---|---|
| CZT HV Monitor | 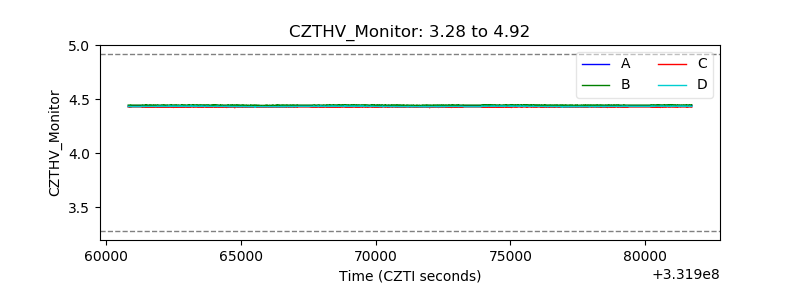 |
| D_VDD | 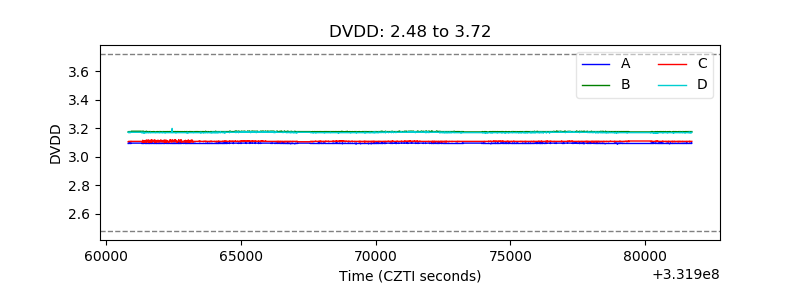 |
| Temperature 1 | 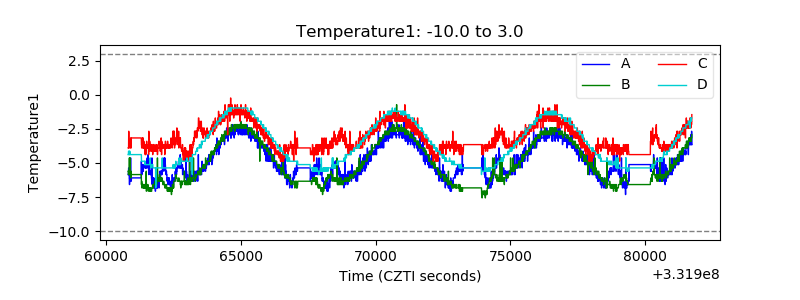 |
| Veto HV Monitor | 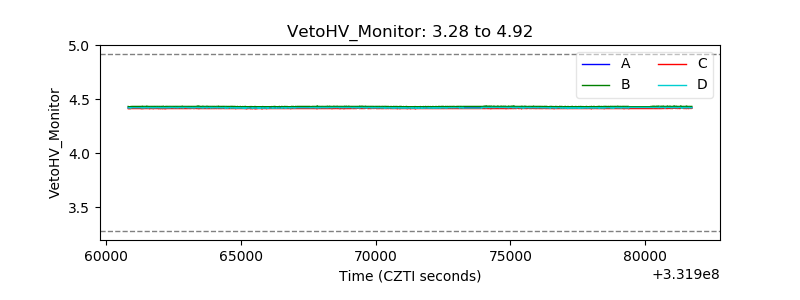 |
| Veto LLD | 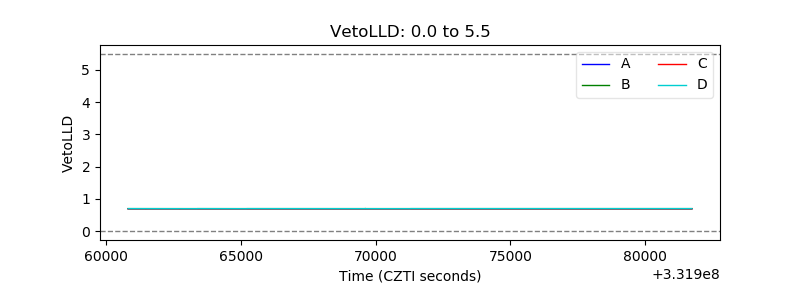 |
| Alpha Counter | 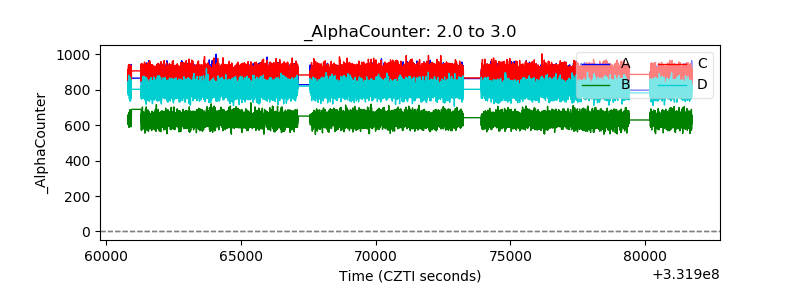 |
| _CPM_Rate | 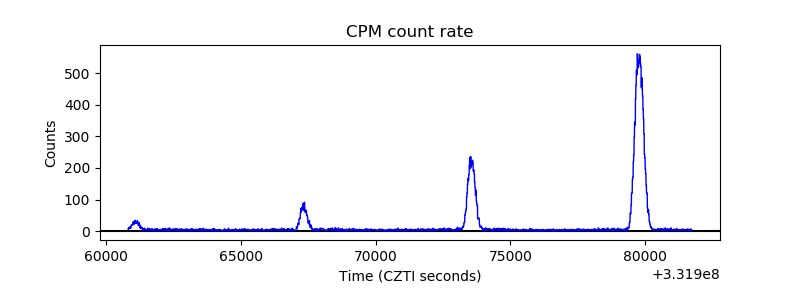 |
| CZT Counter | 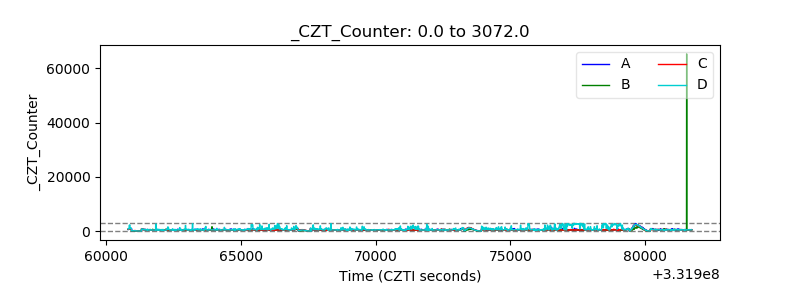 |
| +2.5 Volts monitor |  |
| +5 Volts monitor |  |
| _ROLL_ROT | 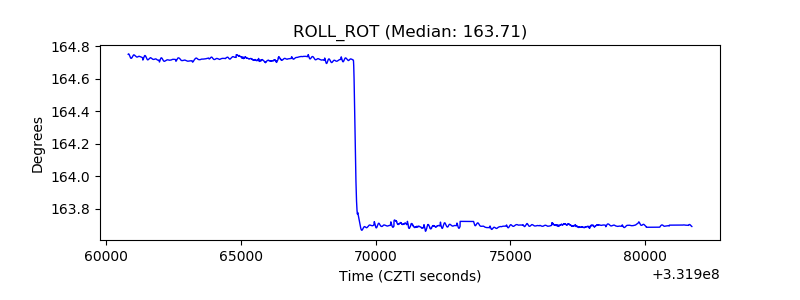 |
| _Roll_DEC | 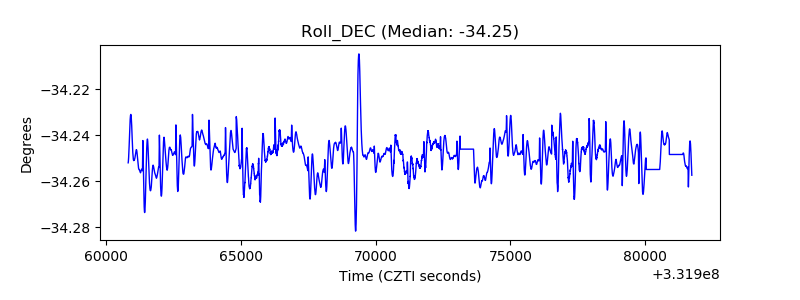 |
| _Roll_RA |  |
| Veto Counter | 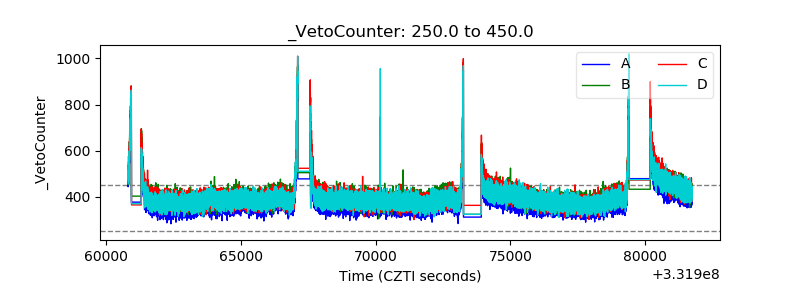 |