| Param | Original file | Final file |
|---|---|---|
| Filename | modeM0/AS1A07_068T01_9000003756_25847cztM0_level2.evt | modeM0/AS1A07_068T01_9000003756_25847cztM0_level2_quad_clean.evt |
| Size (bytes) | 626,492,160 | 96,785,280 |
| Size | 597.5 MB | 92.3 MB |
| Events in quadrant A | 3,298,655 | 663,361 |
| Events in quadrant B | 3,174,243 | 665,039 |
| Events in quadrant C | 7,749,664 | 526,862 |
| Events in quadrant D | 4,314,565 | 626,500 |
| Mode M0 | |||
|---|---|---|---|
| Quadrant | BADHDUFLAG | Total packets | Discarded packets |
| A | 0 | 13868 | 0 |
| B | 0 | 13481 | 0 |
| C | 0 | 27257 | 0 |
| D | 0 | 17170 | 0 |
| Mode M9 | |||
|---|---|---|---|
| Quadrant | BADHDUFLAG | Total packets | Discarded packets |
| A | 0 | 10 | 0 |
| B | 0 | 10 | 0 |
| C | 0 | 10 | 0 |
| D | 0 | 10 | 0 |
| Quadrant | Total seconds | Saturated seconds | Saturation percentage |
|---|---|---|---|
| A | 6434 | 53 | 0.823749% |
| B | 6435 | 58 | 0.901321% |
| C | 6435 | 2300 | 35.742036% |
| D | 6435 | 266 | 4.133644% |
Noise dominated data is calculated using 1-second bins in cleaned event files. If a bin has >2000 counts, and if more than 50% of those come from <1% of pixels, then it is considered to be noise-dominated and hence unusable.
| Quadrant | # 1 sec bins | Bins with >0 counts | Bins with >2000 counts | High rate bins dominated by noise | Noise dominated (total time) | Noise dominated (detector-on time) | Marked lightcurve |
|---|---|---|---|---|---|---|---|
| A | 7409 | 6435 | 1 | 1 | 0.01% | 0.02% | 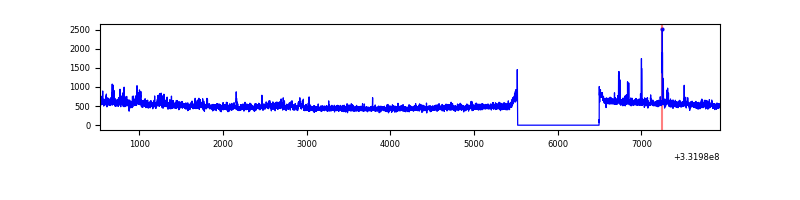 |
| B | 7410 | 6436 | 0 | 0 | 0.00% | 0.00% | 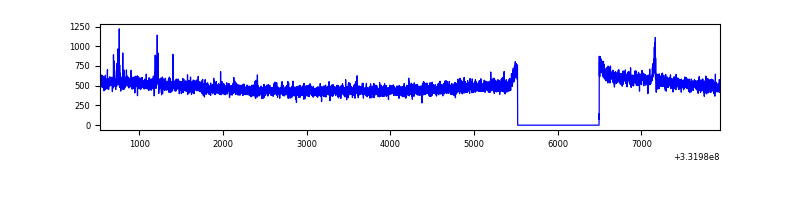 |
| C | 7410 | 6436 | 2057 | 2057 | 27.76% | 31.96% | 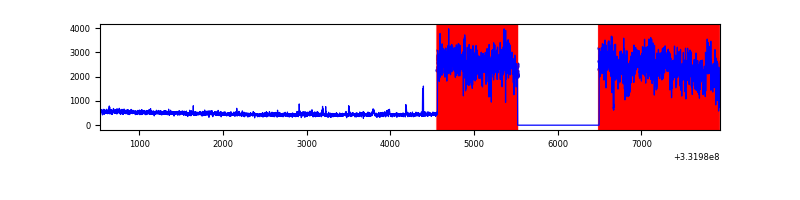 |
| D | 7410 | 6436 | 196 | 196 | 2.65% | 3.05% | 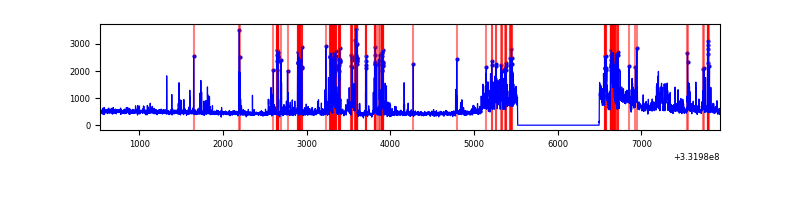 |
Top three noisy pixels from each quadrant. If the there are fewer than three noisy pixels in the level2.evt file, extra rows are filled as -1
| Pixel properties | Quadrant properties | ||||||
|---|---|---|---|---|---|---|---|
| Quadrant | DetID | PixID | Counts | Sigma | Mean | Median | Sigma |
| A | 6 | 16 | 122555 | 739.46 | 816 | 801 | 164.7 |
| A | 0 | 13 | 24203 | 142.13 | 816 | 801 | 164.7 |
| A | 13 | 254 | 9029 | 49.97 | 816 | 801 | 164.7 |
| B | 6 | 36 | 20885 | 130.19 | 802 | 780 | 154.4 |
| B | 12 | 111 | 18824 | 116.84 | 802 | 780 | 154.4 |
| B | 11 | 111 | 17413 | 107.71 | 802 | 780 | 154.4 |
| C | 7 | 87 | 5318093 | 38848.66 | 587 | 591 | 136.9 |
| C | 14 | 238 | 93333 | 677.56 | 587 | 591 | 136.9 |
| C | 3 | 233 | 36301 | 260.89 | 587 | 591 | 136.9 |
| D | 1 | 52 | 589782 | 3162.03 | 780 | 760 | 186.3 |
| D | 7 | 80 | 571202 | 3062.29 | 780 | 760 | 186.3 |
| D | 12 | 233 | 171417 | 916.13 | 780 | 760 | 186.3 |
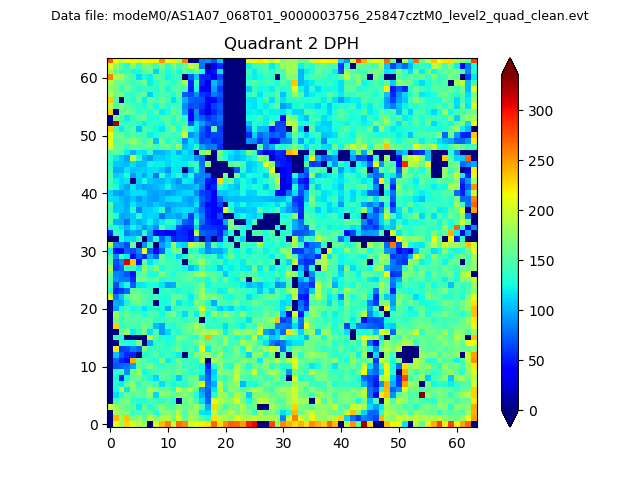
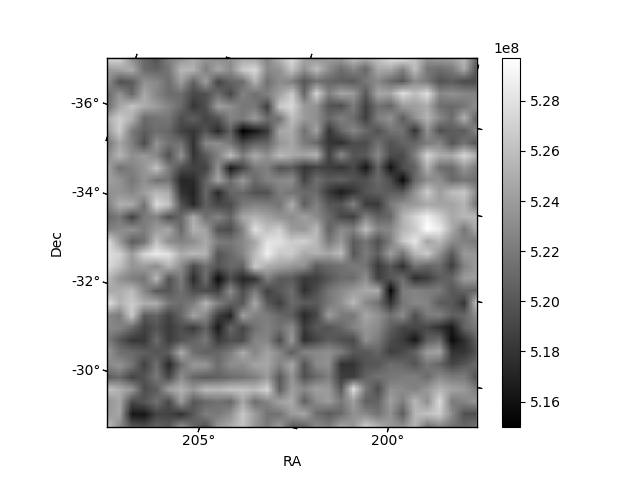
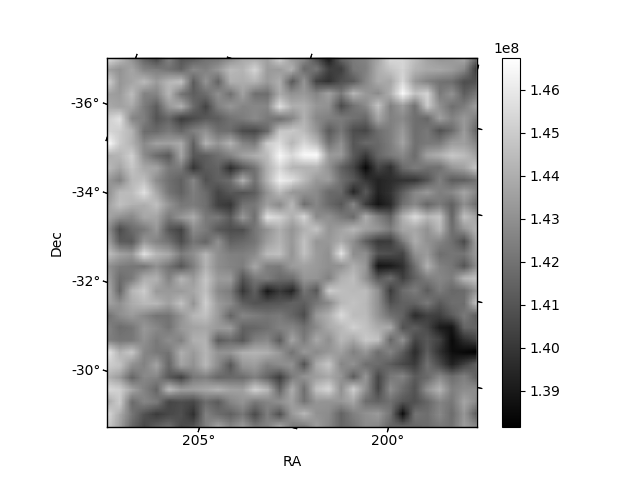
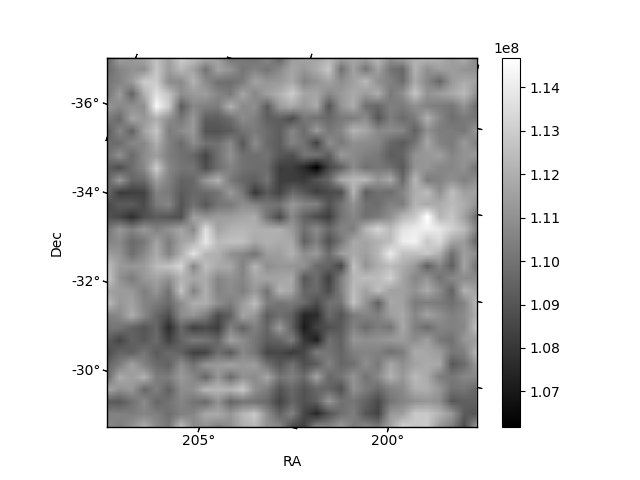
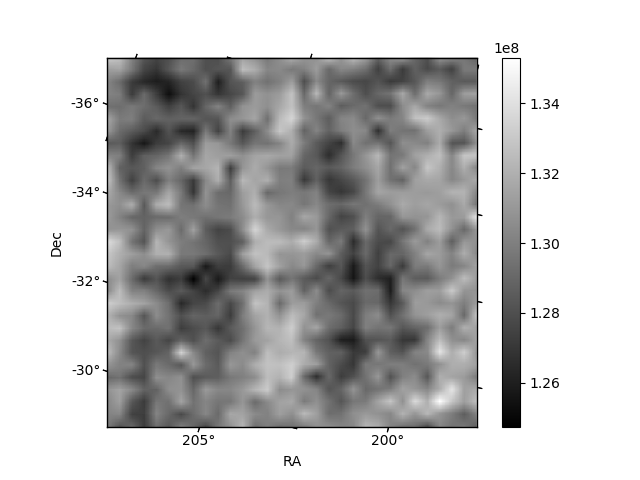
Histogram calculated using DETX and DETY for each event in the final _common_clean file
| Quadrant A | 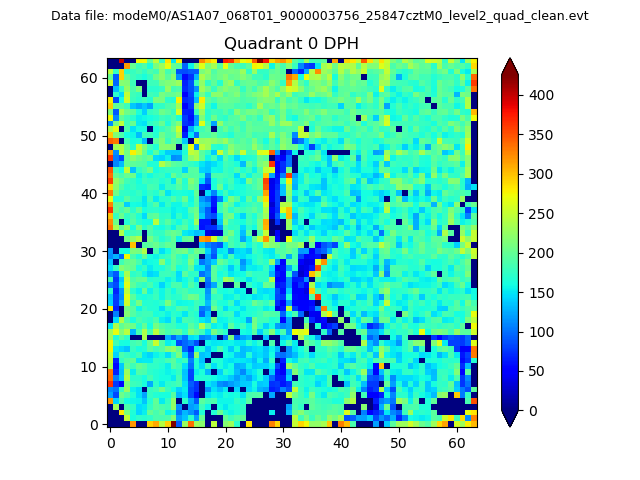 |
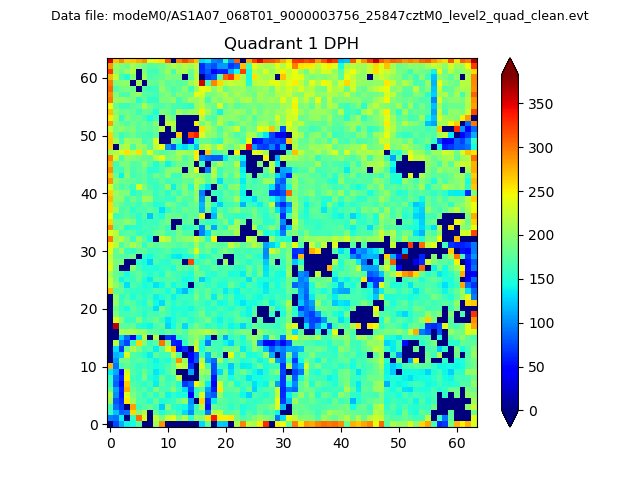 |
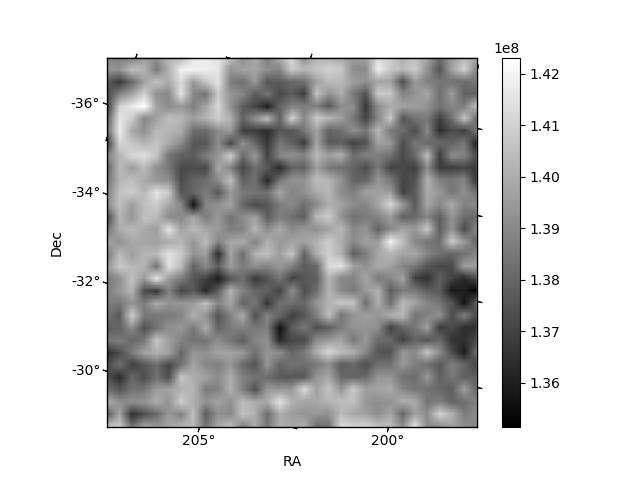
Quadrant B |
|---|---|---|---|
| Quadrant D | 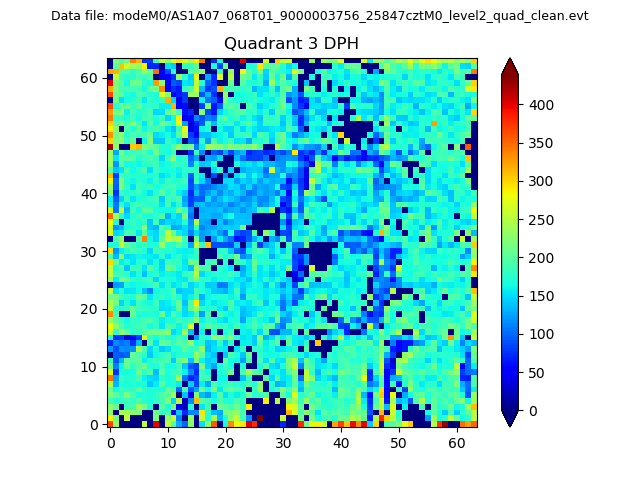 |
 |
Quadrant C |
| Plot type | Count rate plots | Images |
|---|---|---|
| Comparison with Poisson distribution Blue bars denote a histogram of data divided into 1 sec bins. Red curve is a Poisson curve with rate = median count rate of data. |
 |
 |
| Quadrant-wise count rates Data is divided into 100 sec bins |
 |
|
| Module-wise count rates for Quadrant A Data is divided into 100 sec bins |
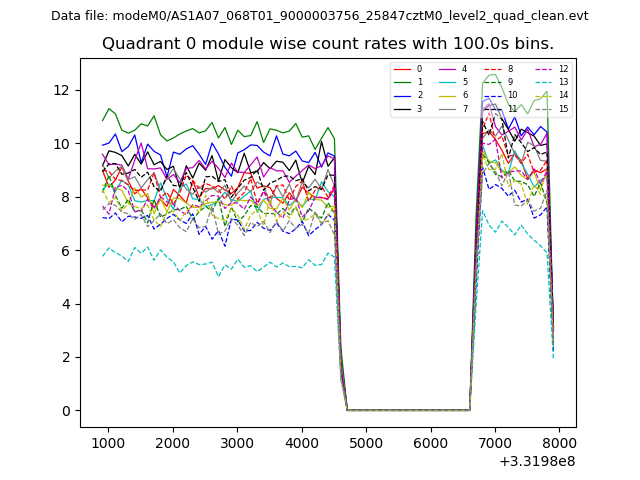 |
 |
| Module-wise count rates for Quadrant B Data is divided into 100 sec bins |
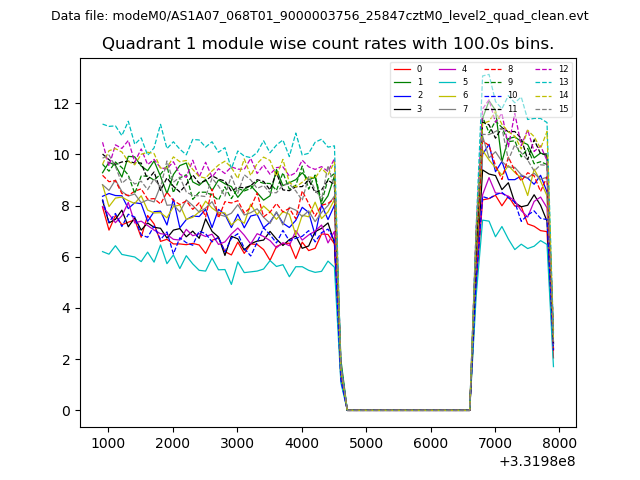 |
 |
| Module-wise count rates for Quadrant C Data is divided into 100 sec bins |
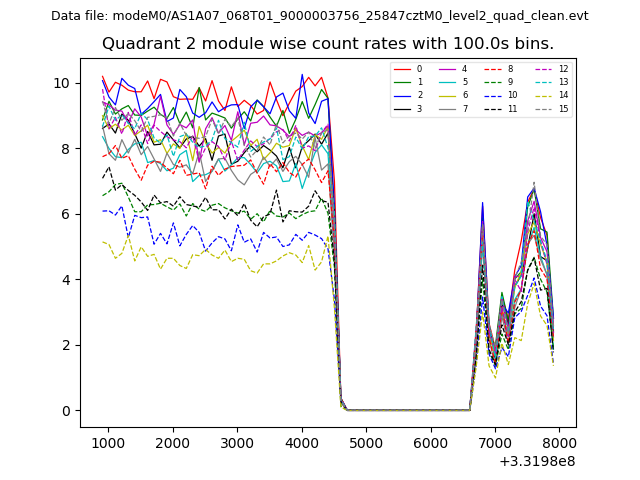 |
 |
| Module-wise count rates for Quadrant D Data is divided into 100 sec bins |
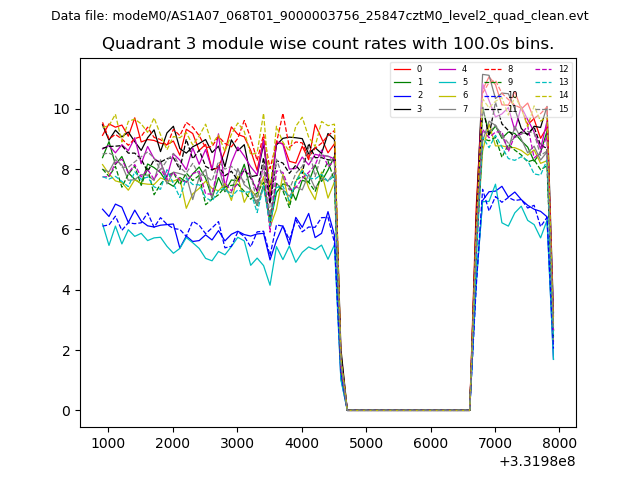 |
 |
| Parameter | Plot |
|---|---|
| CZT HV Monitor | 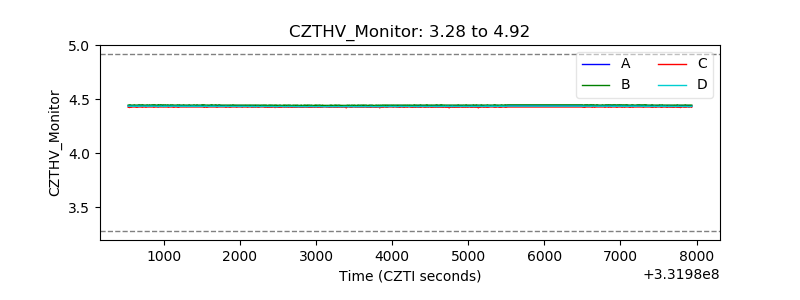 |
| D_VDD | 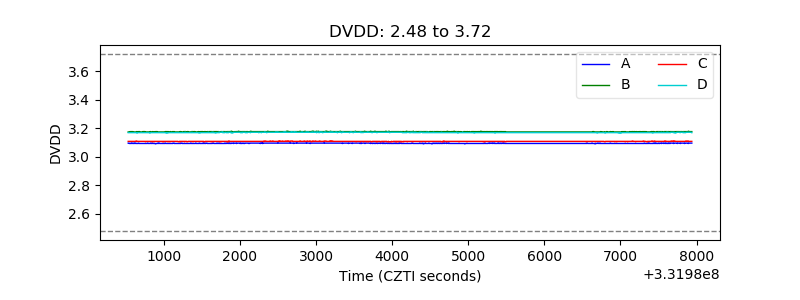 |
| Temperature 1 | 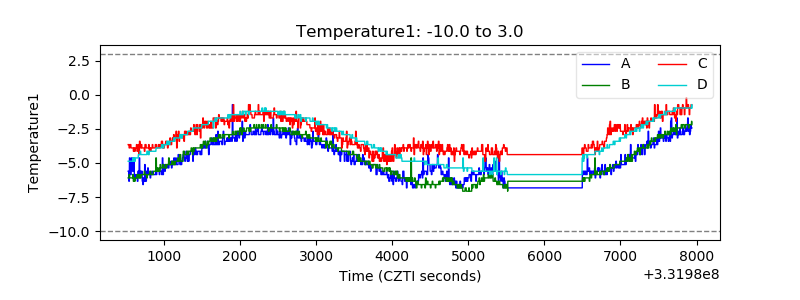 |
| Veto HV Monitor | 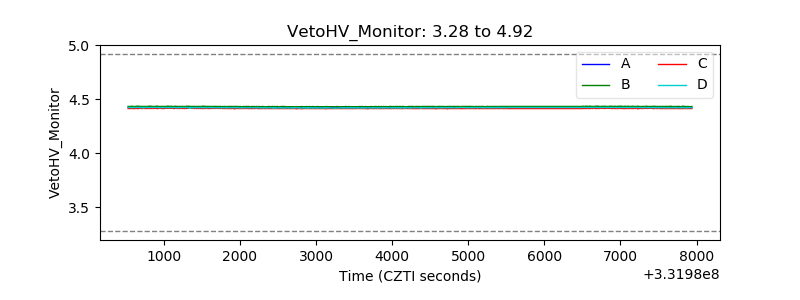 |
| Veto LLD | 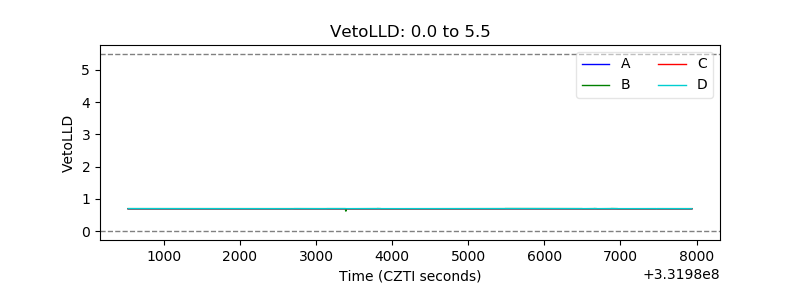 |
| Alpha Counter |  |
| _CPM_Rate |  |
| CZT Counter | 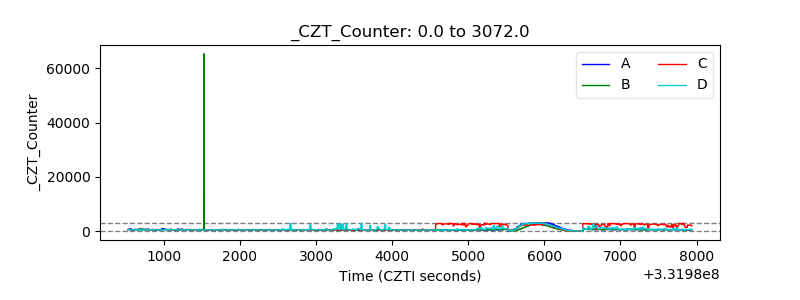 |
| +2.5 Volts monitor |  |
| +5 Volts monitor |  |
| _ROLL_ROT | 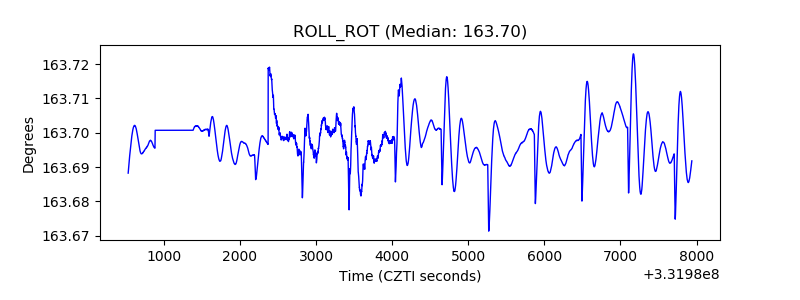 |
| _Roll_DEC | 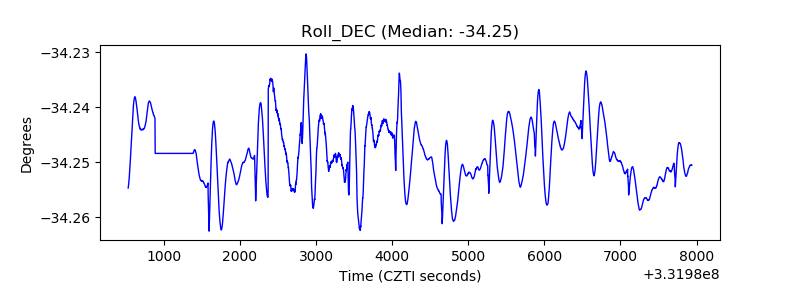 |
| _Roll_RA | 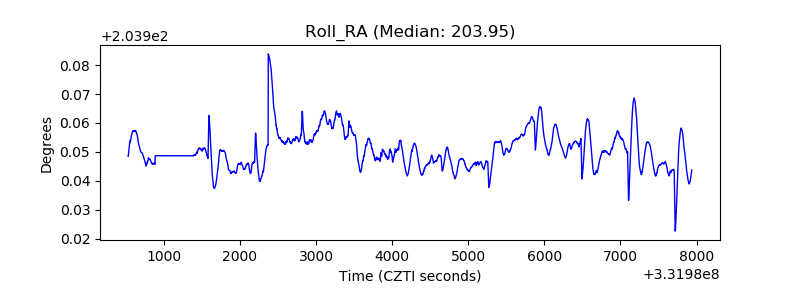 |
| Veto Counter | 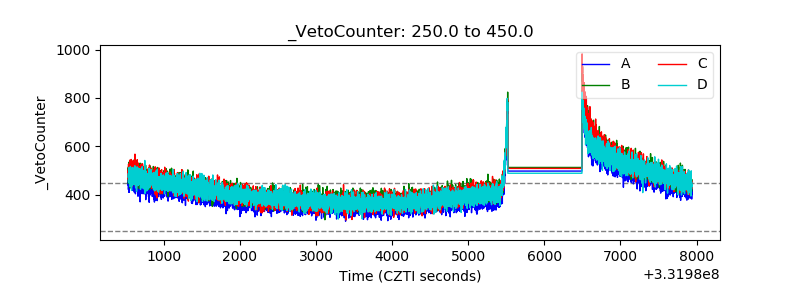 |