| Param | Original file | Final file |
|---|---|---|
| Filename | modeM0/AS1A07_068T01_9000003756_25849cztM0_level2.evt | modeM0/AS1A07_068T01_9000003756_25849cztM0_level2_quad_clean.evt |
| Size (bytes) | 700,490,880 | 103,821,120 |
| Size | 668.0 MB | 99.0 MB |
| Events in quadrant A | 3,530,390 | 737,936 |
| Events in quadrant B | 3,145,308 | 740,457 |
| Events in quadrant C | 10,175,994 | 533,274 |
| Events in quadrant D | 3,939,572 | 694,847 |
| Mode M0 | |||
|---|---|---|---|
| Quadrant | BADHDUFLAG | Total packets | Discarded packets |
| A | 0 | 14565 | 0 |
| B | 0 | 13320 | 0 |
| C | 0 | 34624 | 0 |
| D | 0 | 15865 | 0 |
| Mode M9 | |||
|---|---|---|---|
| Quadrant | BADHDUFLAG | Total packets | Discarded packets |
| A | 0 | 11 | 0 |
| B | 0 | 11 | 0 |
| C | 0 | 11 | 0 |
| D | 0 | 11 | 0 |
| Quadrant | Total seconds | Saturated seconds | Saturation percentage |
|---|---|---|---|
| A | 6252 | 118 | 1.887396% |
| B | 6253 | 65 | 1.039501% |
| C | 6253 | 2689 | 43.003358% |
| D | 6253 | 191 | 3.054534% |
Noise dominated data is calculated using 1-second bins in cleaned event files. If a bin has >2000 counts, and if more than 50% of those come from <1% of pixels, then it is considered to be noise-dominated and hence unusable.
| Quadrant | # 1 sec bins | Bins with >0 counts | Bins with >2000 counts | High rate bins dominated by noise | Noise dominated (total time) | Noise dominated (detector-on time) | Marked lightcurve |
|---|---|---|---|---|---|---|---|
| A | 7357 | 6253 | 33 | 33 | 0.45% | 0.53% | 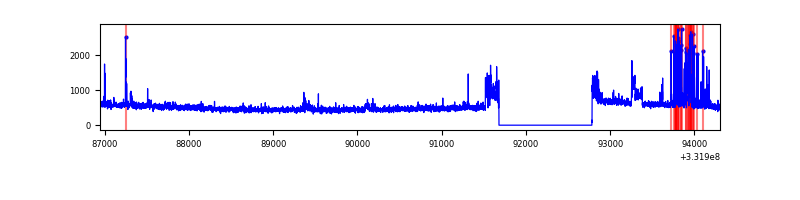 |
| B | 7358 | 6254 | 0 | 0 | 0.00% | 0.00% | 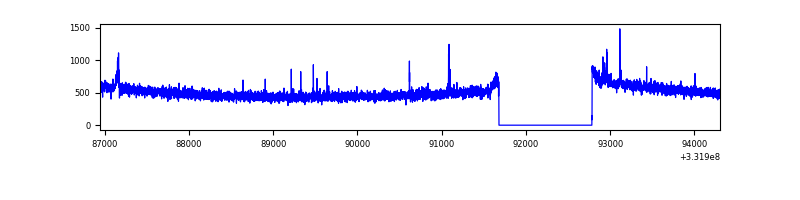 |
| C | 7358 | 6254 | 2214 | 2214 | 30.09% | 35.40% | 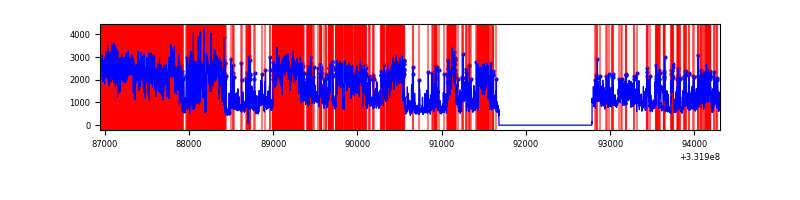 |
| D | 7358 | 6254 | 132 | 132 | 1.79% | 2.11% | 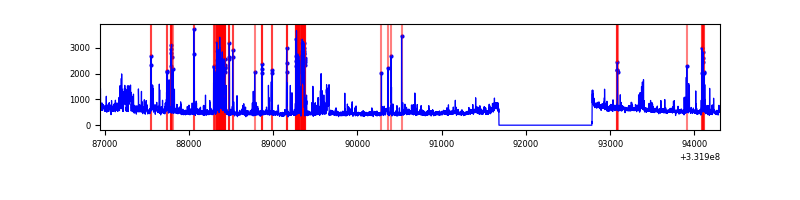 |
Top three noisy pixels from each quadrant. If the there are fewer than three noisy pixels in the level2.evt file, extra rows are filled as -1
| Pixel properties | Quadrant properties | ||||||
|---|---|---|---|---|---|---|---|
| Quadrant | DetID | PixID | Counts | Sigma | Mean | Median | Sigma |
| A | 0 | 13 | 291749 | 1795.11 | 813 | 798 | 162.1 |
| A | 6 | 16 | 96099 | 587.99 | 813 | 798 | 162.1 |
| A | 13 | 254 | 9111 | 51.29 | 813 | 798 | 162.1 |
| B | 6 | 36 | 27317 | 173.9 | 797 | 776 | 152.6 |
| B | 12 | 111 | 18229 | 114.35 | 797 | 776 | 152.6 |
| B | 11 | 111 | 16727 | 104.51 | 797 | 776 | 152.6 |
| C | 7 | 87 | 7560975 | 51437.25 | 634 | 640 | 147.0 |
| C | 14 | 238 | 100788 | 681.36 | 634 | 640 | 147.0 |
| C | 7 | 226 | 17421 | 114.17 | 634 | 640 | 147.0 |
| D | 1 | 52 | 434668 | 2335.38 | 781 | 763 | 185.8 |
| D | 12 | 233 | 423491 | 2275.22 | 781 | 763 | 185.8 |
| D | 7 | 80 | 85216 | 454.55 | 781 | 763 | 185.8 |
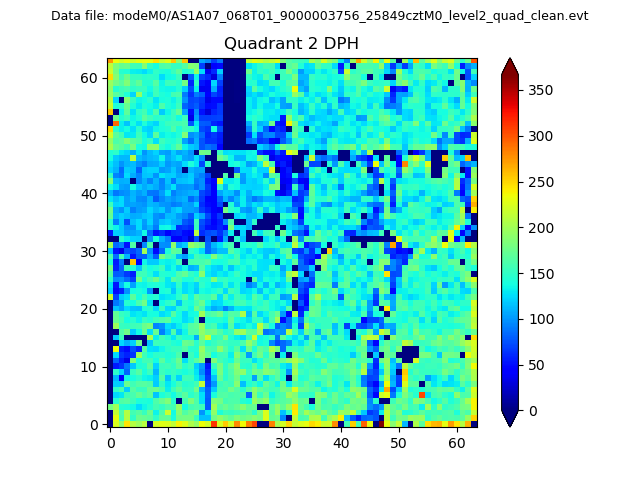
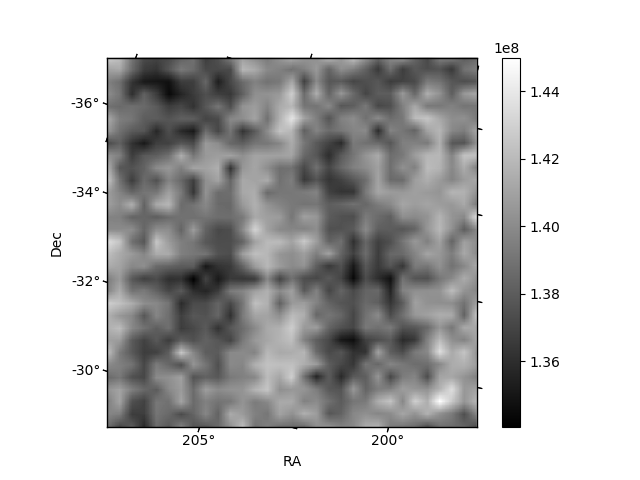
Histogram calculated using DETX and DETY for each event in the final _common_clean file
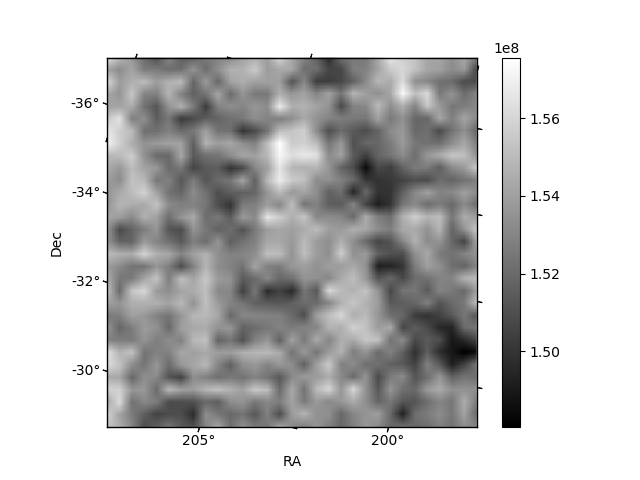
| Quadrant A | 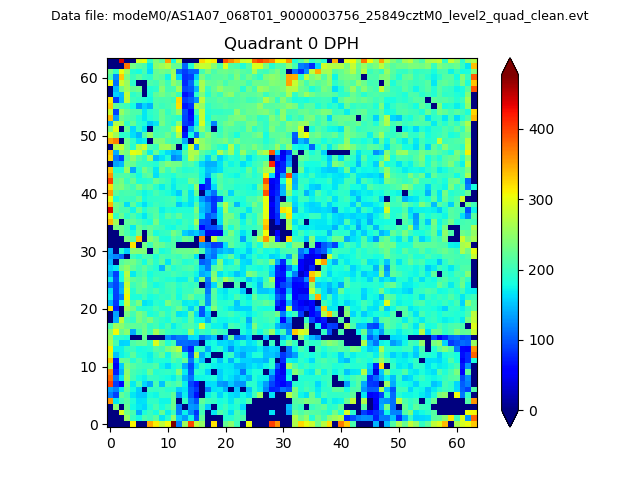 |
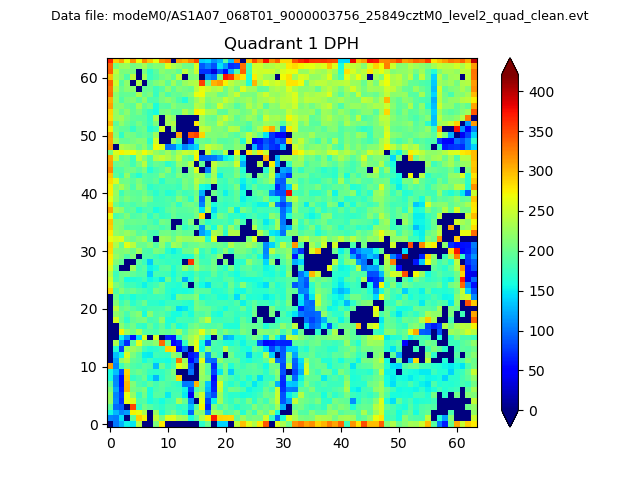 |
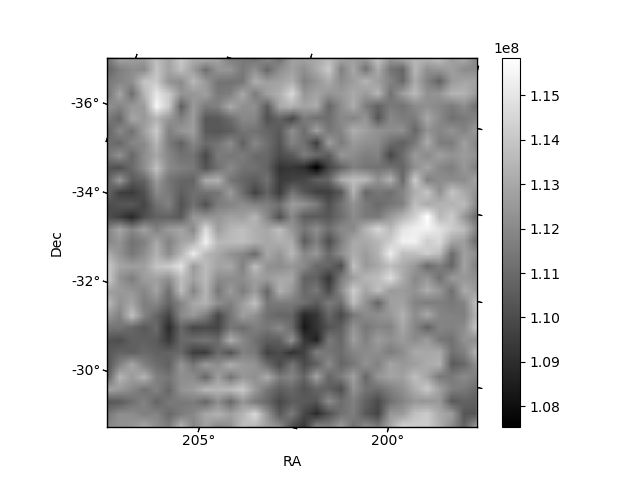
Quadrant B |
|---|---|---|---|
| Quadrant D | 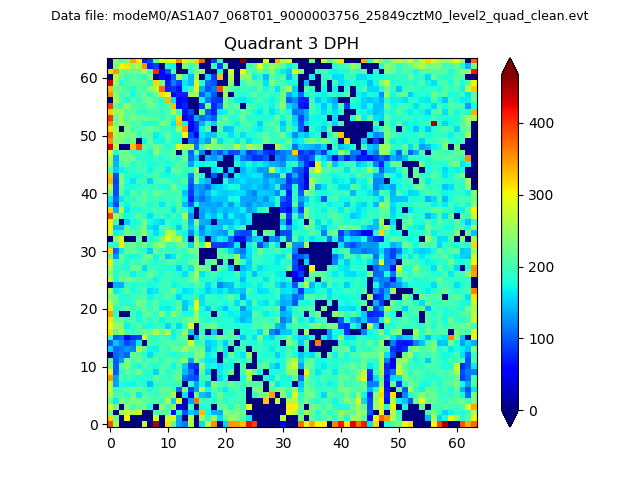 |
 |
Quadrant C |
| Plot type | Count rate plots | Images |
|---|---|---|
| Comparison with Poisson distribution Blue bars denote a histogram of data divided into 1 sec bins. Red curve is a Poisson curve with rate = median count rate of data. |
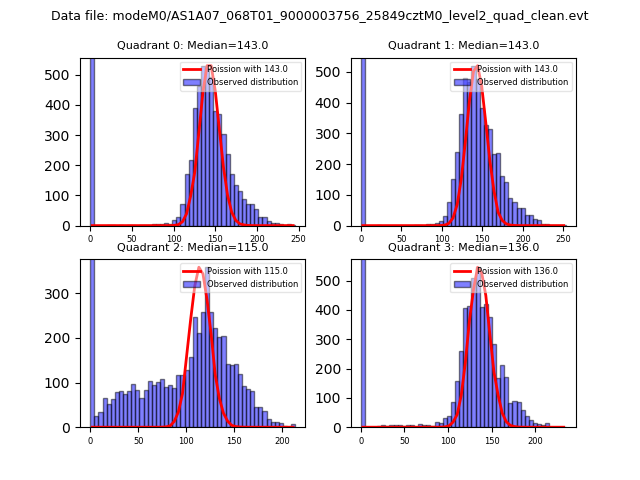 |
 |
| Quadrant-wise count rates Data is divided into 100 sec bins |
 |
|
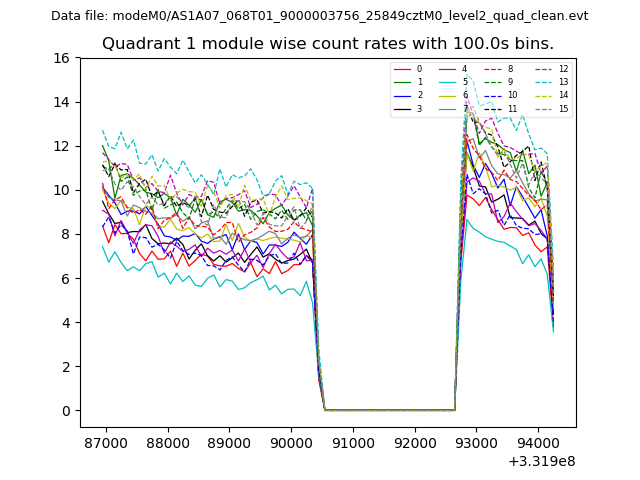
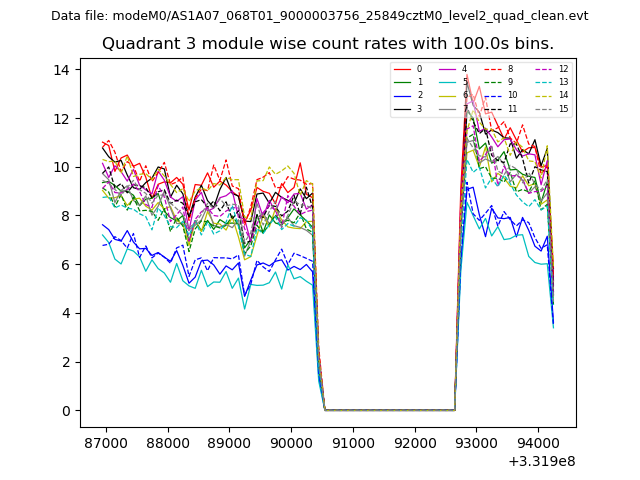
| Module-wise count rates for Quadrant A Data is divided into 100 sec bins |
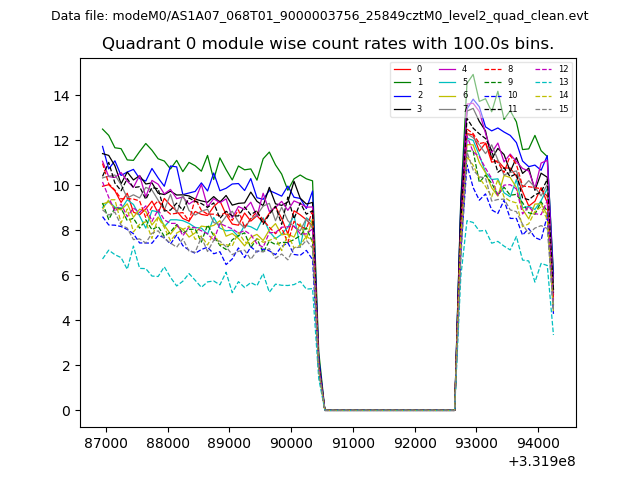 |
 |
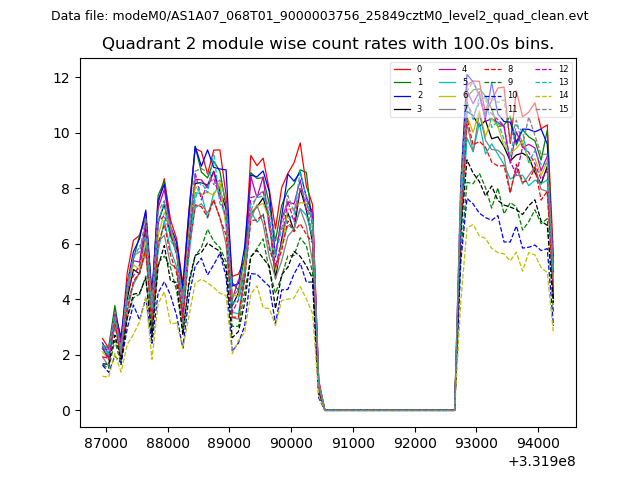
| Module-wise count rates for Quadrant B Data is divided into 100 sec bins |
 |
 |
| Module-wise count rates for Quadrant C Data is divided into 100 sec bins |
 |
 |
| Module-wise count rates for Quadrant D Data is divided into 100 sec bins |
 |
 |
| Parameter | Plot |
|---|---|
| CZT HV Monitor | 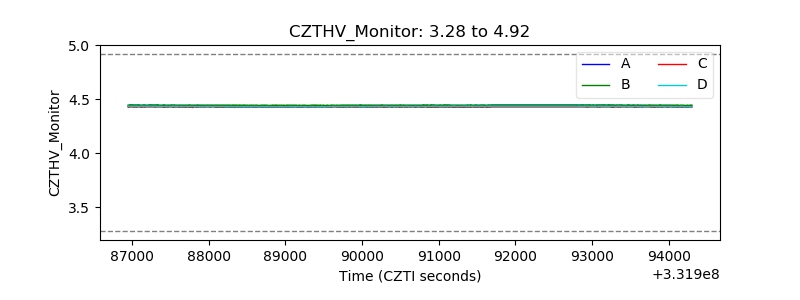 |
| D_VDD | 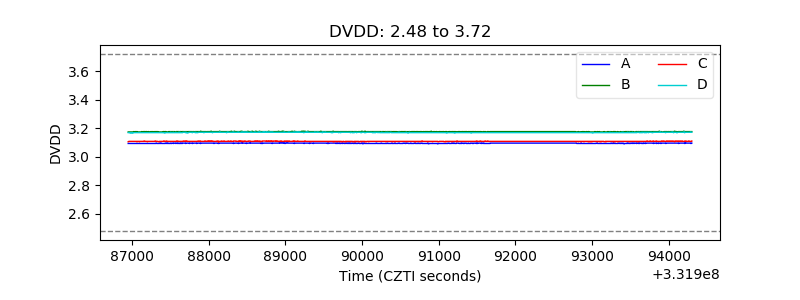 |
| Temperature 1 |  |
| Veto HV Monitor | 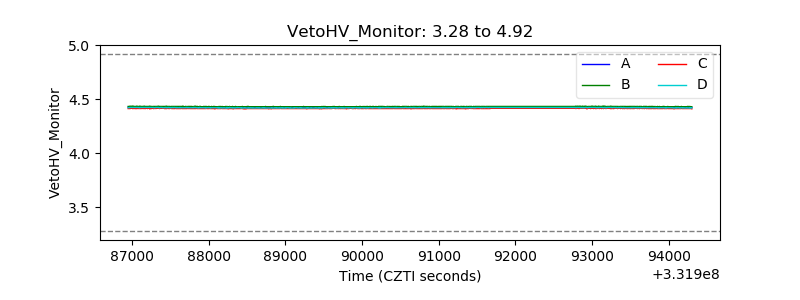 |
| Veto LLD | 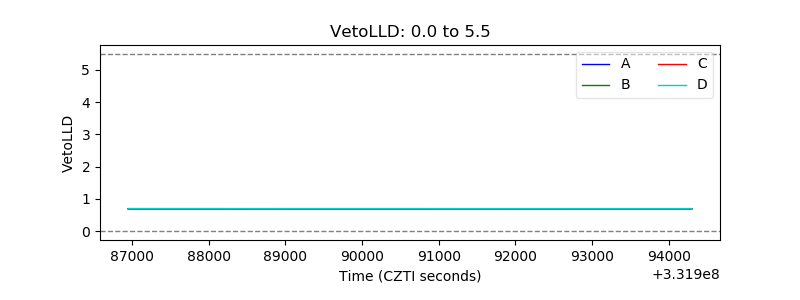 |
| Alpha Counter | 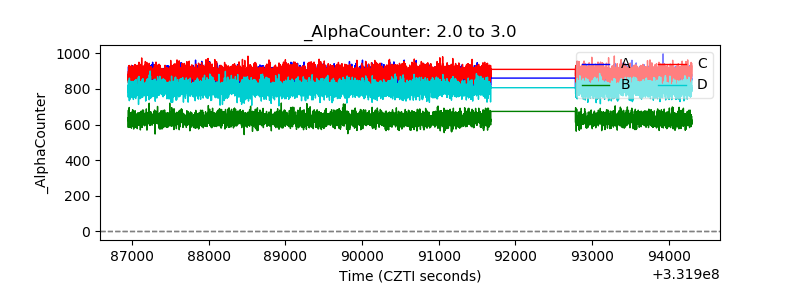 |
| _CPM_Rate | 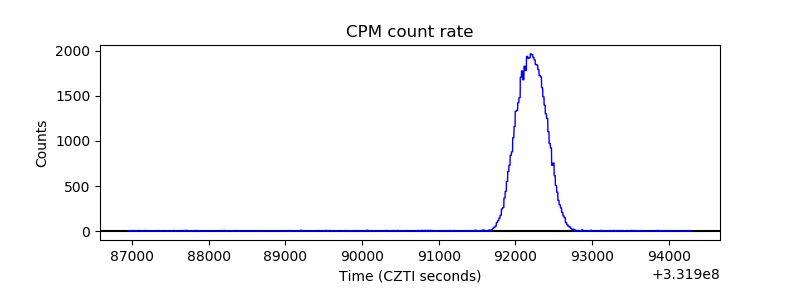 |
| CZT Counter |  |
| +2.5 Volts monitor |  |
| +5 Volts monitor |  |
| _ROLL_ROT | 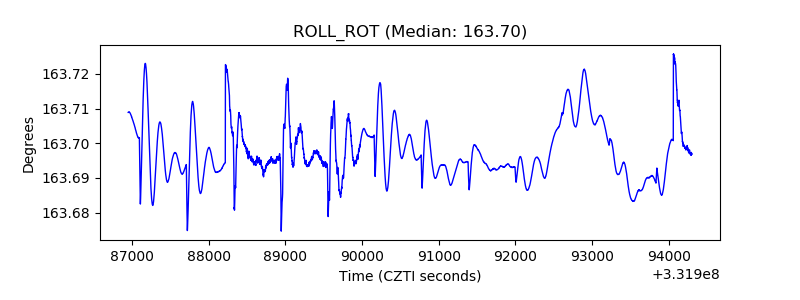 |
| _Roll_DEC | 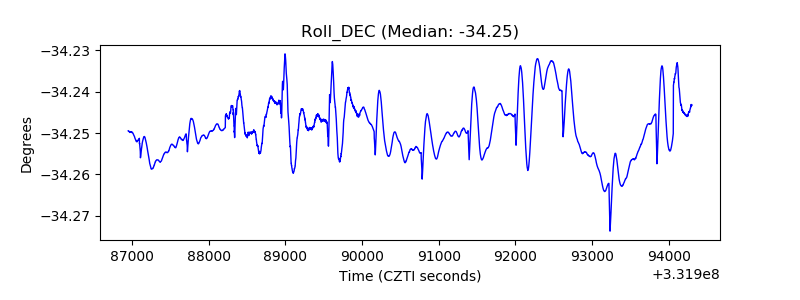 |
| _Roll_RA |  |
| Veto Counter | 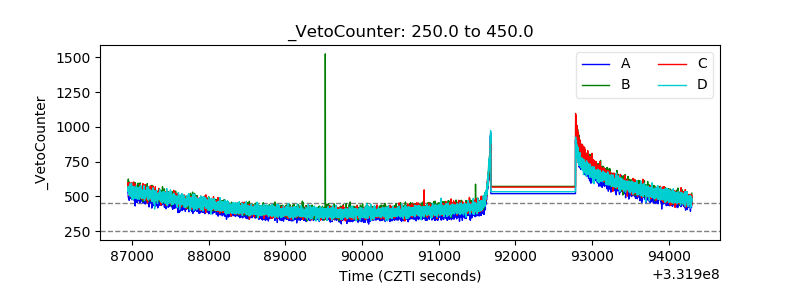 |