| Param | Original file | Final file |
|---|---|---|
| Filename | modeM0/AS1A07_068T01_9000003756_25850cztM0_level2.evt | modeM0/AS1A07_068T01_9000003756_25850cztM0_level2_quad_clean.evt |
| Size (bytes) | 1,618,735,680 | 250,905,600 |
| Size | 1.5 GB | 239.3 MB |
| Events in quadrant A | 8,475,052 | 1,738,808 |
| Events in quadrant B | 7,995,561 | 1,734,338 |
| Events in quadrant C | 20,956,852 | 1,402,065 |
| Events in quadrant D | 10,524,186 | 1,625,198 |
| Mode M0 | |||
|---|---|---|---|
| Quadrant | BADHDUFLAG | Total packets | Discarded packets |
| A | 0 | 35504 | 0 |
| B | 0 | 34165 | 0 |
| C | 0 | 73460 | 0 |
| D | 0 | 42044 | 0 |
| Mode M9 | |||
|---|---|---|---|
| Quadrant | BADHDUFLAG | Total packets | Discarded packets |
| A | 0 | 33 | 0 |
| B | 0 | 33 | 0 |
| C | 0 | 33 | 0 |
| D | 0 | 33 | 0 |
| Quadrant | Total seconds | Saturated seconds | Saturation percentage |
|---|---|---|---|
| A | 15917 | 258 | 1.620908% |
| B | 15918 | 199 | 1.250157% |
| C | 15918 | 4767 | 29.947230% |
| D | 15918 | 739 | 4.642543% |
Noise dominated data is calculated using 1-second bins in cleaned event files. If a bin has >2000 counts, and if more than 50% of those come from <1% of pixels, then it is considered to be noise-dominated and hence unusable.
| Quadrant | # 1 sec bins | Bins with >0 counts | Bins with >2000 counts | High rate bins dominated by noise | Noise dominated (total time) | Noise dominated (detector-on time) | Marked lightcurve |
|---|---|---|---|---|---|---|---|
| A | 19207 | 15920 | 54 | 54 | 0.28% | 0.34% | 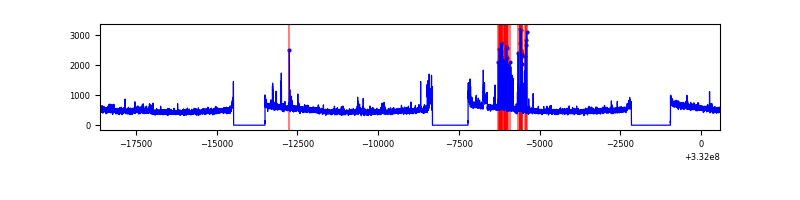 |
| B | 19208 | 15921 | 12 | 12 | 0.06% | 0.08% | 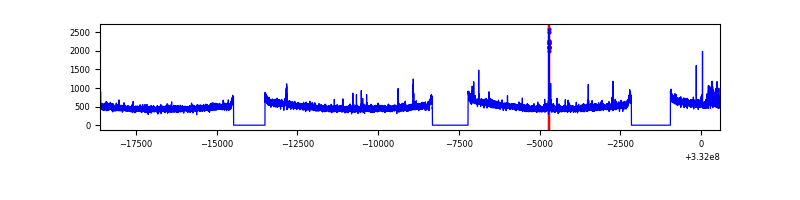 |
| C | 19208 | 15921 | 3927 | 3927 | 20.44% | 24.67% | 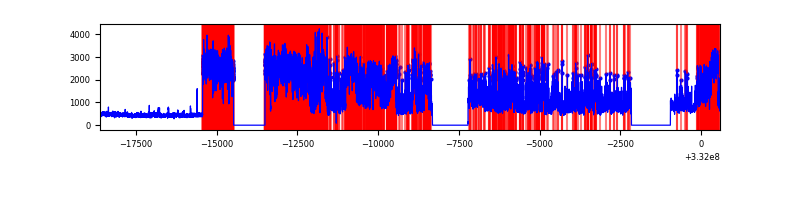 |
| D | 19208 | 15921 | 539 | 539 | 2.81% | 3.39% | 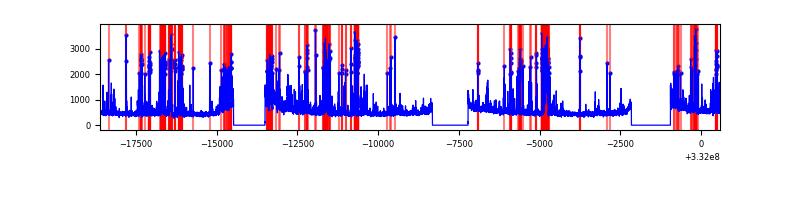 |
Top three noisy pixels from each quadrant. If the there are fewer than three noisy pixels in the level2.evt file, extra rows are filled as -1
| Pixel properties | Quadrant properties | ||||||
|---|---|---|---|---|---|---|---|
| Quadrant | DetID | PixID | Counts | Sigma | Mean | Median | Sigma |
| A | 0 | 13 | 408106 | 1003.42 | 2046 | 2008 | 404.7 |
| A | 6 | 16 | 169639 | 414.2 | 2046 | 2008 | 404.7 |
| A | 13 | 254 | 23305 | 52.62 | 2046 | 2008 | 404.7 |
| B | 15 | 33 | 56169 | 144.32 | 2005 | 1959 | 375.6 |
| B | 12 | 111 | 45719 | 116.5 | 2005 | 1959 | 375.6 |
| B | 11 | 111 | 41660 | 105.7 | 2005 | 1959 | 375.6 |
| C | 7 | 87 | 14202803 | 37794.0 | 1634 | 1645 | 375.8 |
| C | 14 | 238 | 260364 | 688.54 | 1634 | 1645 | 375.8 |
| C | 3 | 233 | 80233 | 209.15 | 1634 | 1645 | 375.8 |
| D | 1 | 52 | 1327093 | 2879.34 | 1946 | 1903 | 460.2 |
| D | 12 | 233 | 1164588 | 2526.25 | 1946 | 1903 | 460.2 |
| D | 7 | 80 | 575525 | 1246.35 | 1946 | 1903 | 460.2 |
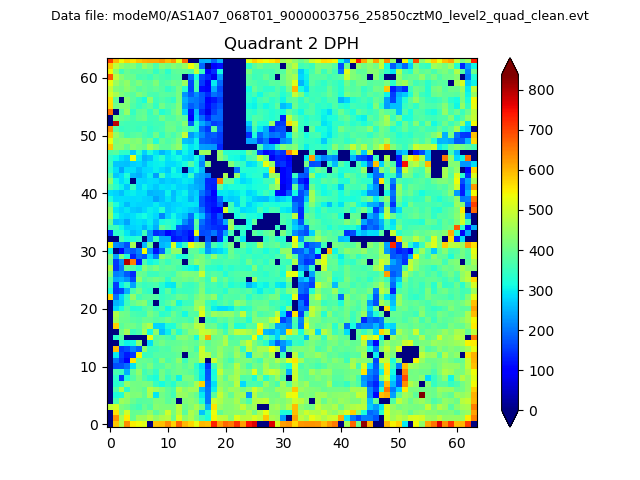
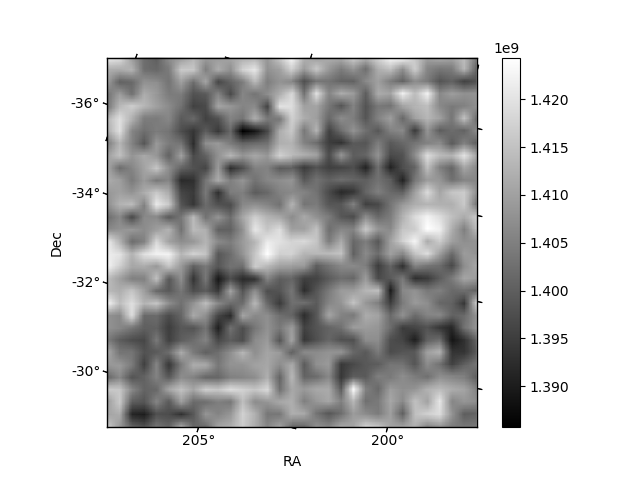
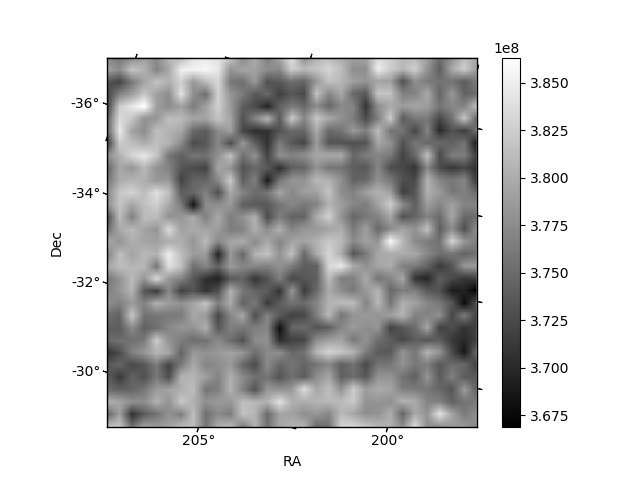
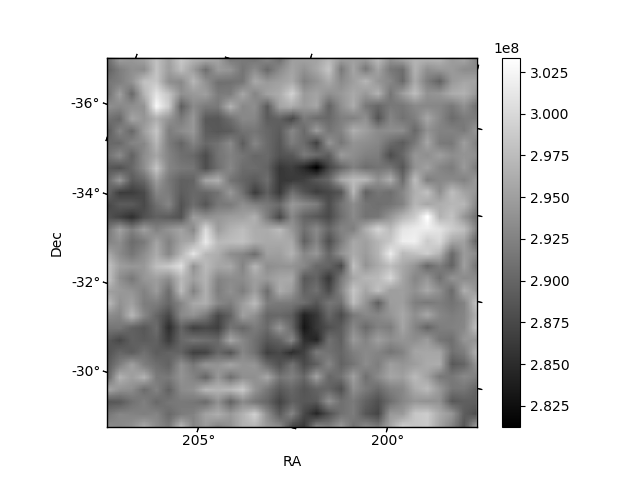
Histogram calculated using DETX and DETY for each event in the final _common_clean file
| Quadrant A | 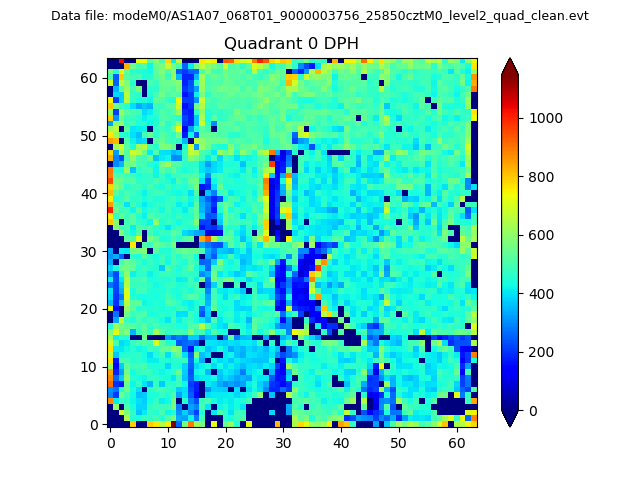 |
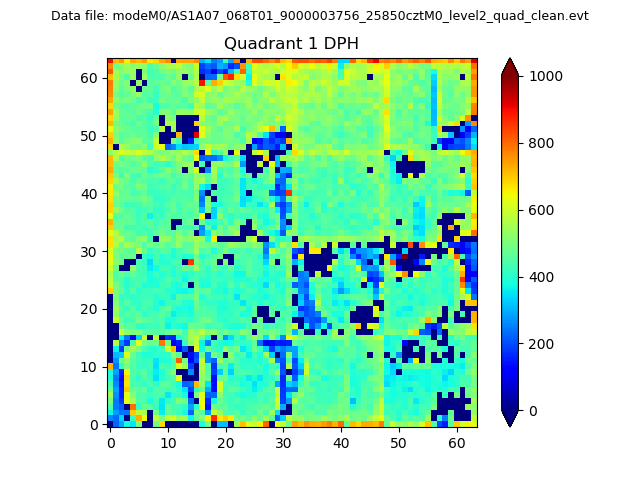 |
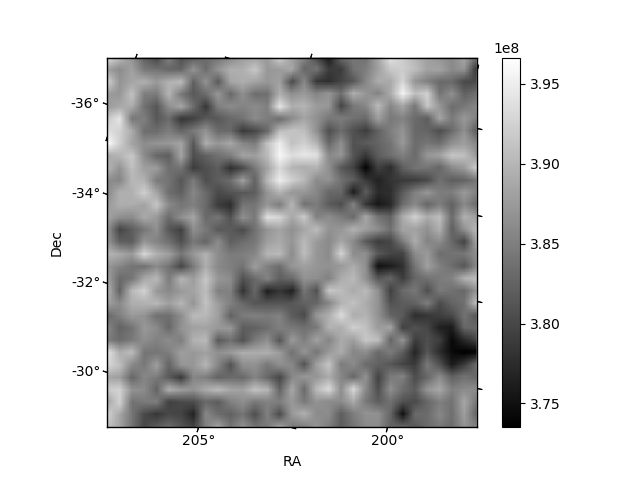
Quadrant B |
|---|---|---|---|
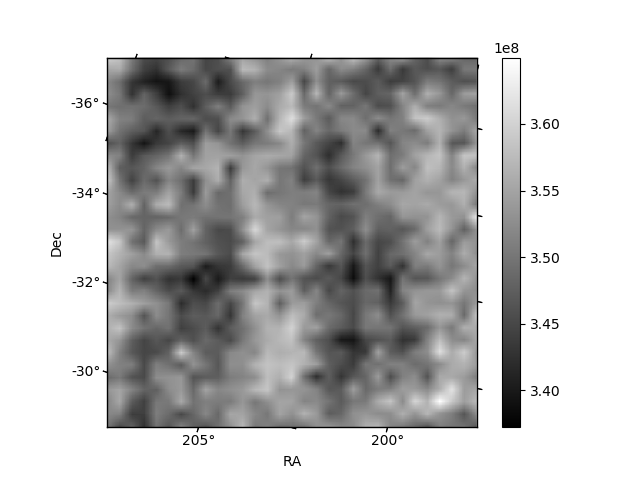
| Quadrant D | 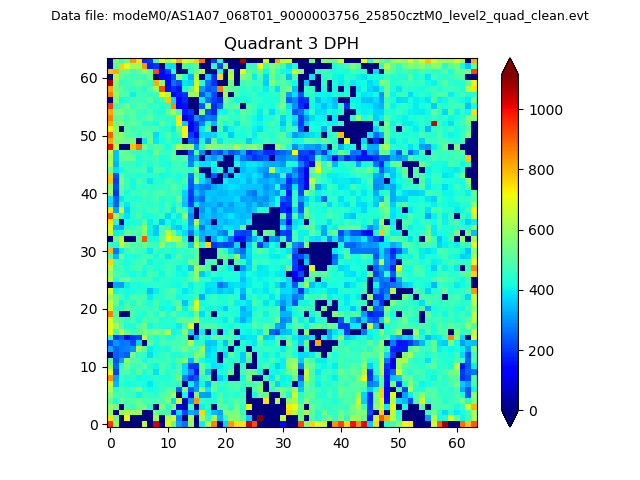 |
 |
Quadrant C |
| Plot type | Count rate plots | Images |
|---|---|---|
| Comparison with Poisson distribution Blue bars denote a histogram of data divided into 1 sec bins. Red curve is a Poisson curve with rate = median count rate of data. |
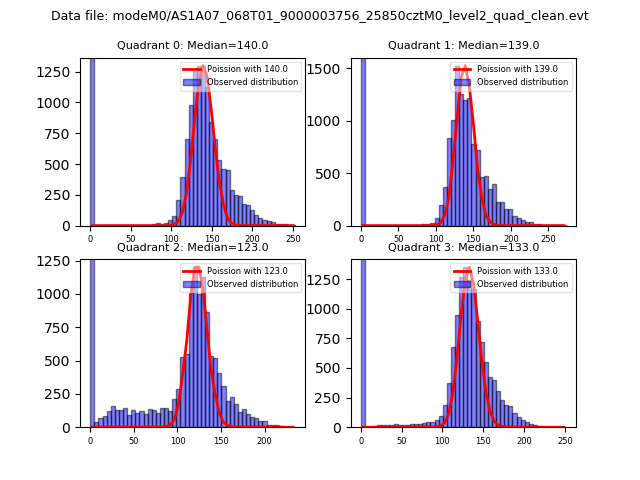 |
 |
| Quadrant-wise count rates Data is divided into 100 sec bins |
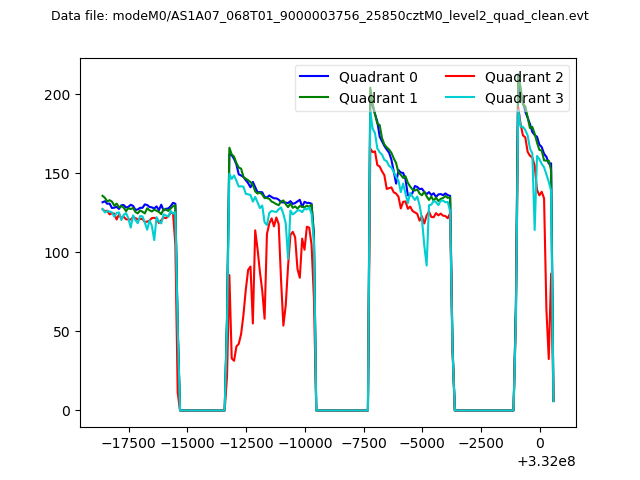 |
|
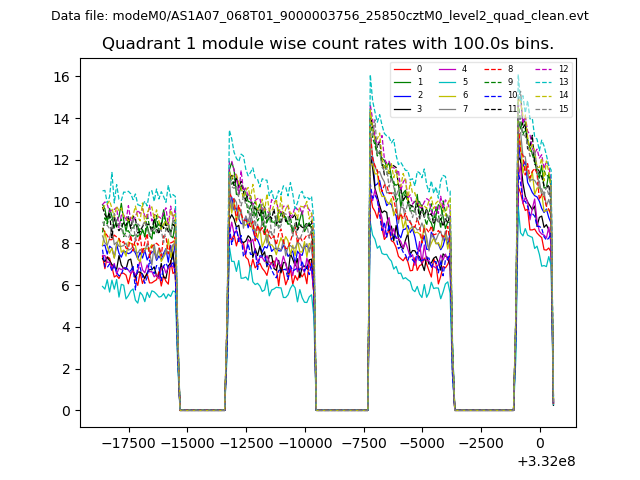
| Module-wise count rates for Quadrant A Data is divided into 100 sec bins |
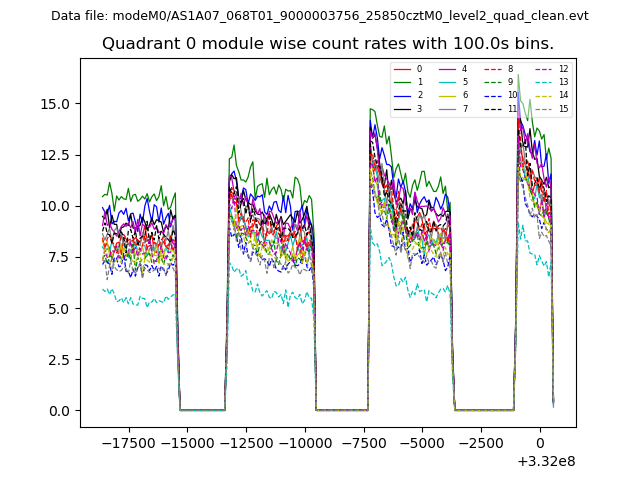 |
 |
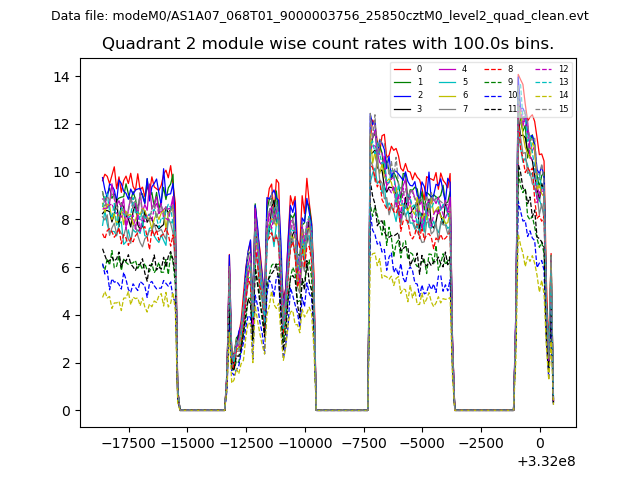
| Module-wise count rates for Quadrant B Data is divided into 100 sec bins |
 |
 |
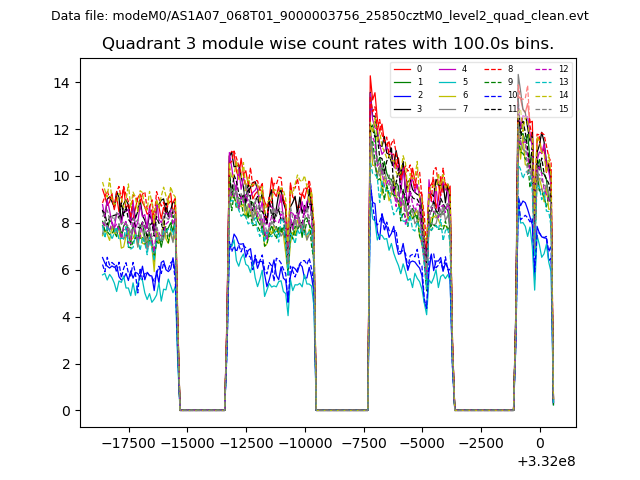
| Module-wise count rates for Quadrant C Data is divided into 100 sec bins |
 |
 |
| Module-wise count rates for Quadrant D Data is divided into 100 sec bins |
 |
 |
| Parameter | Plot |
|---|---|
| CZT HV Monitor | 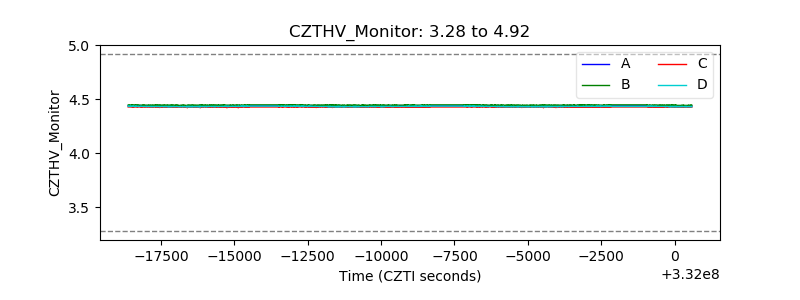 |
| D_VDD | 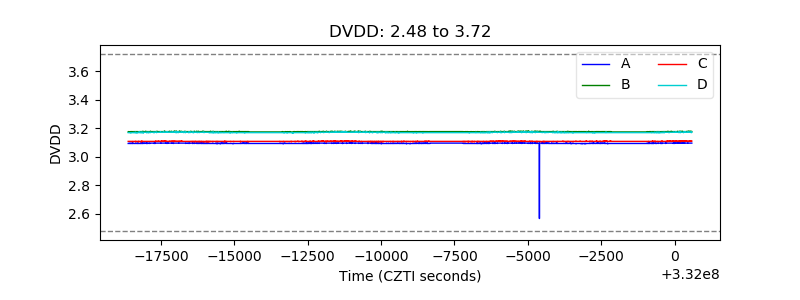 |
| Temperature 1 | 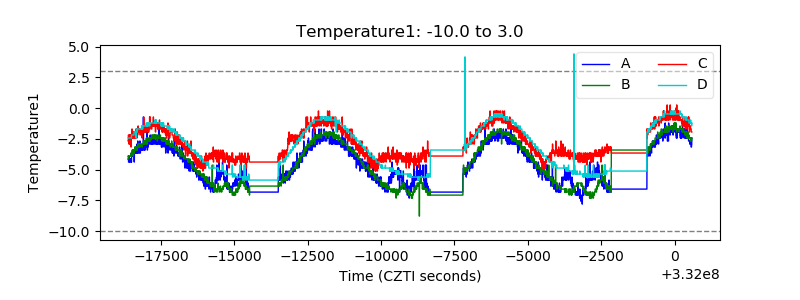 |
| Veto HV Monitor | 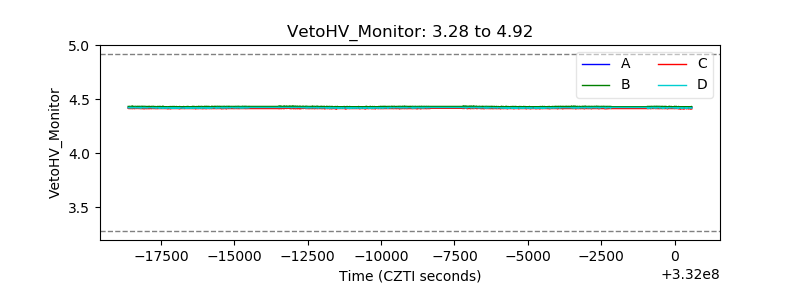 |
| Veto LLD | 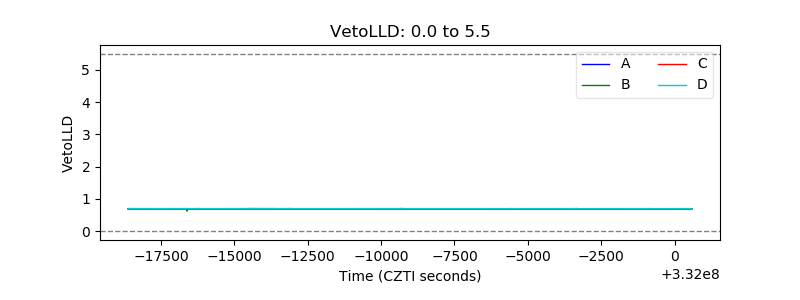 |
| Alpha Counter | 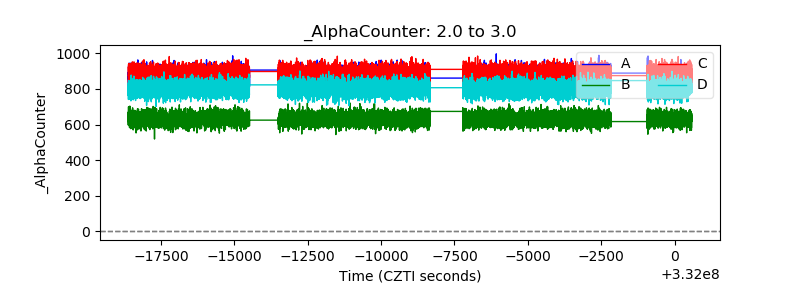 |
| _CPM_Rate | 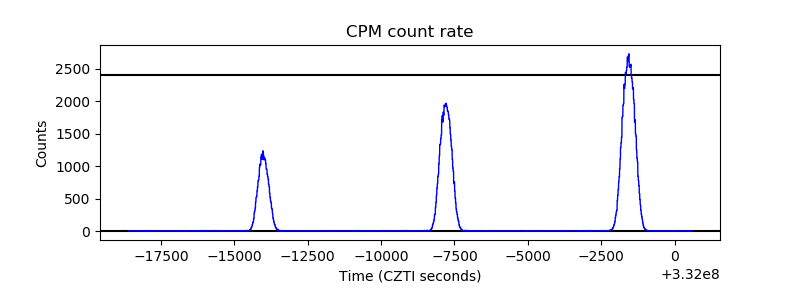 |
| CZT Counter | 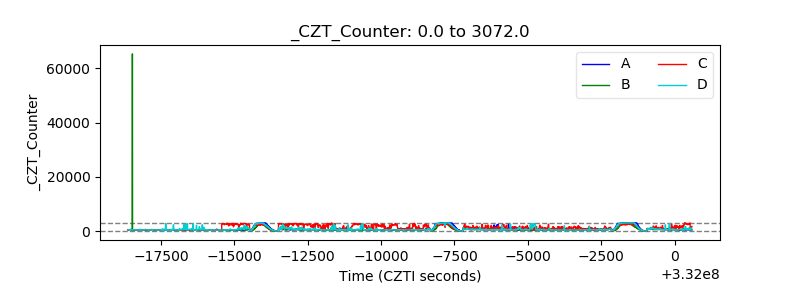 |
| +2.5 Volts monitor |  |
| +5 Volts monitor |  |
| _ROLL_ROT | 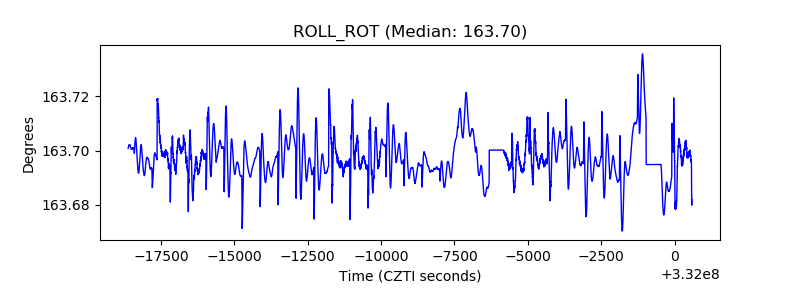 |
| _Roll_DEC | 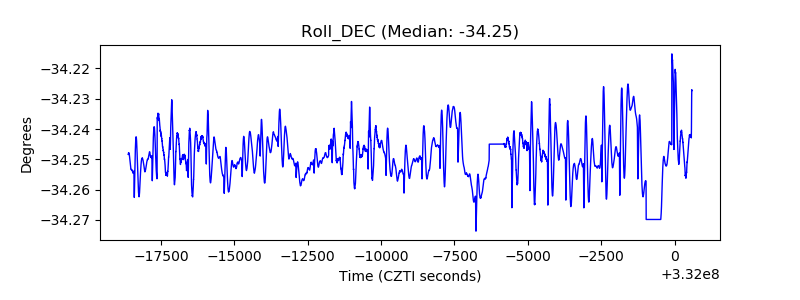 |
| _Roll_RA | 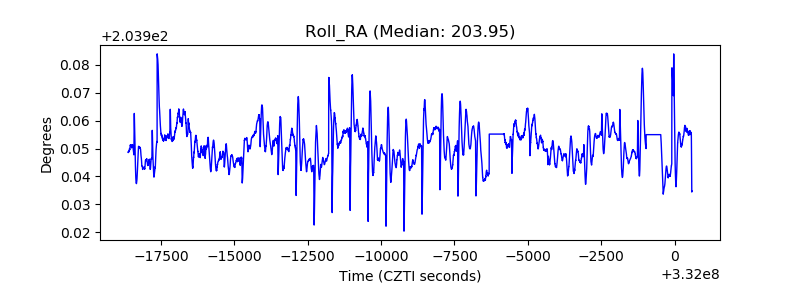 |
| Veto Counter | 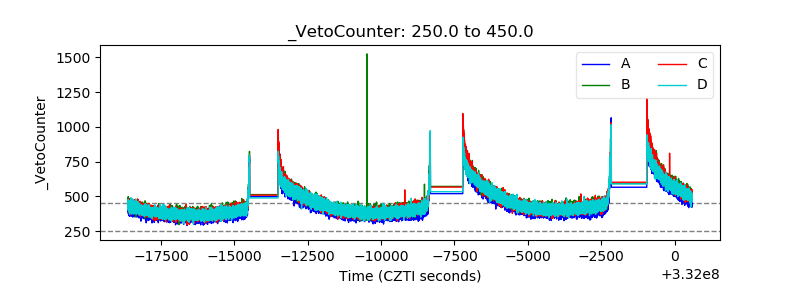 |