| Param | Original file | Final file |
|---|---|---|
| Filename | modeM0/AS1A07_068T01_9000003756_25851cztM0_level2.evt | modeM0/AS1A07_068T01_9000003756_25851cztM0_level2_quad_clean.evt |
| Size (bytes) | 633,723,840 | 96,886,080 |
| Size | 604.4 MB | 92.4 MB |
| Events in quadrant A | 3,180,407 | 677,599 |
| Events in quadrant B | 3,227,613 | 672,602 |
| Events in quadrant C | 6,756,641 | 573,875 |
| Events in quadrant D | 5,622,787 | 591,053 |
| Mode M0 | |||
|---|---|---|---|
| Quadrant | BADHDUFLAG | Total packets | Discarded packets |
| A | 0 | 13155 | 0 |
| B | 0 | 13315 | 0 |
| C | 0 | 24391 | 0 |
| D | 0 | 20751 | 0 |
| Mode M9 | |||
|---|---|---|---|
| Quadrant | BADHDUFLAG | Total packets | Discarded packets |
| A | 0 | 13 | 0 |
| B | 0 | 13 | 0 |
| C | 0 | 13 | 0 |
| D | 0 | 13 | 0 |
| Quadrant | Total seconds | Saturated seconds | Saturation percentage |
|---|---|---|---|
| A | 5991 | 64 | 1.068269% |
| B | 5992 | 68 | 1.134846% |
| C | 5991 | 868 | 14.488399% |
| D | 5991 | 799 | 13.336672% |
Noise dominated data is calculated using 1-second bins in cleaned event files. If a bin has >2000 counts, and if more than 50% of those come from <1% of pixels, then it is considered to be noise-dominated and hence unusable.
| Quadrant | # 1 sec bins | Bins with >0 counts | Bins with >2000 counts | High rate bins dominated by noise | Noise dominated (total time) | Noise dominated (detector-on time) | Marked lightcurve |
|---|---|---|---|---|---|---|---|
| A | 7291 | 5992 | 3 | 3 | 0.04% | 0.05% | 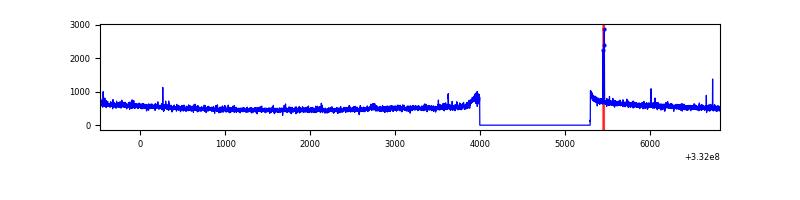 |
| B | 7292 | 5993 | 0 | 0 | 0.00% | 0.00% | 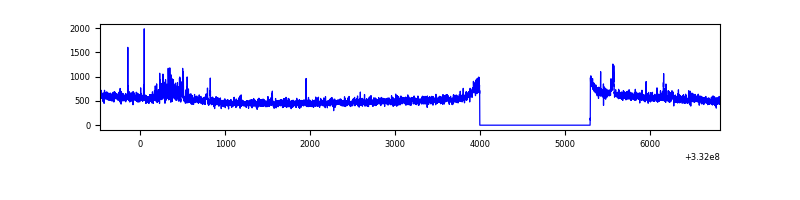 |
| C | 7291 | 5992 | 548 | 548 | 7.52% | 9.15% |  |
| D | 7291 | 5992 | 777 | 777 | 10.66% | 12.97% | 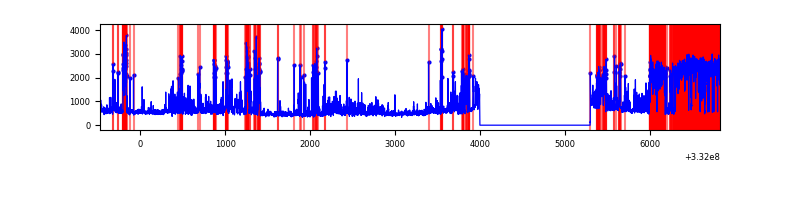 |
Top three noisy pixels from each quadrant. If the there are fewer than three noisy pixels in the level2.evt file, extra rows are filled as -1
| Pixel properties | Quadrant properties | ||||||
|---|---|---|---|---|---|---|---|
| Quadrant | DetID | PixID | Counts | Sigma | Mean | Median | Sigma |
| A | 0 | 13 | 41672 | 253.85 | 813 | 800 | 161.0 |
| A | 13 | 254 | 9680 | 55.15 | 813 | 800 | 161.0 |
| A | 0 | 226 | 7204 | 39.77 | 813 | 800 | 161.0 |
| B | 15 | 33 | 54701 | 361.24 | 794 | 778 | 149.3 |
| B | 0 | 229 | 21271 | 137.29 | 794 | 778 | 149.3 |
| B | 4 | 171 | 17691 | 113.3 | 794 | 778 | 149.3 |
| C | 7 | 87 | 3831093 | 23294.5 | 713 | 720 | 164.4 |
| C | 14 | 238 | 115484 | 697.94 | 713 | 720 | 164.4 |
| C | 3 | 233 | 14582 | 84.3 | 713 | 720 | 164.4 |
| D | 1 | 52 | 2395504 | 13574.92 | 743 | 726 | 176.4 |
| D | 12 | 233 | 347705 | 1966.87 | 743 | 726 | 176.4 |
| D | 14 | 35 | 29439 | 162.76 | 743 | 726 | 176.4 |
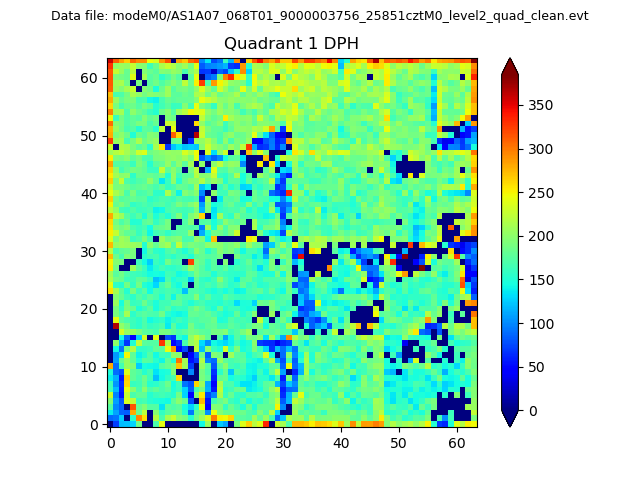
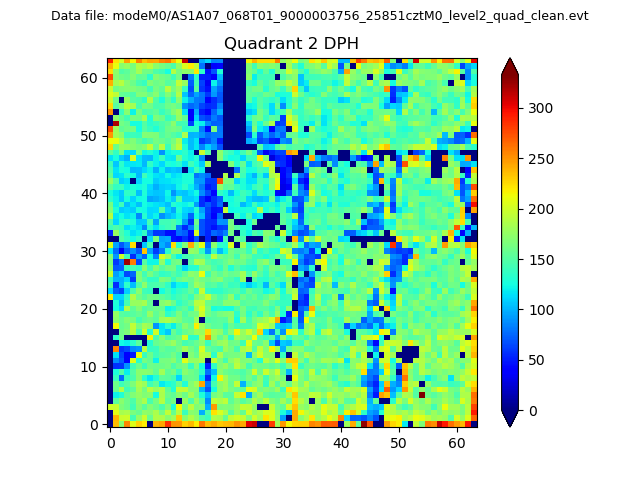
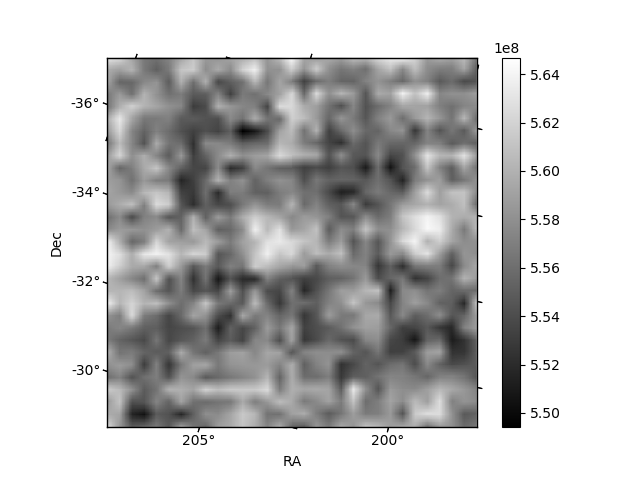
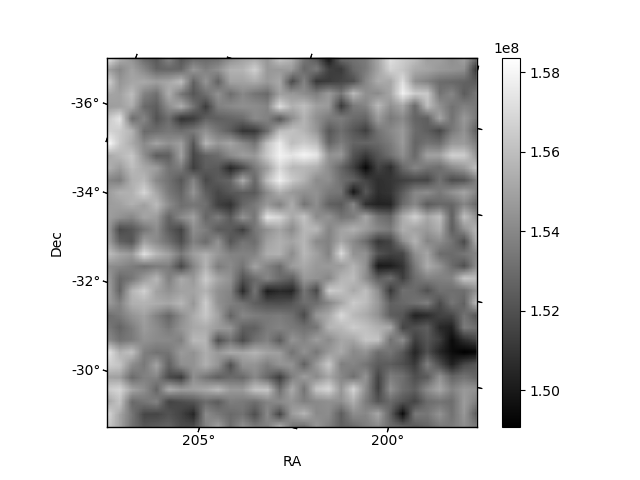
Histogram calculated using DETX and DETY for each event in the final _common_clean file
| Quadrant A | 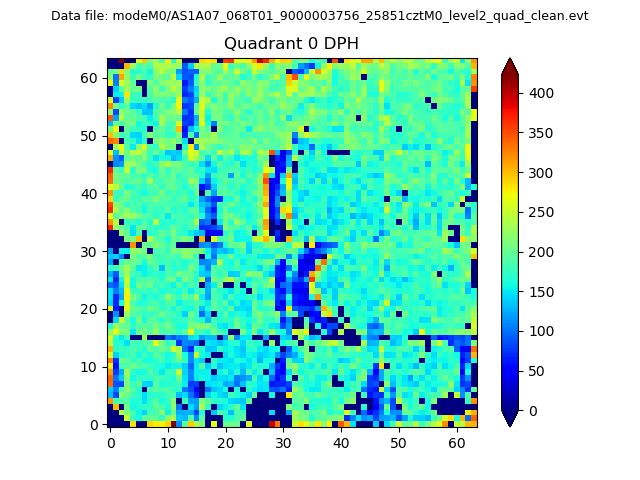 |
 |
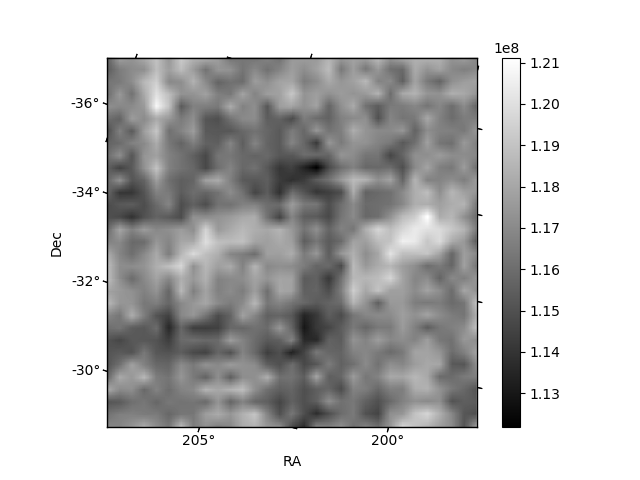
Quadrant B |
|---|---|---|---|
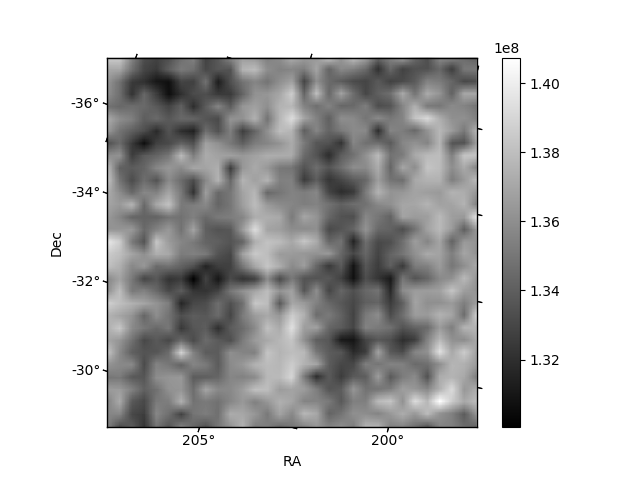
| Quadrant D | 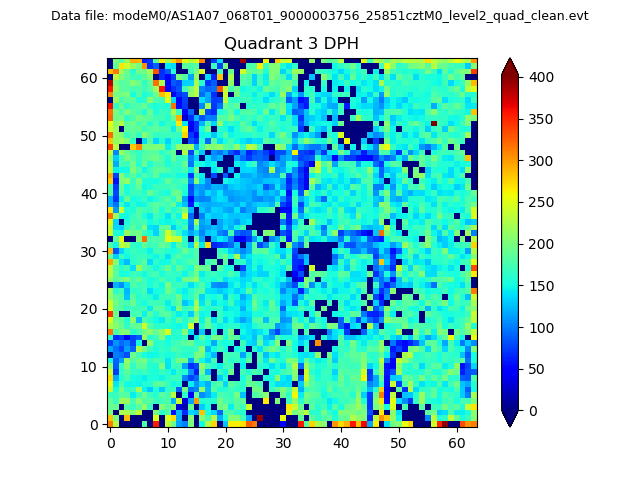 |
 |
Quadrant C |
| Plot type | Count rate plots | Images |
|---|---|---|
| Comparison with Poisson distribution Blue bars denote a histogram of data divided into 1 sec bins. Red curve is a Poisson curve with rate = median count rate of data. |
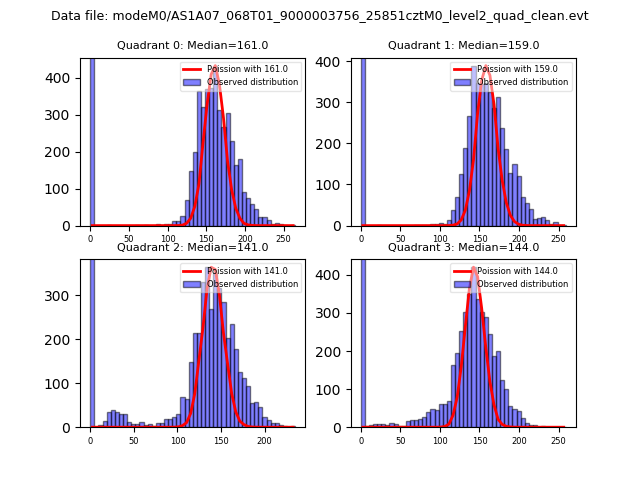 |
 |
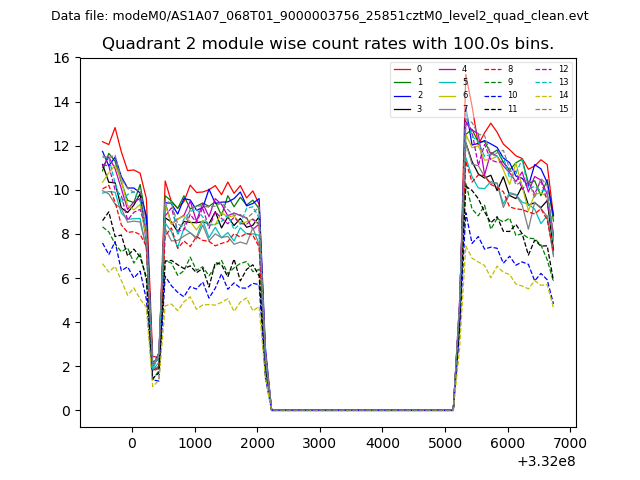
| Quadrant-wise count rates Data is divided into 100 sec bins |
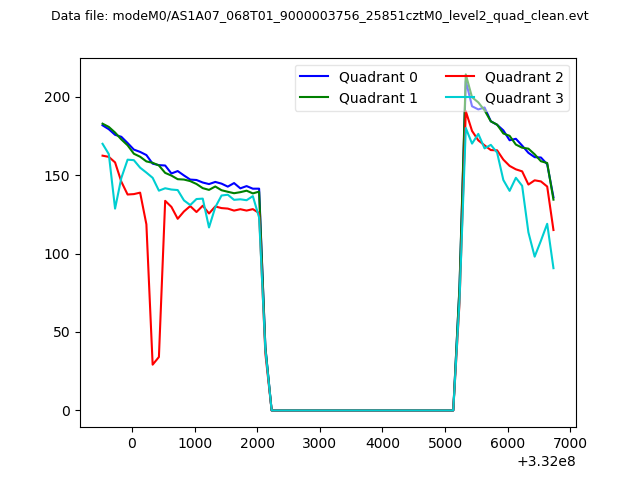 |
|
| Module-wise count rates for Quadrant A Data is divided into 100 sec bins |
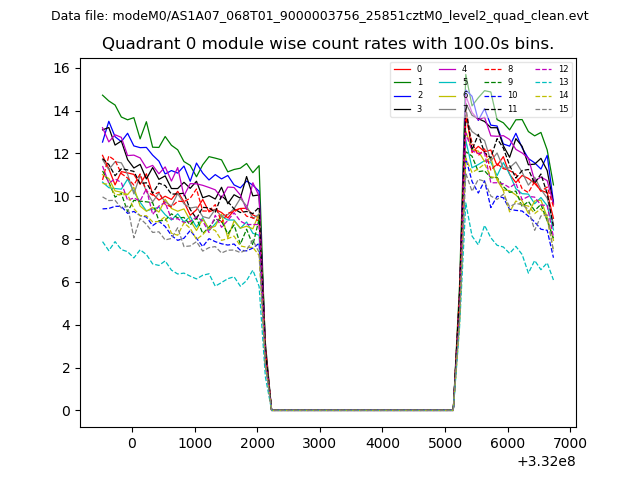 |
 |
| Module-wise count rates for Quadrant B Data is divided into 100 sec bins |
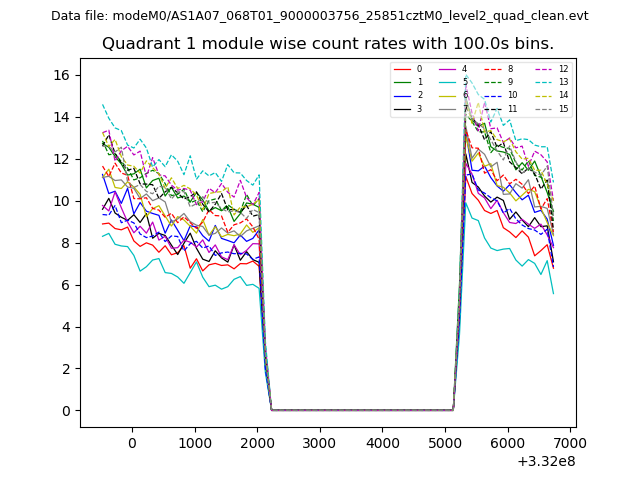 |
 |
| Module-wise count rates for Quadrant C Data is divided into 100 sec bins |
 |
 |
| Module-wise count rates for Quadrant D Data is divided into 100 sec bins |
 |
 |
| Parameter | Plot |
|---|---|
| CZT HV Monitor | 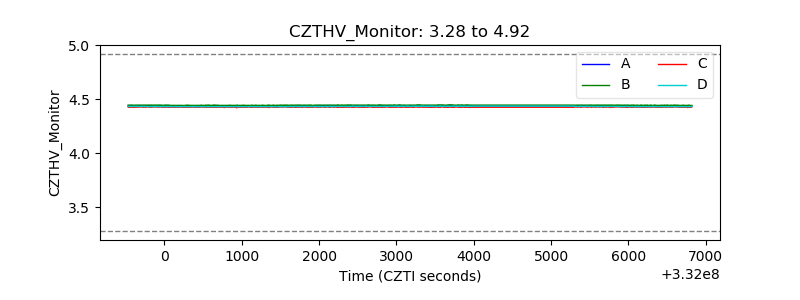 |
| D_VDD | 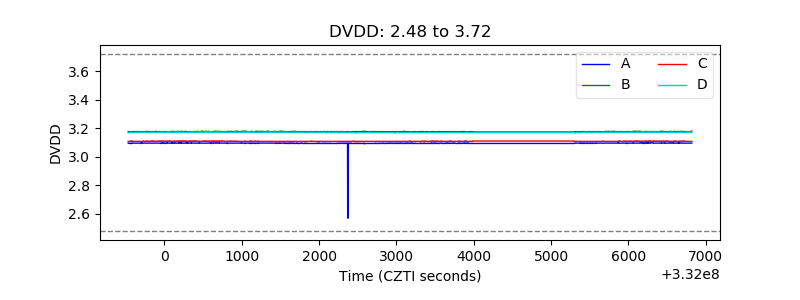 |
| Temperature 1 | 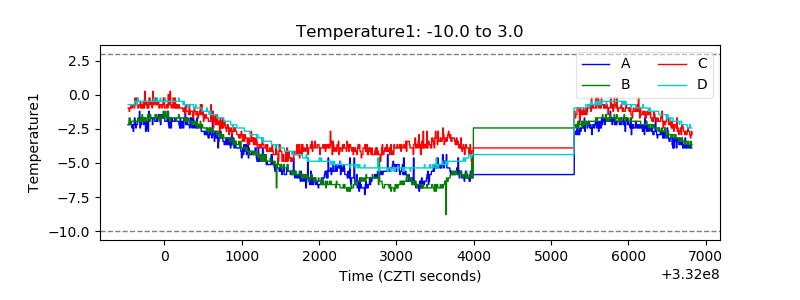 |
| Veto HV Monitor | 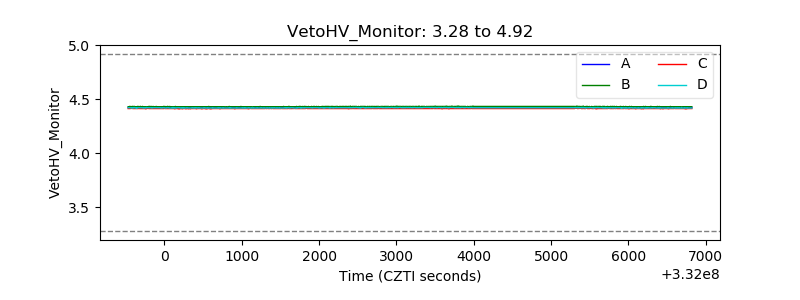 |
| Veto LLD | 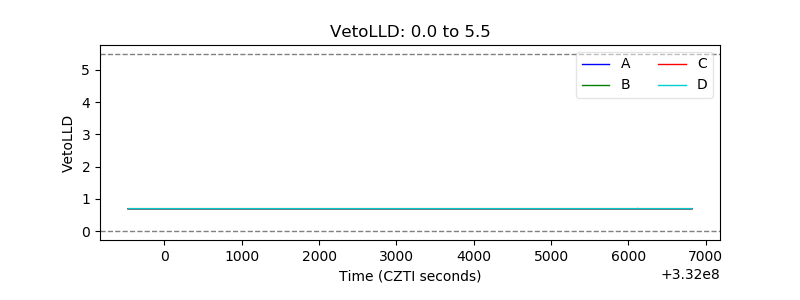 |
| Alpha Counter | 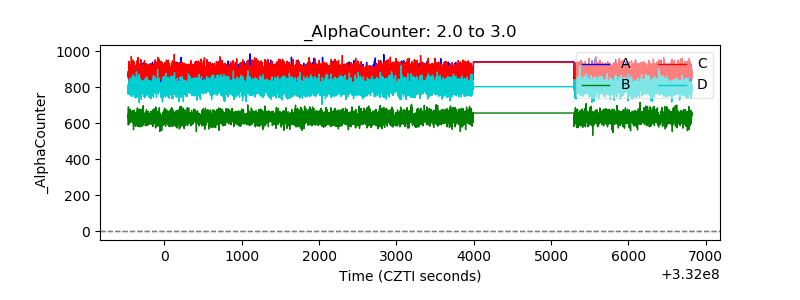 |
| _CPM_Rate | 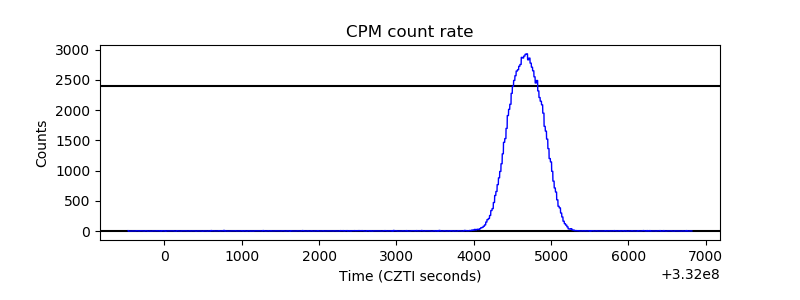 |
| CZT Counter | 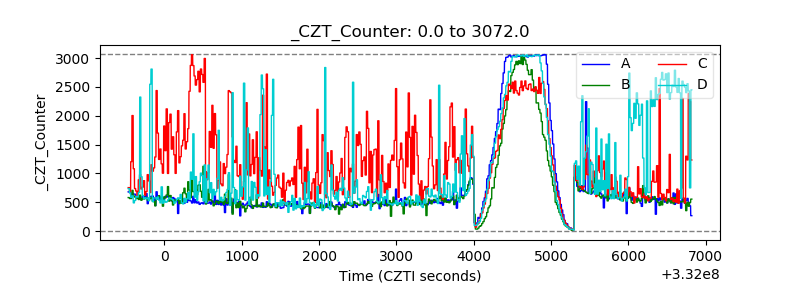 |
| +2.5 Volts monitor | 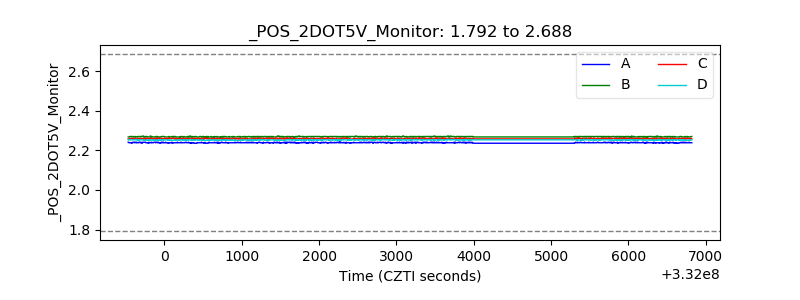 |
| +5 Volts monitor |  |
| _ROLL_ROT | 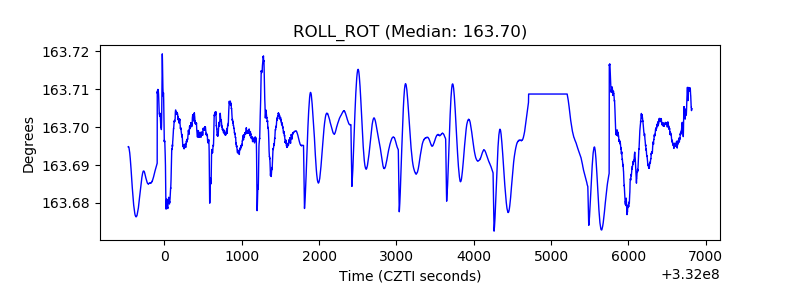 |
| _Roll_DEC | 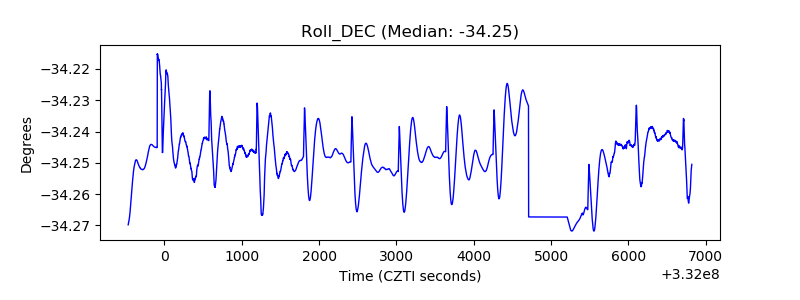 |
| _Roll_RA | 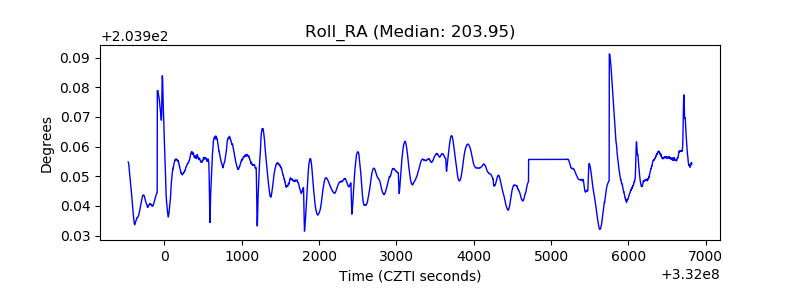 |
| Veto Counter | 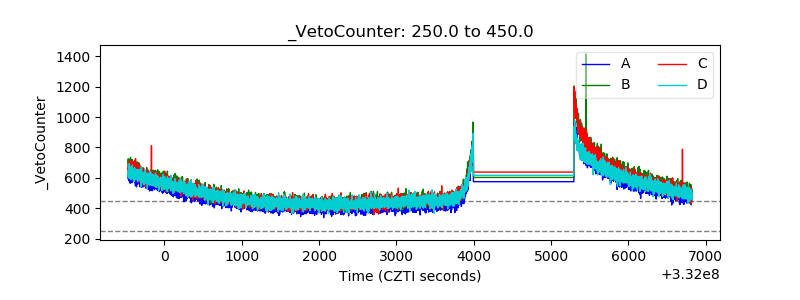 |