| Param | Original file | Final file |
|---|---|---|
| Filename | modeM0/AS1A07_068T01_9000003756_25853cztM0_level2.evt | modeM0/AS1A07_068T01_9000003756_25853cztM0_level2_quad_clean.evt |
| Size (bytes) | 595,186,560 | 94,671,360 |
| Size | 567.6 MB | 90.3 MB |
| Events in quadrant A | 3,527,624 | 637,722 |
| Events in quadrant B | 3,223,982 | 645,016 |
| Events in quadrant C | 6,715,447 | 567,878 |
| Events in quadrant D | 4,136,678 | 581,212 |
| Mode M0 | |||
|---|---|---|---|
| Quadrant | BADHDUFLAG | Total packets | Discarded packets |
| A | 0 | 14453 | 0 |
| B | 0 | 13371 | 0 |
| C | 0 | 24423 | 0 |
| D | 0 | 16411 | 0 |
| Mode M9 | |||
|---|---|---|---|
| Quadrant | BADHDUFLAG | Total packets | Discarded packets |
| A | 0 | 14 | 0 |
| B | 0 | 14 | 0 |
| C | 0 | 14 | 0 |
| D | 0 | 14 | 0 |
| Quadrant | Total seconds | Saturated seconds | Saturation percentage |
|---|---|---|---|
| A | 6236 | 101 | 1.619628% |
| B | 6236 | 54 | 0.865940% |
| C | 6236 | 624 | 10.006414% |
| D | 6236 | 311 | 4.987171% |
Noise dominated data is calculated using 1-second bins in cleaned event files. If a bin has >2000 counts, and if more than 50% of those come from <1% of pixels, then it is considered to be noise-dominated and hence unusable.
| Quadrant | # 1 sec bins | Bins with >0 counts | Bins with >2000 counts | High rate bins dominated by noise | Noise dominated (total time) | Noise dominated (detector-on time) | Marked lightcurve |
|---|---|---|---|---|---|---|---|
| A | 7561 | 6238 | 48 | 48 | 0.63% | 0.77% | 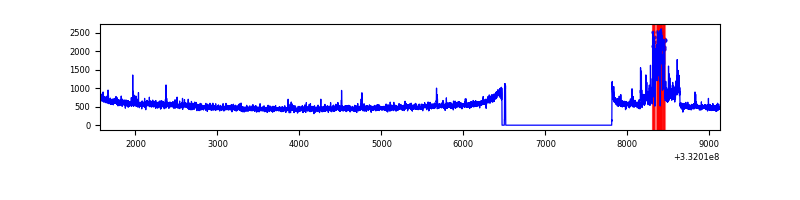 |
| B | 7561 | 6238 | 0 | 0 | 0.00% | 0.00% | 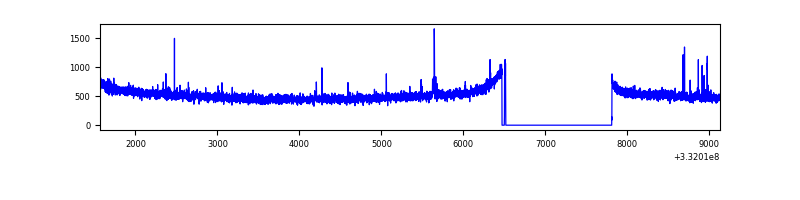 |
| C | 7561 | 6238 | 312 | 312 | 4.13% | 5.00% | 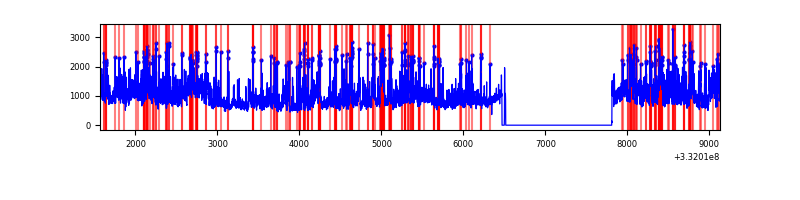 |
| D | 7561 | 6238 | 200 | 200 | 2.65% | 3.21% | 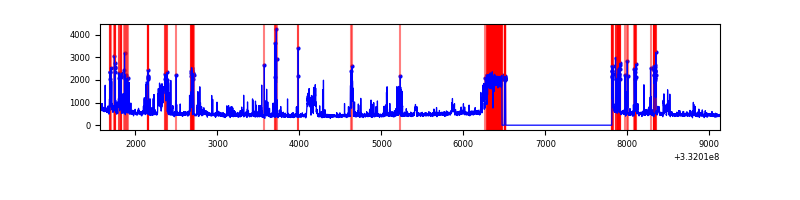 |
Top three noisy pixels from each quadrant. If the there are fewer than three noisy pixels in the level2.evt file, extra rows are filled as -1
| Pixel properties | Quadrant properties | ||||||
|---|---|---|---|---|---|---|---|
| Quadrant | DetID | PixID | Counts | Sigma | Mean | Median | Sigma |
| A | 0 | 13 | 368298 | 2242.27 | 819 | 805 | 163.9 |
| A | 13 | 254 | 9562 | 53.43 | 819 | 805 | 163.9 |
| A | 3 | 137 | 7313 | 39.71 | 819 | 805 | 163.9 |
| B | 12 | 111 | 18310 | 113.28 | 811 | 792 | 154.6 |
| B | 11 | 111 | 16256 | 100.0 | 811 | 792 | 154.6 |
| B | 6 | 36 | 15824 | 97.21 | 811 | 792 | 154.6 |
| C | 7 | 87 | 3640334 | 21105.47 | 746 | 751 | 172.4 |
| C | 14 | 238 | 121282 | 698.94 | 746 | 751 | 172.4 |
| C | 3 | 233 | 31631 | 179.07 | 746 | 751 | 172.4 |
| D | 1 | 52 | 1172679 | 6460.23 | 762 | 746 | 181.4 |
| D | 12 | 233 | 36307 | 196.03 | 762 | 746 | 181.4 |
| D | 2 | 234 | 23596 | 125.96 | 762 | 746 | 181.4 |
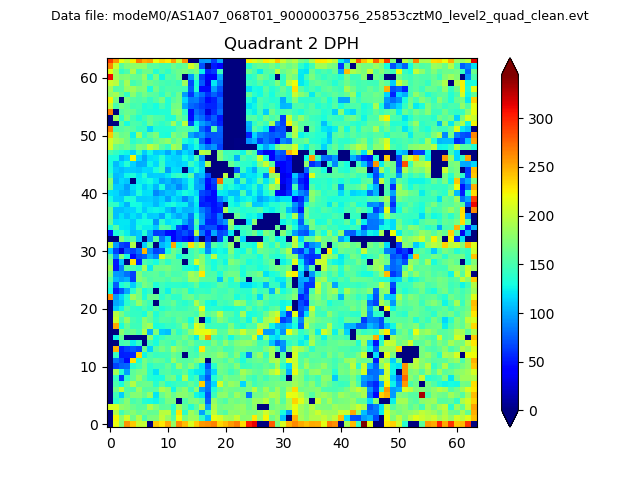
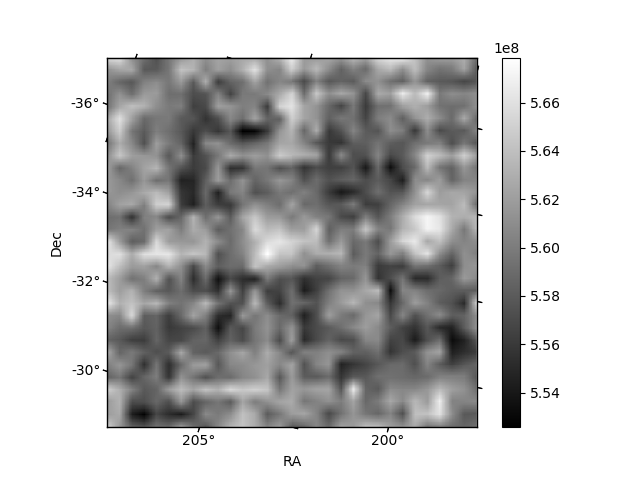
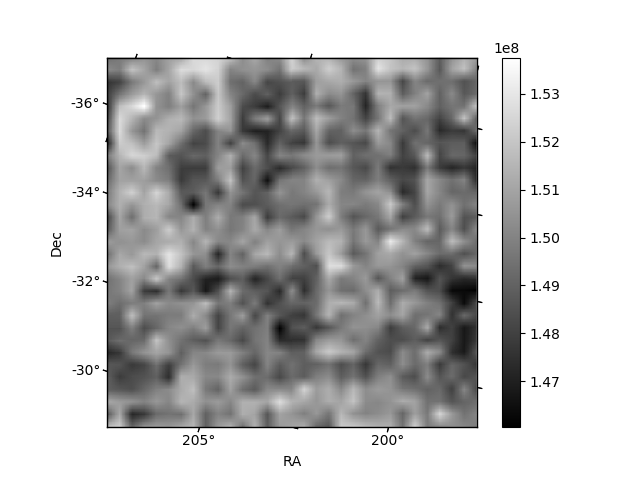
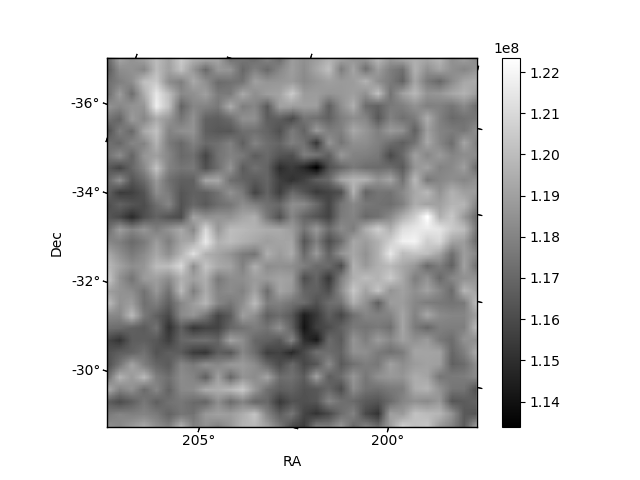
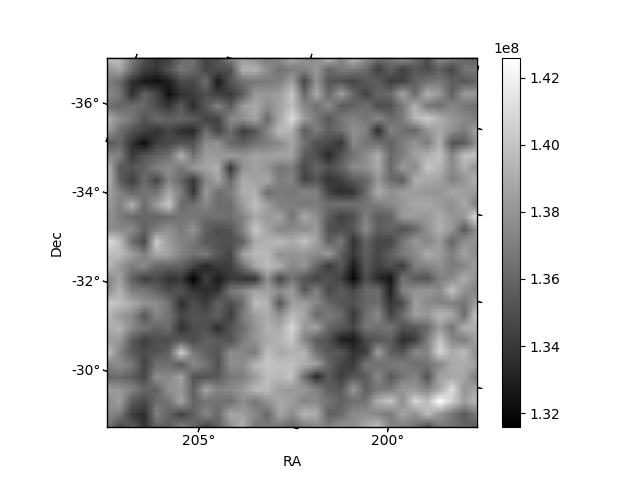
Histogram calculated using DETX and DETY for each event in the final _common_clean file
| Quadrant A | 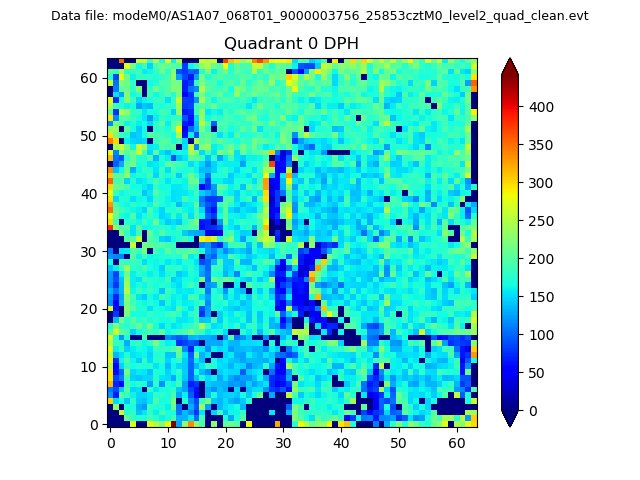 |
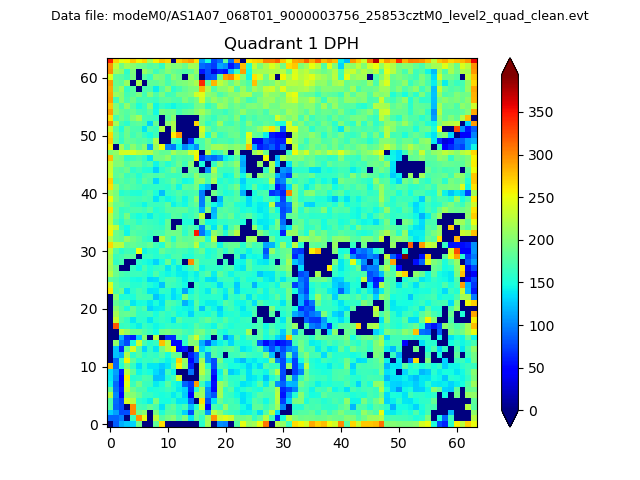 |
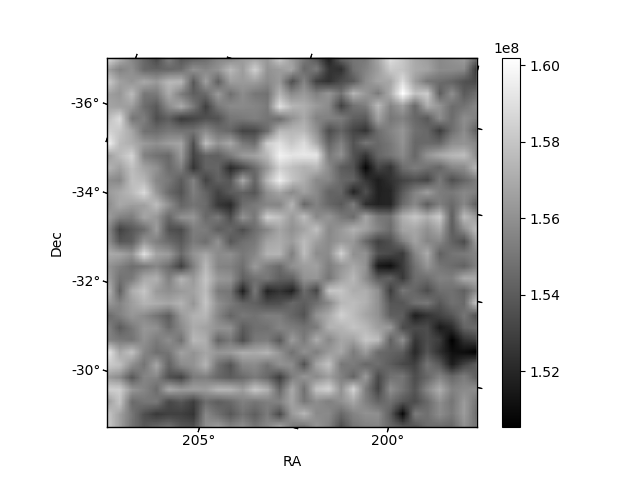
Quadrant B |
|---|---|---|---|
| Quadrant D | 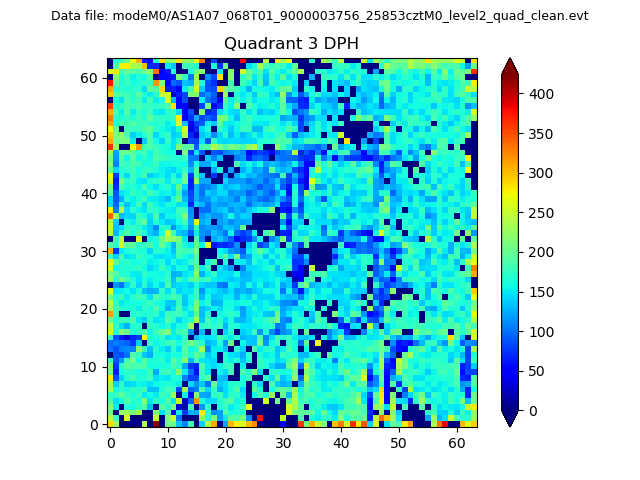 |
 |
Quadrant C |
| Plot type | Count rate plots | Images |
|---|---|---|
| Comparison with Poisson distribution Blue bars denote a histogram of data divided into 1 sec bins. Red curve is a Poisson curve with rate = median count rate of data. |
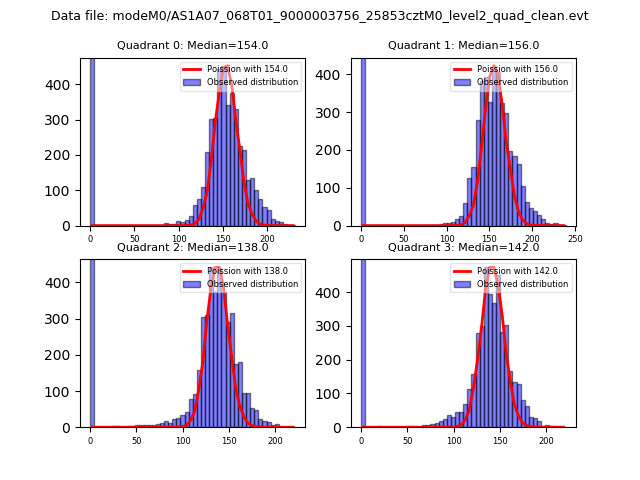 |
 |
| Quadrant-wise count rates Data is divided into 100 sec bins |
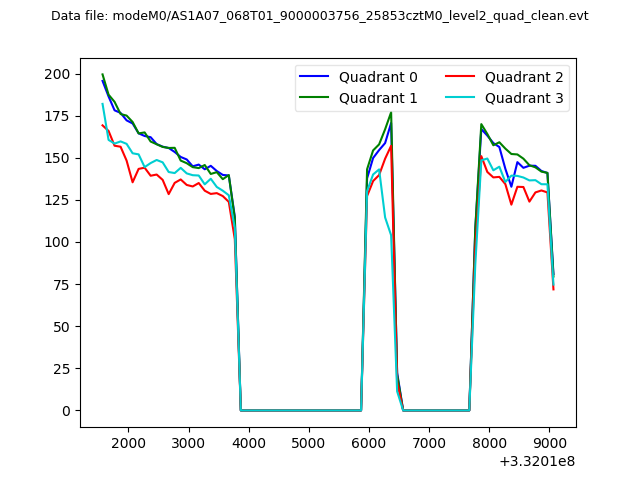 |
|
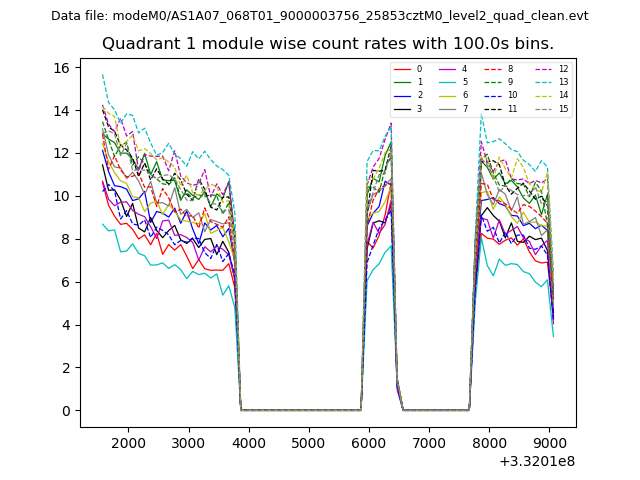
| Module-wise count rates for Quadrant A Data is divided into 100 sec bins |
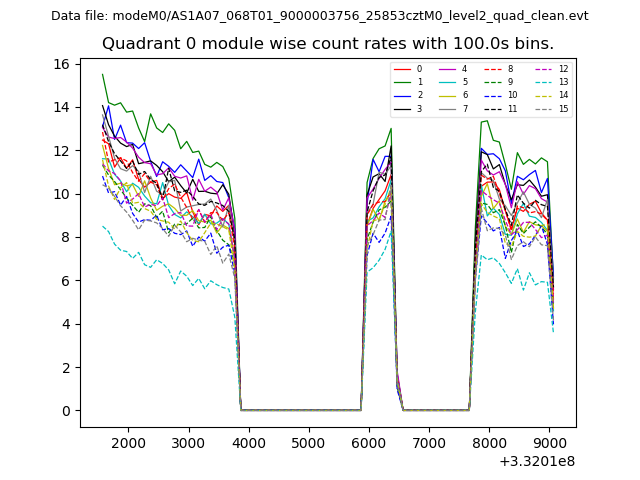 |
 |
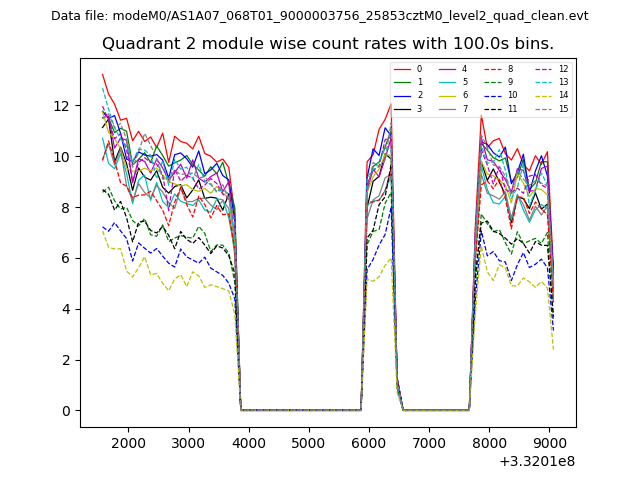
| Module-wise count rates for Quadrant B Data is divided into 100 sec bins |
 |
 |
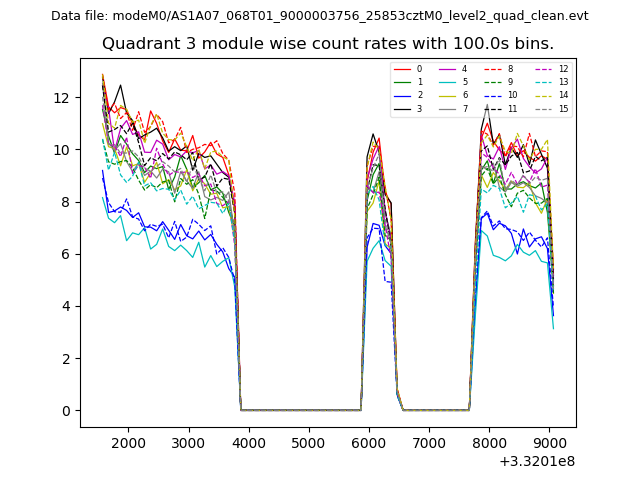
| Module-wise count rates for Quadrant C Data is divided into 100 sec bins |
 |
 |
| Module-wise count rates for Quadrant D Data is divided into 100 sec bins |
 |
 |
| Parameter | Plot |
|---|---|
| CZT HV Monitor | 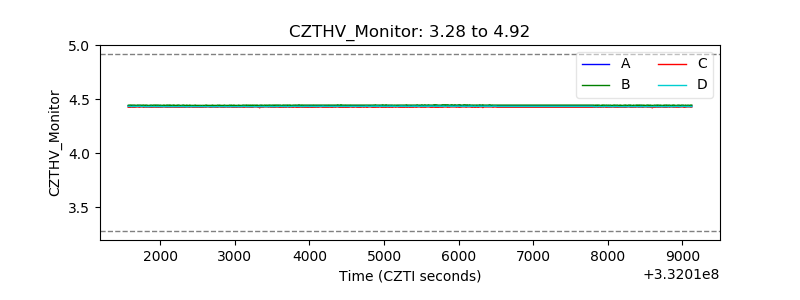 |
| D_VDD | 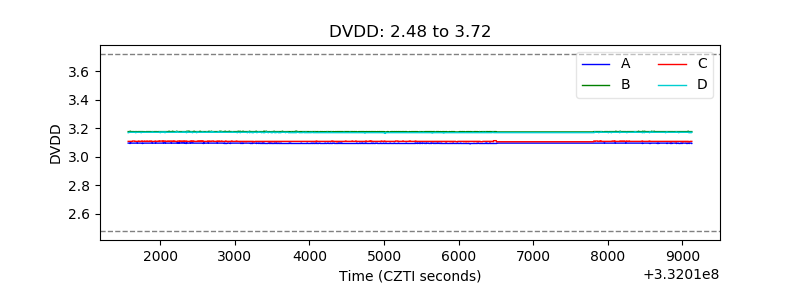 |
| Temperature 1 | 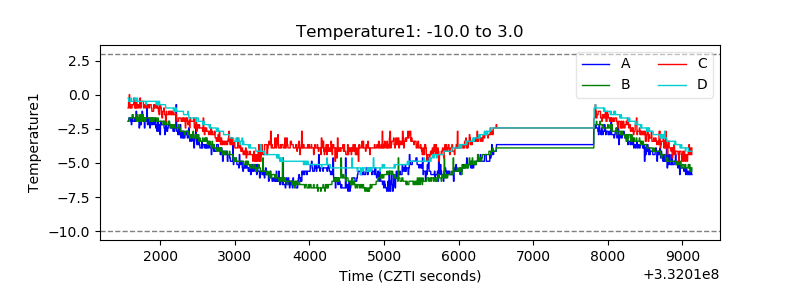 |
| Veto HV Monitor | 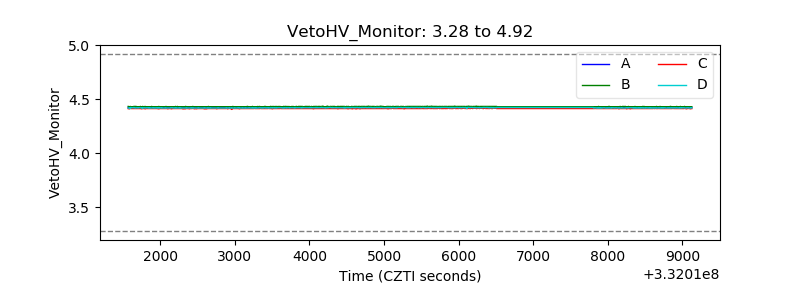 |
| Veto LLD | 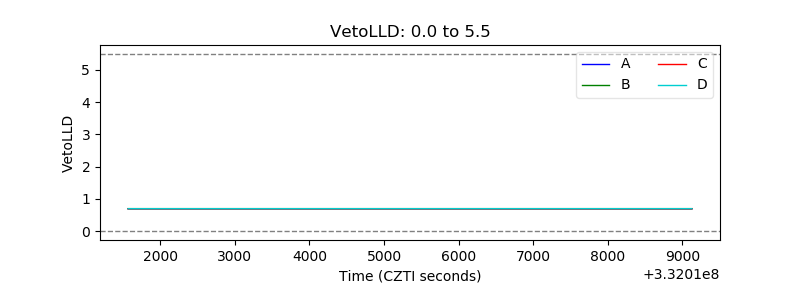 |
| Alpha Counter | 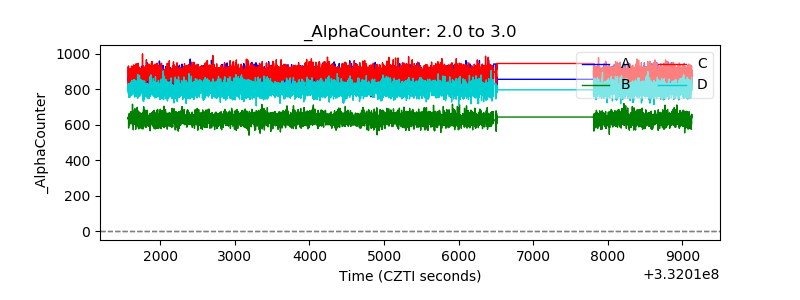 |
| _CPM_Rate | 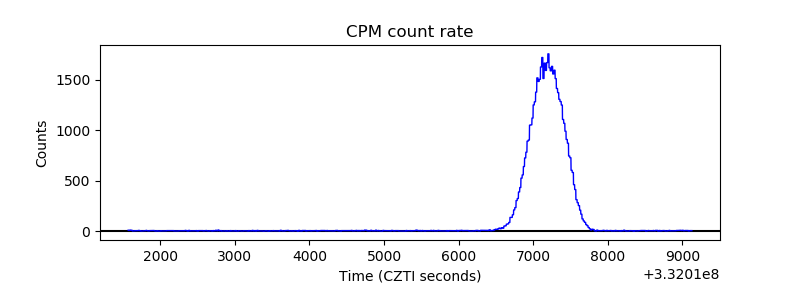 |
| CZT Counter | 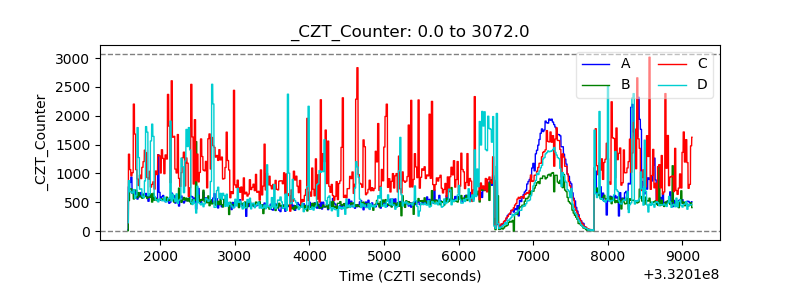 |
| +2.5 Volts monitor |  |
| +5 Volts monitor |  |
| _ROLL_ROT | 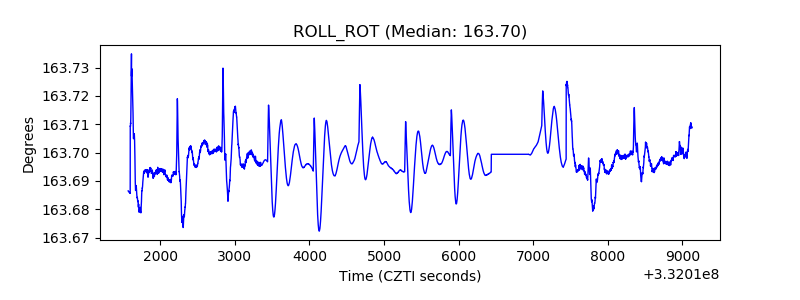 |
| _Roll_DEC | 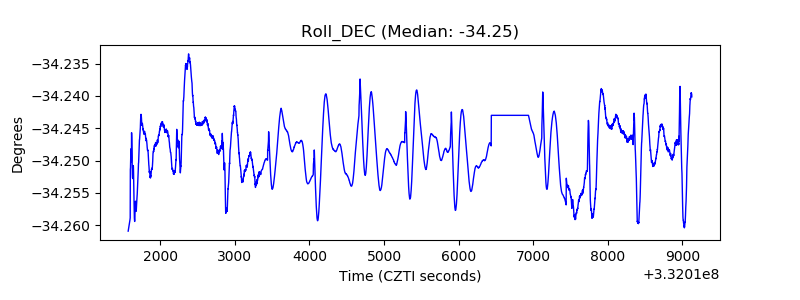 |
| _Roll_RA | 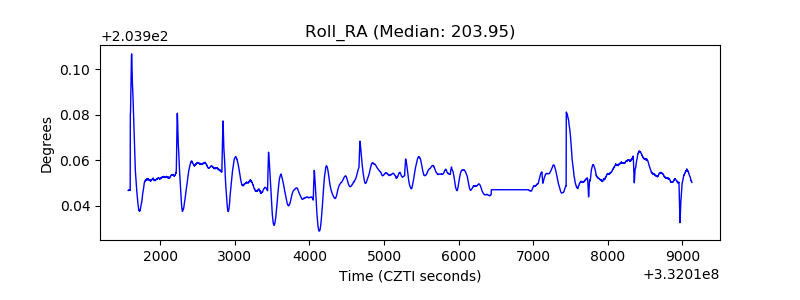 |
| Veto Counter | 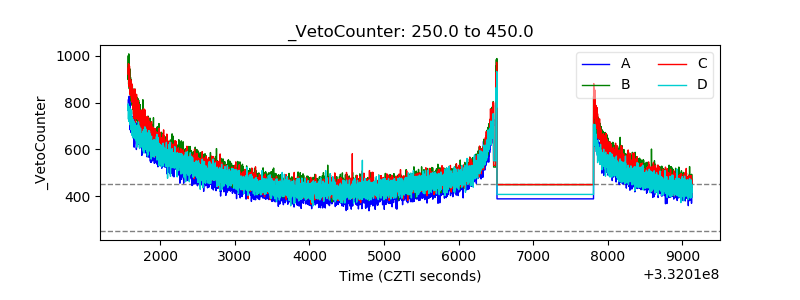 |