| Param | Original file | Final file |
|---|---|---|
| Filename | modeM0/AS1A07_068T01_9000003756_25854cztM0_level2.evt | modeM0/AS1A07_068T01_9000003756_25854cztM0_level2_quad_clean.evt |
| Size (bytes) | 644,345,280 | 94,524,480 |
| Size | 614.5 MB | 90.1 MB |
| Events in quadrant A | 3,987,593 | 628,538 |
| Events in quadrant B | 3,227,682 | 638,302 |
| Events in quadrant C | 6,740,609 | 574,939 |
| Events in quadrant D | 5,118,940 | 567,198 |
| Mode M0 | |||
|---|---|---|---|
| Quadrant | BADHDUFLAG | Total packets | Discarded packets |
| A | 0 | 16068 | 0 |
| B | 0 | 13653 | 0 |
| C | 0 | 24596 | 0 |
| D | 0 | 19642 | 0 |
| Mode M9 | |||
|---|---|---|---|
| Quadrant | BADHDUFLAG | Total packets | Discarded packets |
| A | 0 | 19 | 0 |
| B | 0 | 20 | 0 |
| C | 0 | 20 | 0 |
| D | 0 | 20 | 0 |
| Quadrant | Total seconds | Saturated seconds | Saturation percentage |
|---|---|---|---|
| A | 6499 | 135 | 2.077243% |
| B | 6499 | 40 | 0.615479% |
| C | 6499 | 604 | 9.293737% |
| D | 6499 | 587 | 9.032159% |
Noise dominated data is calculated using 1-second bins in cleaned event files. If a bin has >2000 counts, and if more than 50% of those come from <1% of pixels, then it is considered to be noise-dominated and hence unusable.
| Quadrant | # 1 sec bins | Bins with >0 counts | Bins with >2000 counts | High rate bins dominated by noise | Noise dominated (total time) | Noise dominated (detector-on time) | Marked lightcurve |
|---|---|---|---|---|---|---|---|
| A | 7604 | 6500 | 74 | 74 | 0.97% | 1.14% | 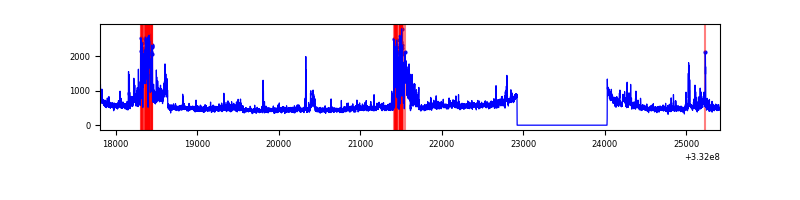 |
| B | 7604 | 6500 | 0 | 0 | 0.00% | 0.00% | 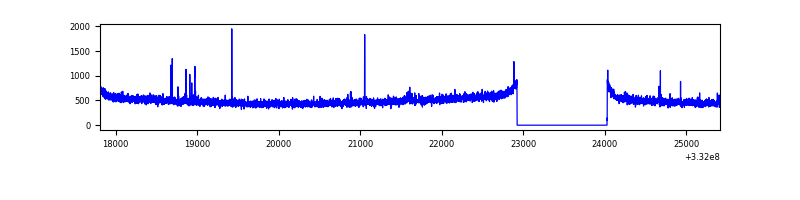 |
| C | 7604 | 6500 | 303 | 303 | 3.98% | 4.66% | 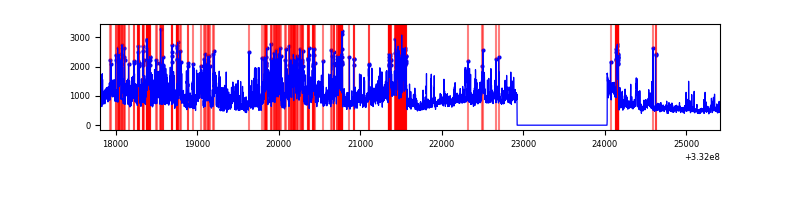 |
| D | 7604 | 6500 | 574 | 574 | 7.55% | 8.83% | 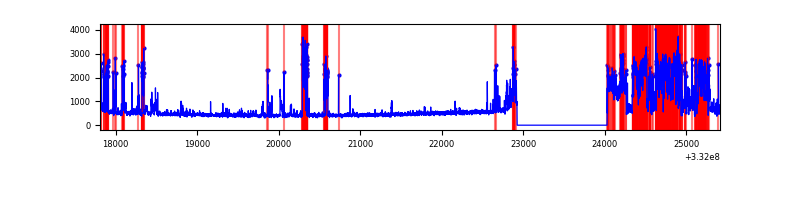 |
Top three noisy pixels from each quadrant. If the there are fewer than three noisy pixels in the level2.evt file, extra rows are filled as -1
| Pixel properties | Quadrant properties | ||||||
|---|---|---|---|---|---|---|---|
| Quadrant | DetID | PixID | Counts | Sigma | Mean | Median | Sigma |
| A | 0 | 13 | 822425 | 5004.0 | 819 | 803 | 164.2 |
| A | 13 | 254 | 9240 | 51.38 | 819 | 803 | 164.2 |
| A | 11 | 29 | 7872 | 43.05 | 819 | 803 | 164.2 |
| B | 12 | 111 | 18823 | 115.95 | 813 | 793 | 155.5 |
| B | 11 | 111 | 16802 | 102.95 | 813 | 793 | 155.5 |
| B | 14 | 111 | 15380 | 93.81 | 813 | 793 | 155.5 |
| C | 7 | 87 | 3628836 | 20642.01 | 753 | 757 | 175.8 |
| C | 14 | 238 | 120235 | 679.77 | 753 | 757 | 175.8 |
| C | 3 | 233 | 38530 | 214.91 | 753 | 757 | 175.8 |
| D | 1 | 52 | 1835772 | 10217.78 | 758 | 740 | 179.6 |
| D | 1 | 3 | 229671 | 1274.73 | 758 | 740 | 179.6 |
| D | 12 | 233 | 151804 | 841.15 | 758 | 740 | 179.6 |
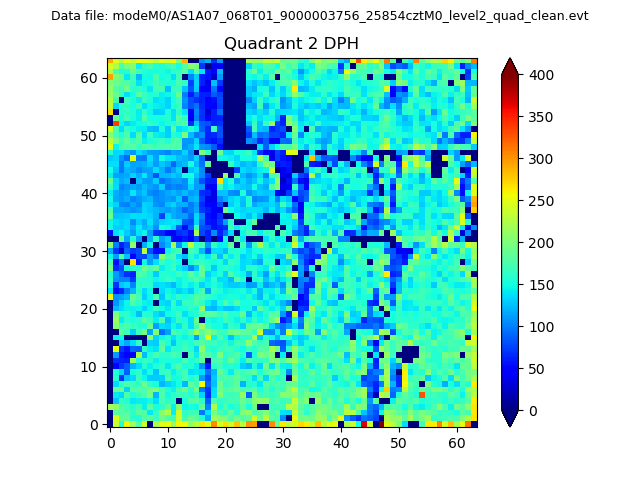
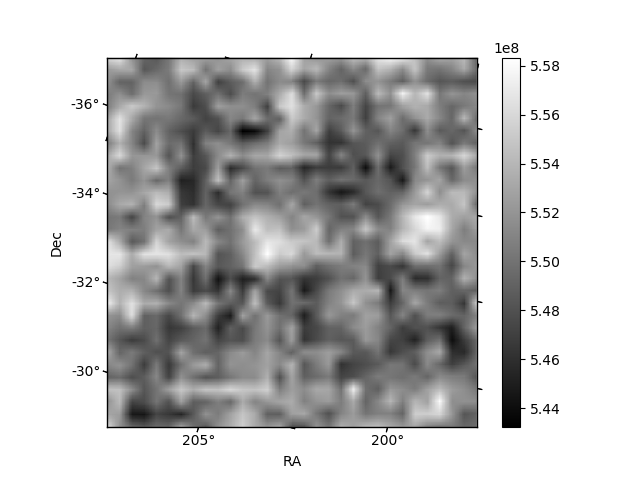
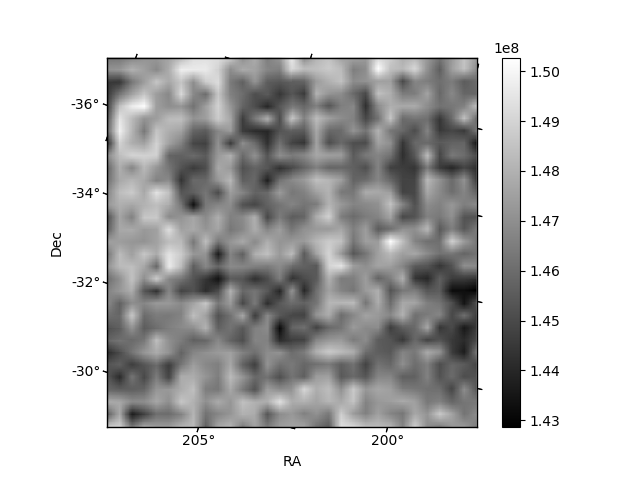
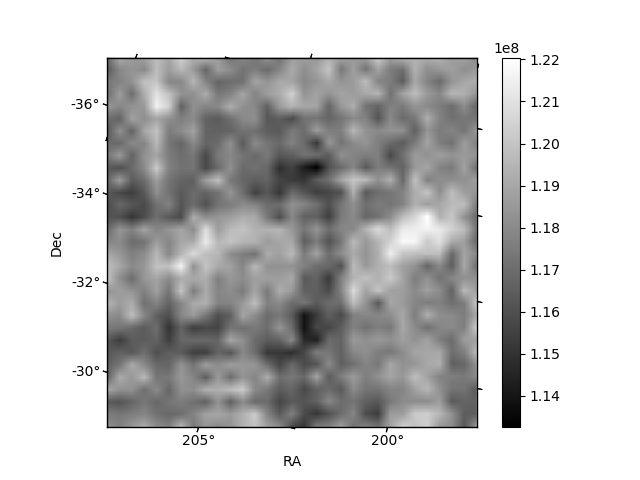
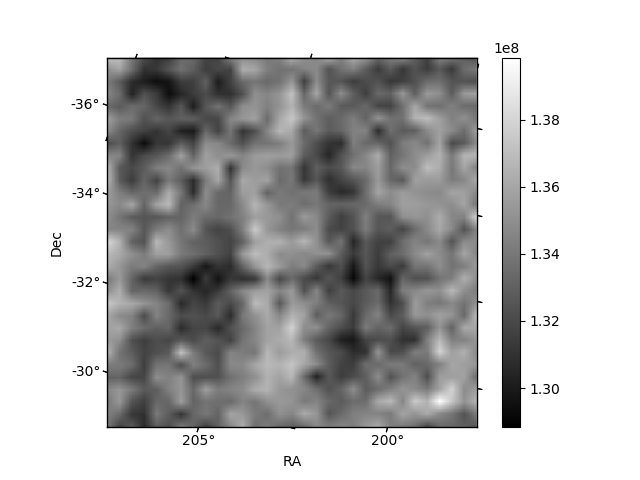
Histogram calculated using DETX and DETY for each event in the final _common_clean file
| Quadrant A | 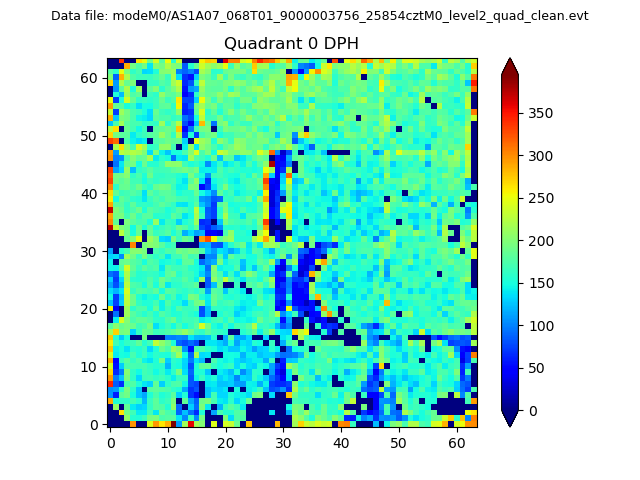 |
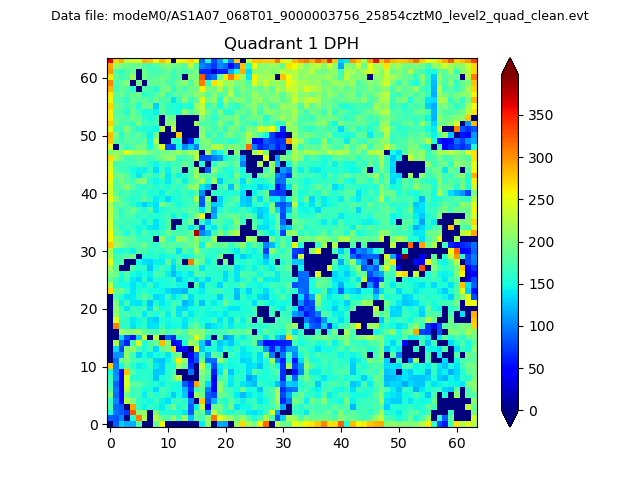 |
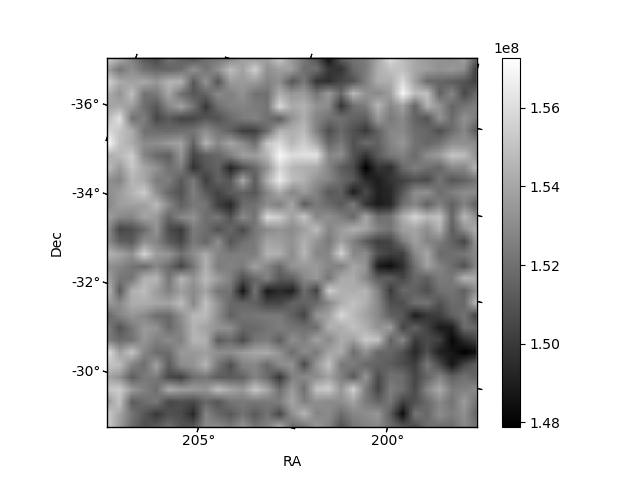
Quadrant B |
|---|---|---|---|
| Quadrant D | 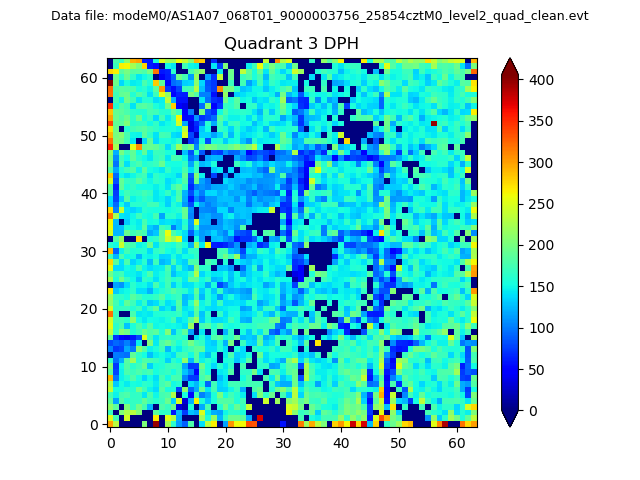 |
 |
Quadrant C |
| Plot type | Count rate plots | Images |
|---|---|---|
| Comparison with Poisson distribution Blue bars denote a histogram of data divided into 1 sec bins. Red curve is a Poisson curve with rate = median count rate of data. |
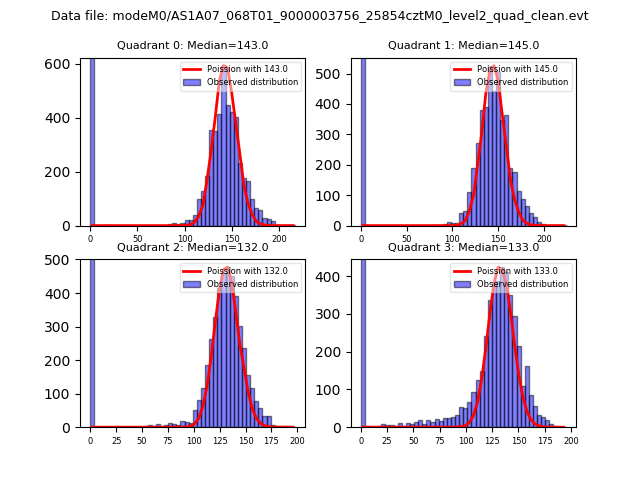 |
 |
| Quadrant-wise count rates Data is divided into 100 sec bins |
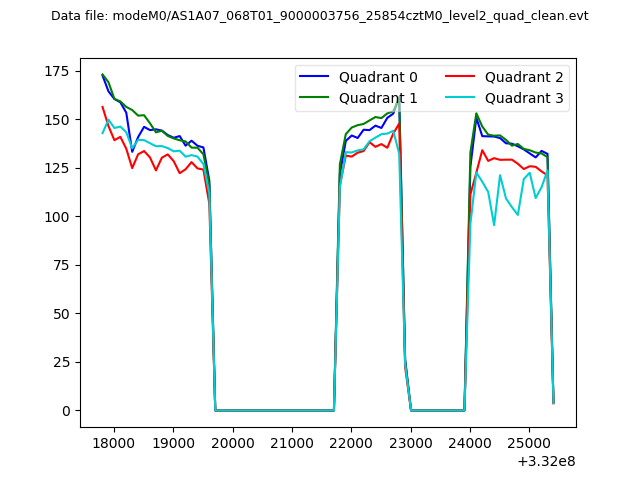 |
|
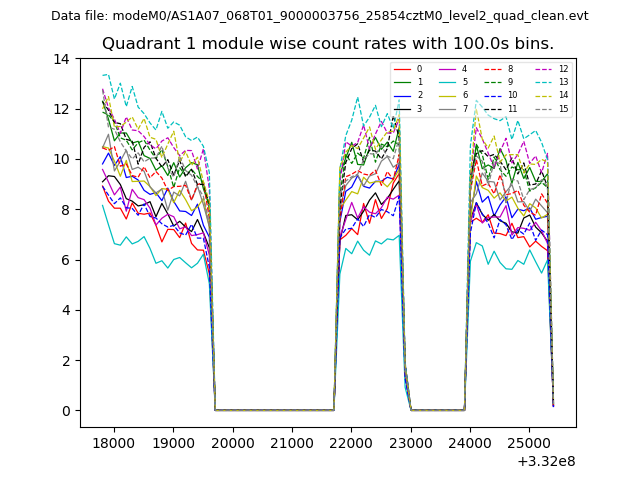
| Module-wise count rates for Quadrant A Data is divided into 100 sec bins |
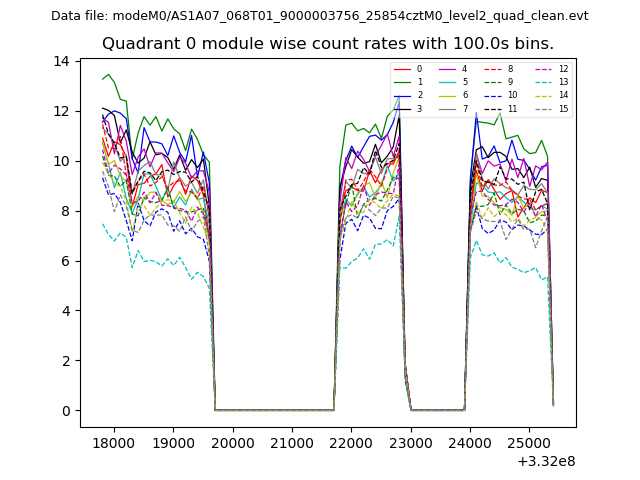 |
 |
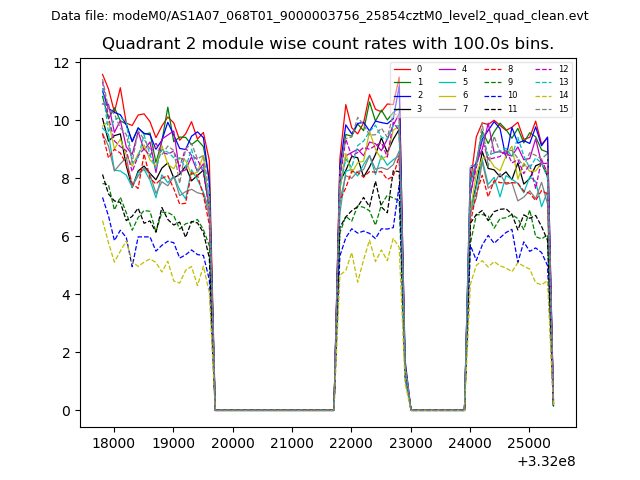
| Module-wise count rates for Quadrant B Data is divided into 100 sec bins |
 |
 |
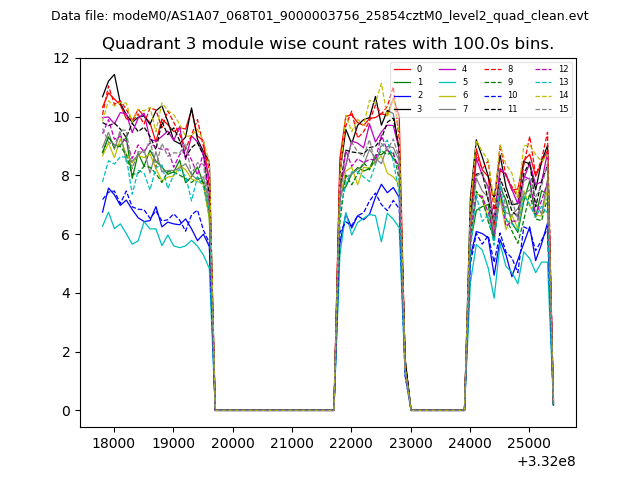
| Module-wise count rates for Quadrant C Data is divided into 100 sec bins |
 |
 |
| Module-wise count rates for Quadrant D Data is divided into 100 sec bins |
 |
 |
| Parameter | Plot |
|---|---|
| CZT HV Monitor | 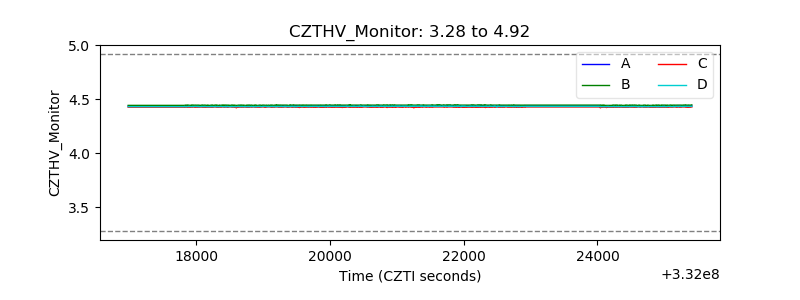 |
| D_VDD | 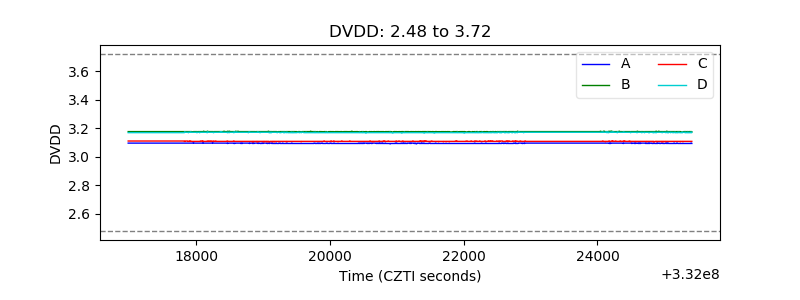 |
| Temperature 1 | 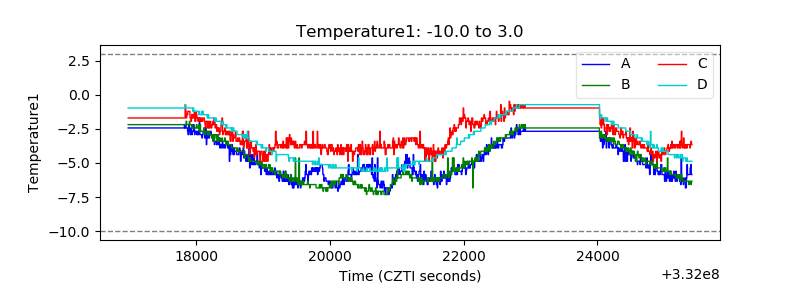 |
| Veto HV Monitor | 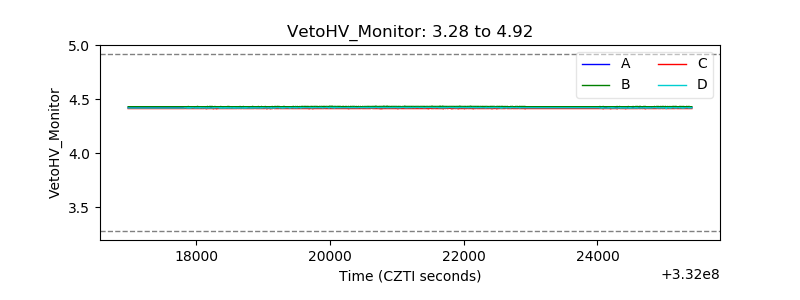 |
| Veto LLD | 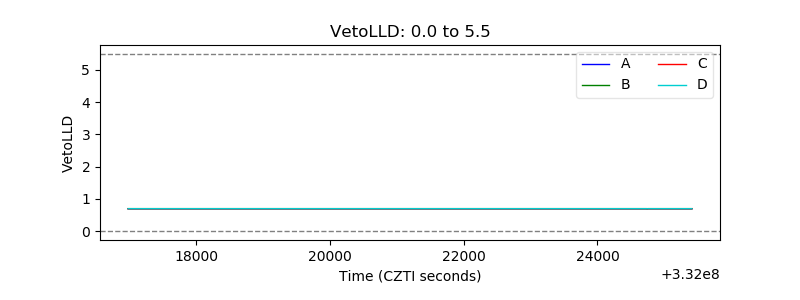 |
| Alpha Counter | 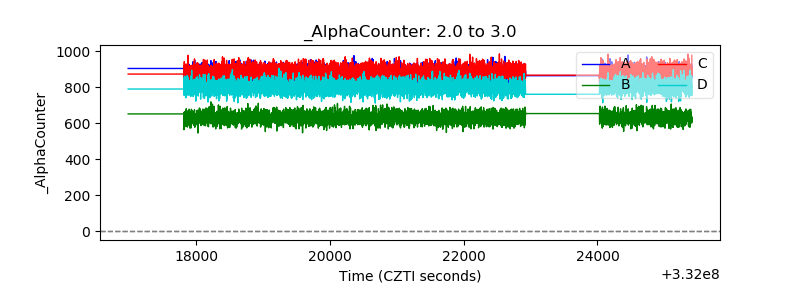 |
| _CPM_Rate |  |
| CZT Counter | 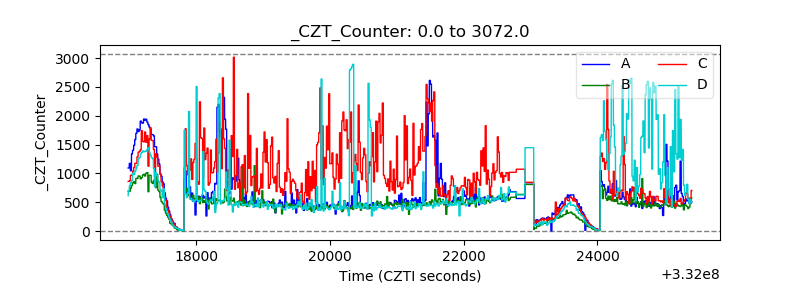 |
| +2.5 Volts monitor | 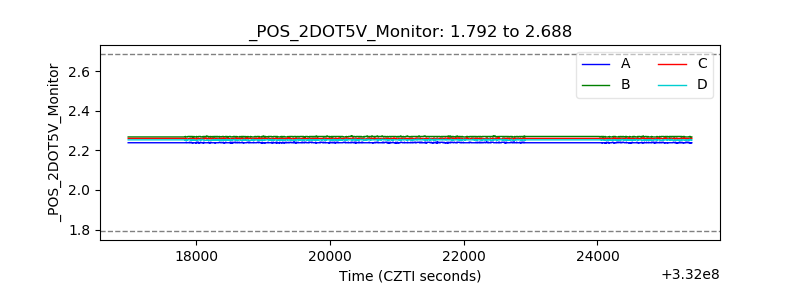 |
| +5 Volts monitor |  |
| _ROLL_ROT | 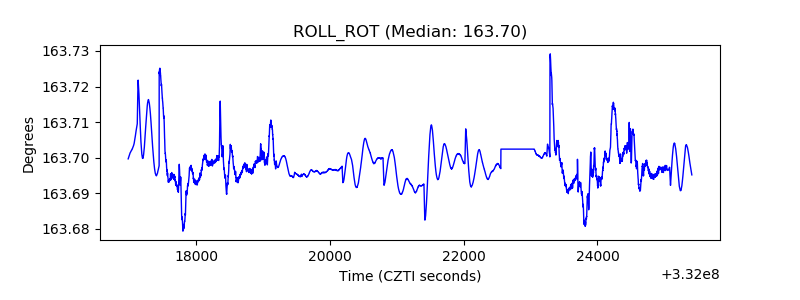 |
| _Roll_DEC | 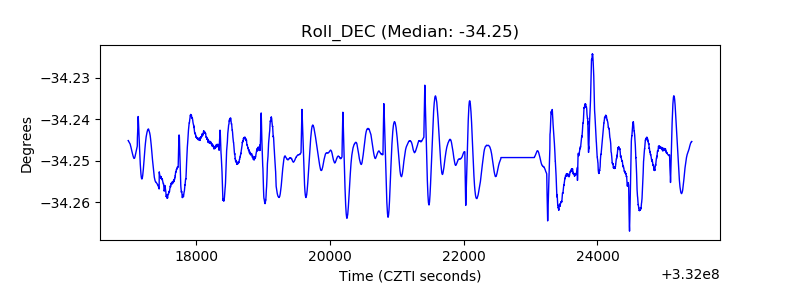 |
| _Roll_RA | 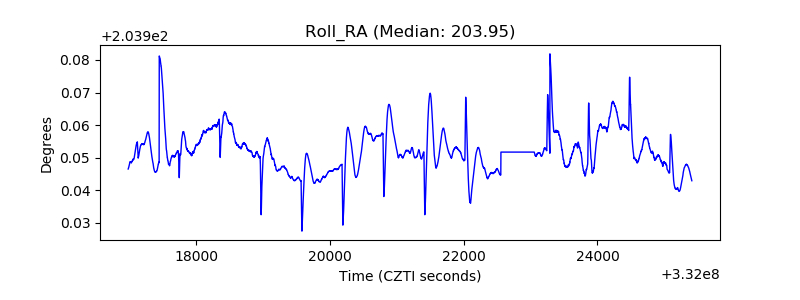 |
| Veto Counter | 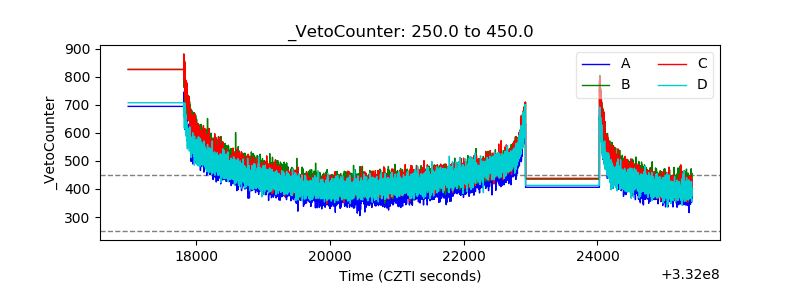 |