| Param | Original file | Final file |
|---|---|---|
| Filename | modeM0/AS1A07_068T01_9000003756_25855cztM0_level2.evt | modeM0/AS1A07_068T01_9000003756_25855cztM0_level2_quad_clean.evt |
| Size (bytes) | 698,425,920 | 92,482,560 |
| Size | 666.1 MB | 88.2 MB |
| Events in quadrant A | 4,077,220 | 613,341 |
| Events in quadrant B | 3,393,150 | 626,375 |
| Events in quadrant C | 8,000,237 | 514,809 |
| Events in quadrant D | 5,212,075 | 561,851 |
| Mode M0 | |||
|---|---|---|---|
| Quadrant | BADHDUFLAG | Total packets | Discarded packets |
| A | 0 | 16416 | 0 |
| B | 0 | 14450 | 0 |
| C | 0 | 28548 | 0 |
| D | 0 | 20177 | 0 |
| Mode M9 | |||
|---|---|---|---|
| Quadrant | BADHDUFLAG | Total packets | Discarded packets |
| A | 0 | 16 | 0 |
| B | 0 | 17 | 0 |
| C | 0 | 17 | 0 |
| D | 0 | 17 | 0 |
| Quadrant | Total seconds | Saturated seconds | Saturation percentage |
|---|---|---|---|
| A | 6936 | 142 | 2.047290% |
| B | 6937 | 61 | 0.879343% |
| C | 6936 | 1453 | 20.948674% |
| D | 6937 | 471 | 6.789679% |
Noise dominated data is calculated using 1-second bins in cleaned event files. If a bin has >2000 counts, and if more than 50% of those come from <1% of pixels, then it is considered to be noise-dominated and hence unusable.
| Quadrant | # 1 sec bins | Bins with >0 counts | Bins with >2000 counts | High rate bins dominated by noise | Noise dominated (total time) | Noise dominated (detector-on time) | Marked lightcurve |
|---|---|---|---|---|---|---|---|
| A | 7673 | 6939 | 85 | 85 | 1.11% | 1.22% | 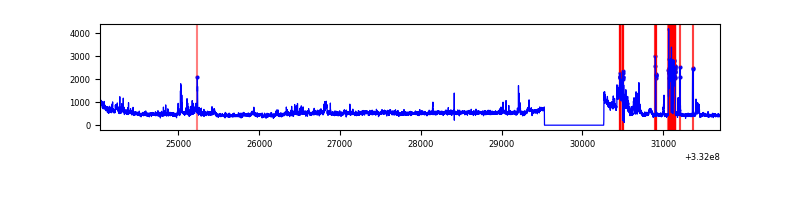 |
| B | 7673 | 6939 | 0 | 0 | 0.00% | 0.00% | 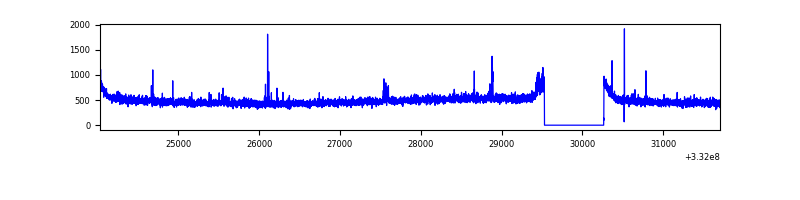 |
| C | 7673 | 6938 | 954 | 954 | 12.43% | 13.75% | 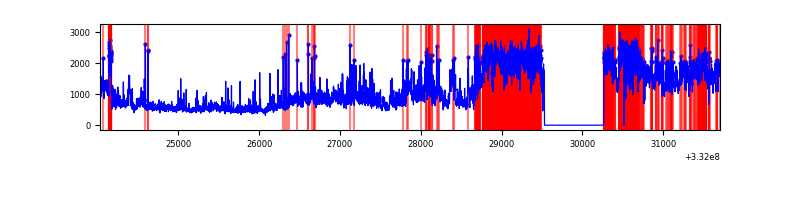 |
| D | 7673 | 6939 | 477 | 477 | 6.22% | 6.87% | 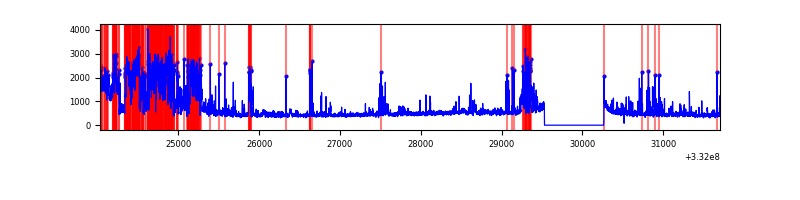 |
Top three noisy pixels from each quadrant. If the there are fewer than three noisy pixels in the level2.evt file, extra rows are filled as -1
| Pixel properties | Quadrant properties | ||||||
|---|---|---|---|---|---|---|---|
| Quadrant | DetID | PixID | Counts | Sigma | Mean | Median | Sigma |
| A | 0 | 13 | 801815 | 4684.85 | 849 | 834 | 171.0 |
| A | 13 | 254 | 10021 | 53.73 | 849 | 834 | 171.0 |
| A | 3 | 137 | 7889 | 41.26 | 849 | 834 | 171.0 |
| B | 15 | 33 | 20900 | 124.31 | 846 | 827 | 161.5 |
| B | 12 | 111 | 20227 | 120.14 | 846 | 827 | 161.5 |
| B | 11 | 111 | 17828 | 105.28 | 846 | 827 | 161.5 |
| C | 7 | 87 | 4915596 | 28003.88 | 750 | 755 | 175.5 |
| C | 14 | 238 | 119678 | 677.6 | 750 | 755 | 175.5 |
| C | 3 | 233 | 19606 | 107.41 | 750 | 755 | 175.5 |
| D | 1 | 52 | 1972092 | 10397.46 | 797 | 777 | 189.6 |
| D | 12 | 233 | 171215 | 898.95 | 797 | 777 | 189.6 |
| D | 2 | 234 | 27416 | 140.5 | 797 | 777 | 189.6 |
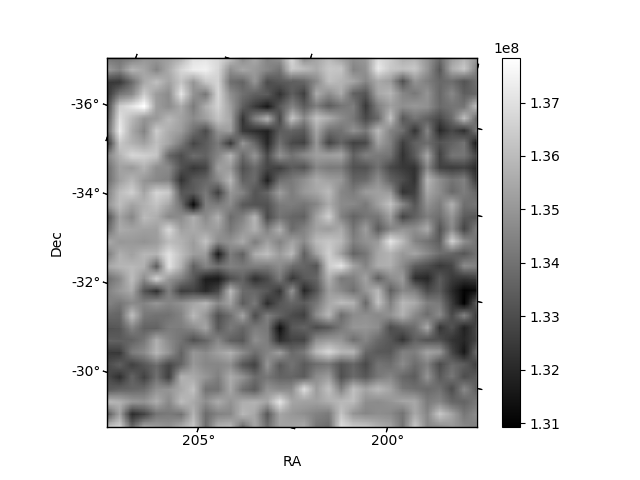
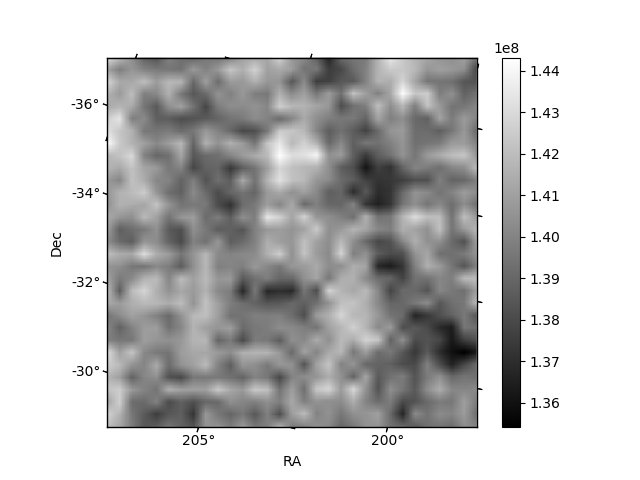
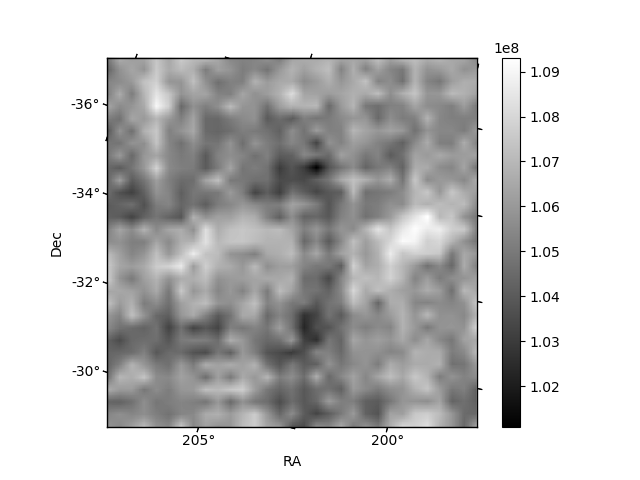
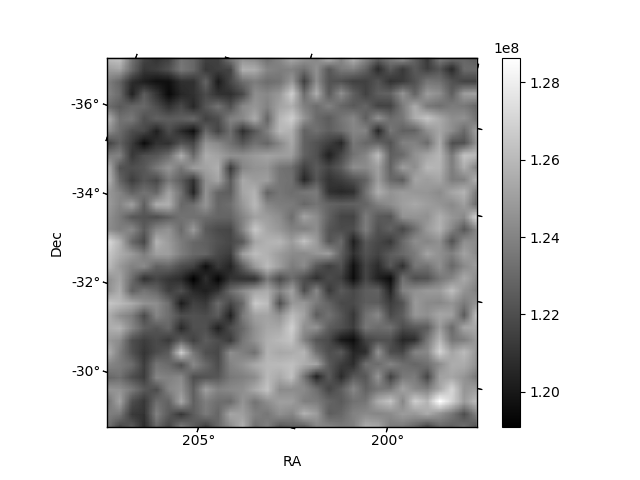
Histogram calculated using DETX and DETY for each event in the final _common_clean file
| Quadrant A | 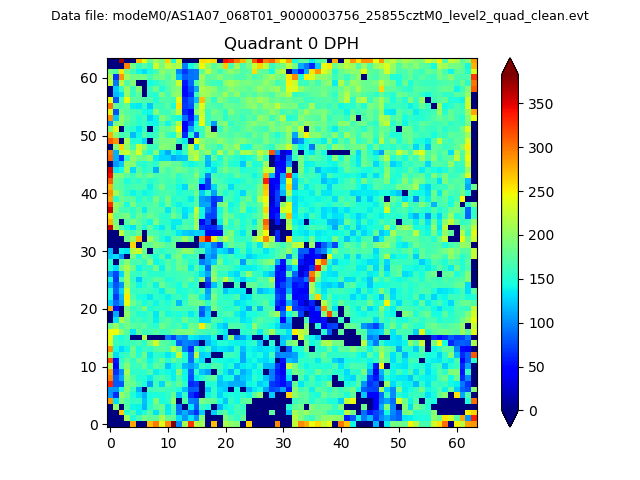 |
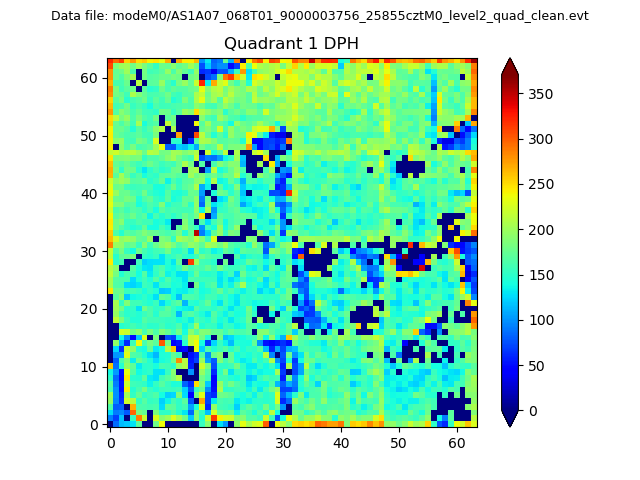 |
Quadrant B |
|---|---|---|---|
| Quadrant D |  |
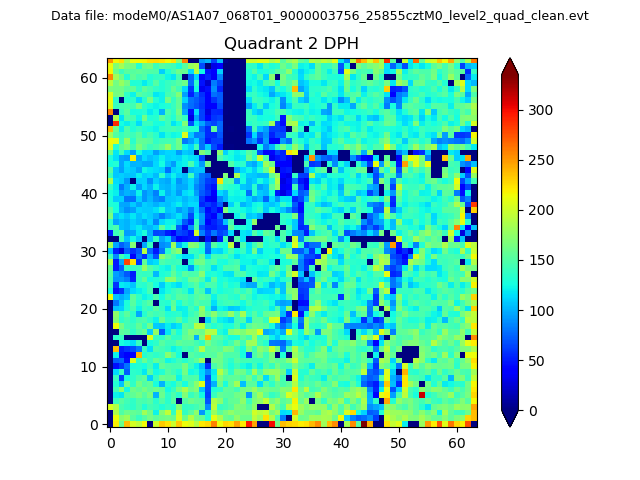 |
Quadrant C |
| Plot type | Count rate plots | Images |
|---|---|---|
| Comparison with Poisson distribution Blue bars denote a histogram of data divided into 1 sec bins. Red curve is a Poisson curve with rate = median count rate of data. |
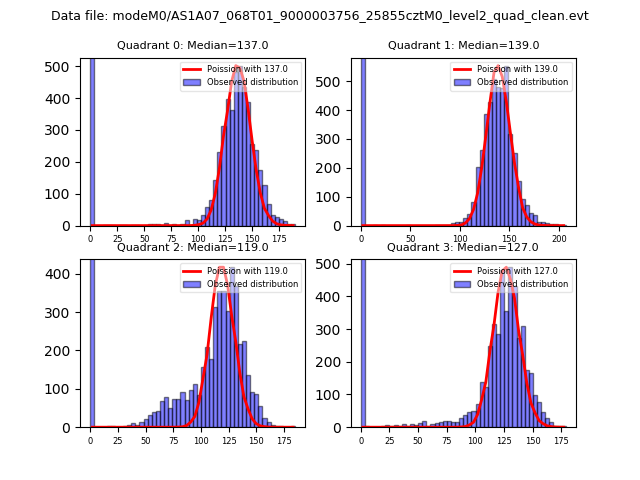 |
 |
| Quadrant-wise count rates Data is divided into 100 sec bins |
 |
|
| Module-wise count rates for Quadrant A Data is divided into 100 sec bins |
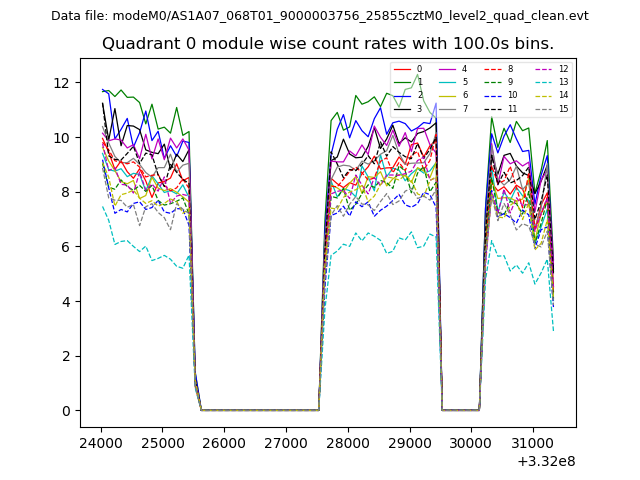 |
 |
| Module-wise count rates for Quadrant B Data is divided into 100 sec bins |
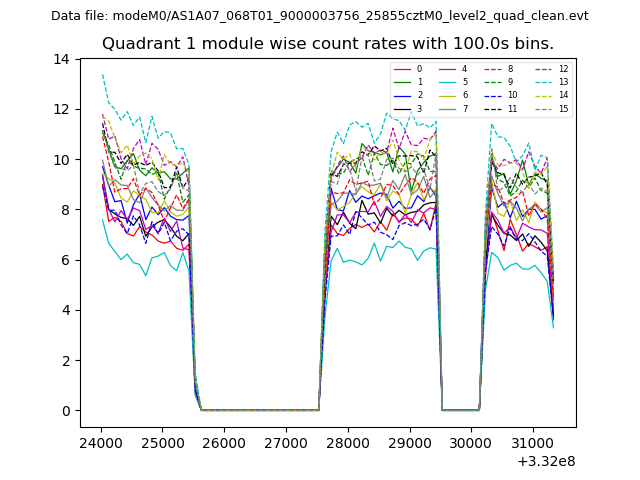 |
 |
| Module-wise count rates for Quadrant C Data is divided into 100 sec bins |
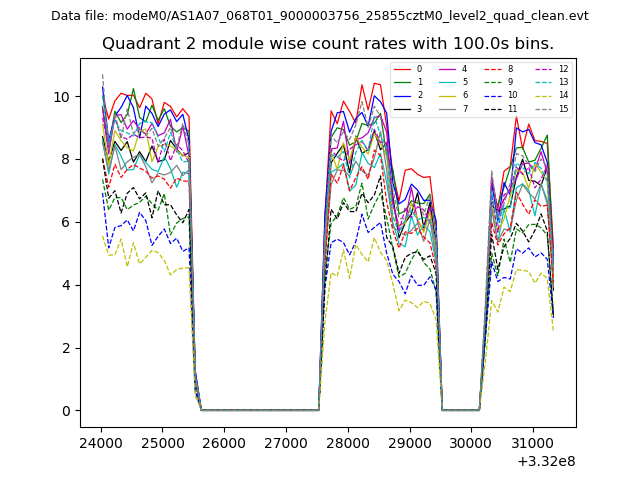 |
 |
| Module-wise count rates for Quadrant D Data is divided into 100 sec bins |
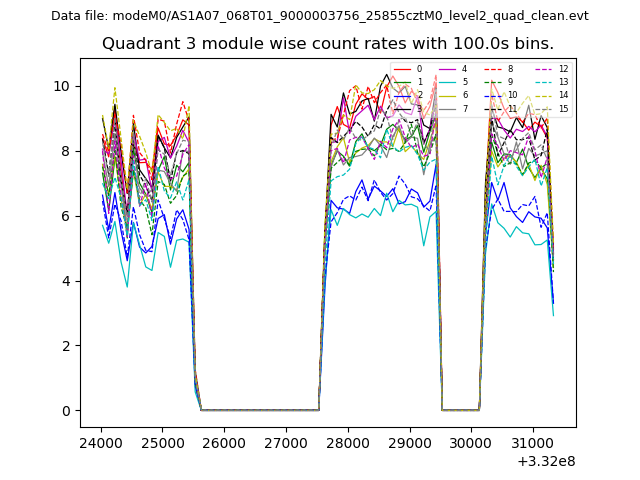 |
 |
| Parameter | Plot |
|---|---|
| CZT HV Monitor | 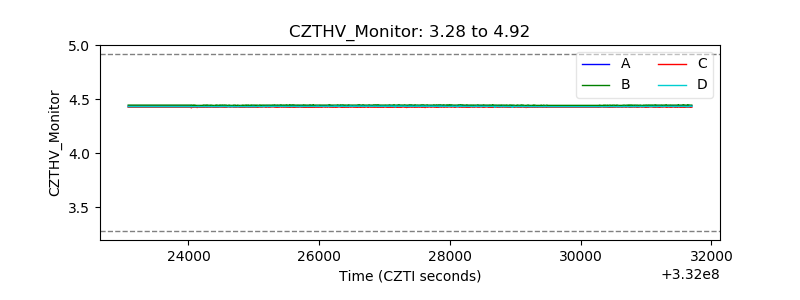 |
| D_VDD | 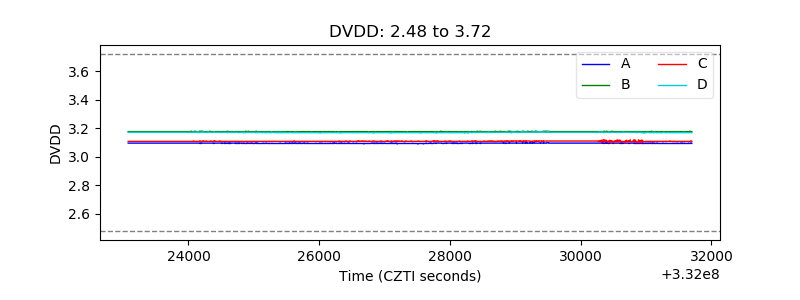 |
| Temperature 1 | 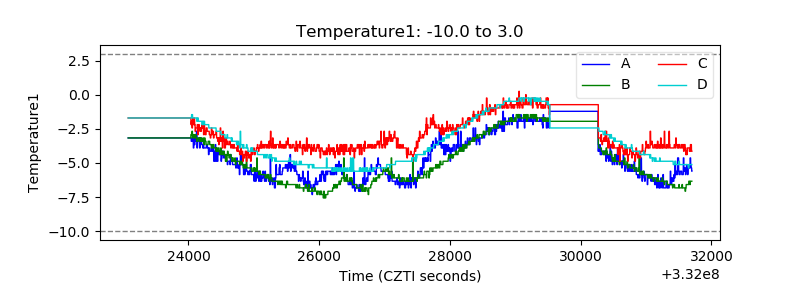 |
| Veto HV Monitor |  |
| Veto LLD | 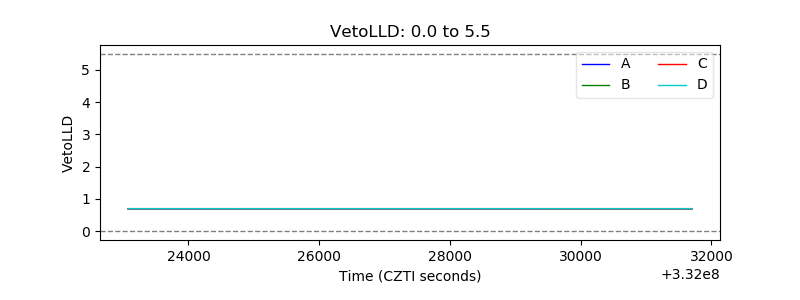 |
| Alpha Counter | 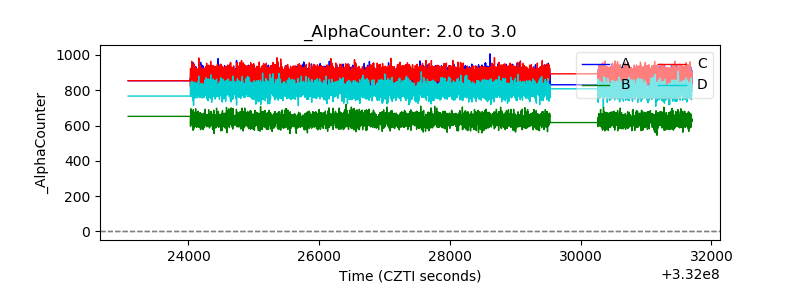 |
| _CPM_Rate |  |
| CZT Counter | 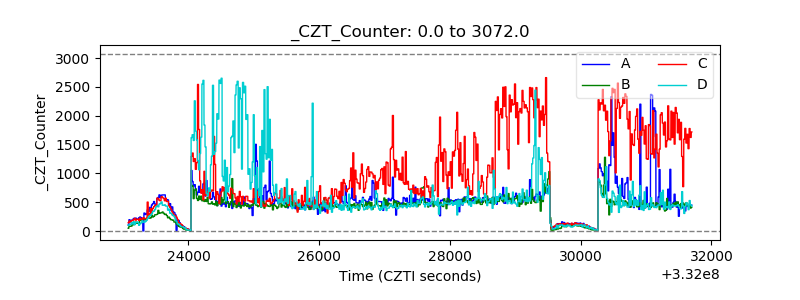 |
| +2.5 Volts monitor | 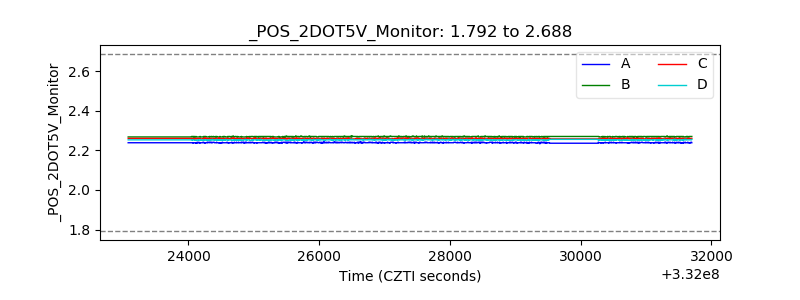 |
| +5 Volts monitor |  |
| _ROLL_ROT | 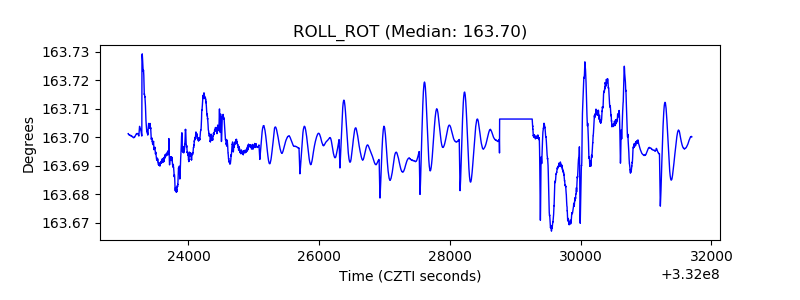 |
| _Roll_DEC | 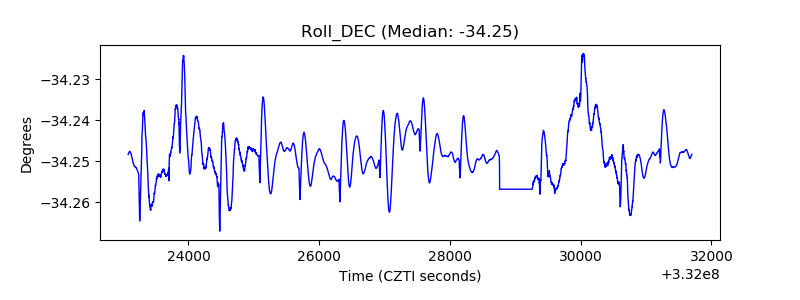 |
| _Roll_RA | 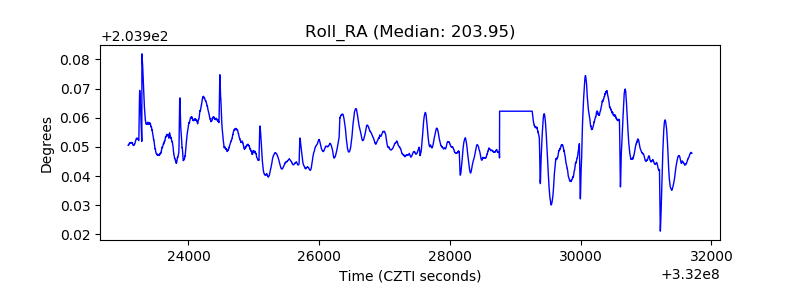 |
| Veto Counter | 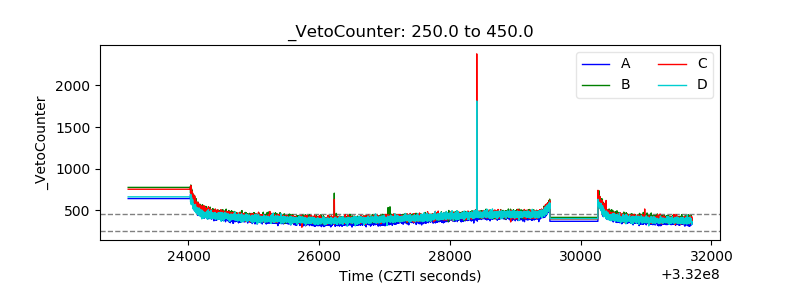 |