| Param | Original file | Final file |
|---|---|---|
| Filename | modeM0/AS1A07_068T01_9000003756_25856cztM0_level2.evt | modeM0/AS1A07_068T01_9000003756_25856cztM0_level2_quad_clean.evt |
| Size (bytes) | 928,923,840 | 94,080,960 |
| Size | 885.9 MB | 89.7 MB |
| Events in quadrant A | 6,061,099 | 595,952 |
| Events in quadrant B | 3,667,229 | 640,349 |
| Events in quadrant C | 13,795,726 | 482,438 |
| Events in quadrant D | 4,100,220 | 604,567 |
| Mode M0 | |||
|---|---|---|---|
| Quadrant | BADHDUFLAG | Total packets | Discarded packets |
| A | 0 | 23278 | 0 |
| B | 0 | 15684 | 0 |
| C | 0 | 46198 | 0 |
| D | 0 | 17398 | 0 |
| Mode M9 | |||
|---|---|---|---|
| Quadrant | BADHDUFLAG | Total packets | Discarded packets |
| A | 0 | 11 | 0 |
| B | 0 | 11 | 0 |
| C | 0 | 11 | 0 |
| D | 0 | 11 | 0 |
| Quadrant | Total seconds | Saturated seconds | Saturation percentage |
|---|---|---|---|
| A | 7532 | 678 | 9.001593% |
| B | 7531 | 105 | 1.394237% |
| C | 7531 | 3744 | 49.714513% |
| D | 7531 | 96 | 1.274731% |
Noise dominated data is calculated using 1-second bins in cleaned event files. If a bin has >2000 counts, and if more than 50% of those come from <1% of pixels, then it is considered to be noise-dominated and hence unusable.
| Quadrant | # 1 sec bins | Bins with >0 counts | Bins with >2000 counts | High rate bins dominated by noise | Noise dominated (total time) | Noise dominated (detector-on time) | Marked lightcurve |
|---|---|---|---|---|---|---|---|
| A | 8677 | 7534 | 460 | 460 | 5.30% | 6.11% | 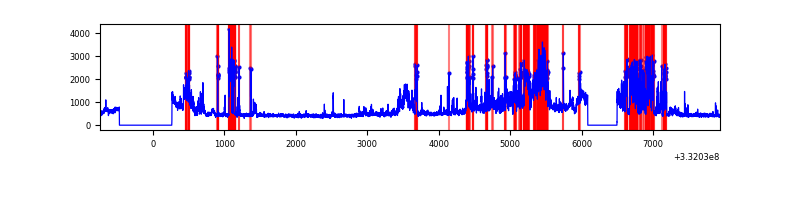 |
| B | 8676 | 7533 | 0 | 0 | 0.00% | 0.00% | 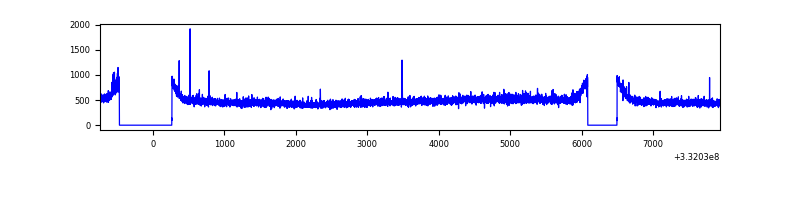 |
| C | 8676 | 7533 | 2860 | 2860 | 32.96% | 37.97% | 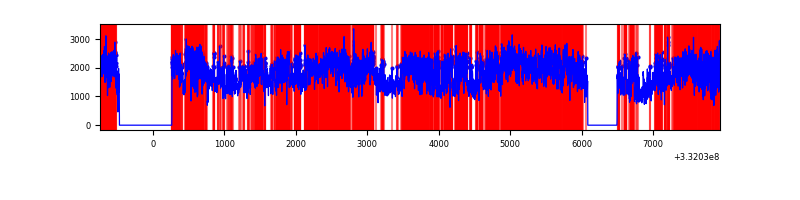 |
| D | 8676 | 7533 | 54 | 54 | 0.62% | 0.72% | 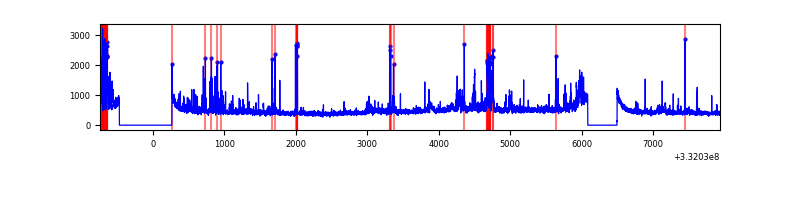 |
Top three noisy pixels from each quadrant. If the there are fewer than three noisy pixels in the level2.evt file, extra rows are filled as -1
| Pixel properties | Quadrant properties | ||||||
|---|---|---|---|---|---|---|---|
| Quadrant | DetID | PixID | Counts | Sigma | Mean | Median | Sigma |
| A | 0 | 13 | 2570601 | 14115.54 | 903 | 882 | 182.0 |
| A | 13 | 254 | 10676 | 53.8 | 903 | 882 | 182.0 |
| A | 3 | 137 | 8620 | 42.51 | 903 | 882 | 182.0 |
| B | 15 | 33 | 24764 | 133.61 | 919 | 894 | 178.7 |
| B | 12 | 111 | 22216 | 119.35 | 919 | 894 | 178.7 |
| B | 11 | 111 | 19891 | 106.33 | 919 | 894 | 178.7 |
| C | 7 | 87 | 10635535 | 58907.0 | 767 | 770 | 180.5 |
| C | 14 | 238 | 119491 | 657.61 | 767 | 770 | 180.5 |
| C | 7 | 226 | 24688 | 132.48 | 767 | 770 | 180.5 |
| D | 1 | 52 | 426698 | 2003.24 | 886 | 862 | 212.6 |
| D | 12 | 233 | 191174 | 895.27 | 886 | 862 | 212.6 |
| D | 7 | 80 | 88564 | 412.57 | 886 | 862 | 212.6 |
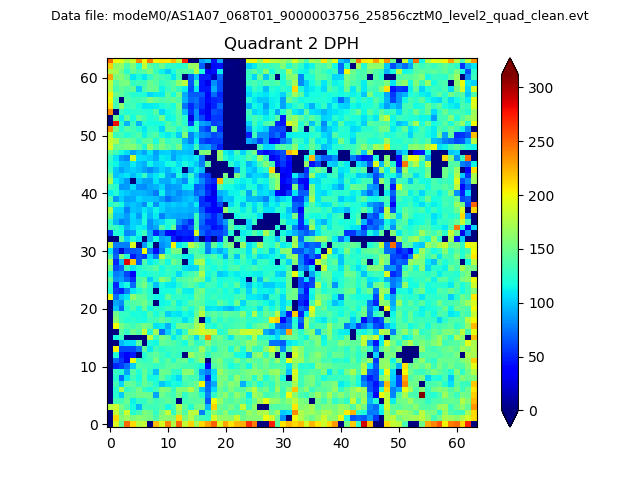
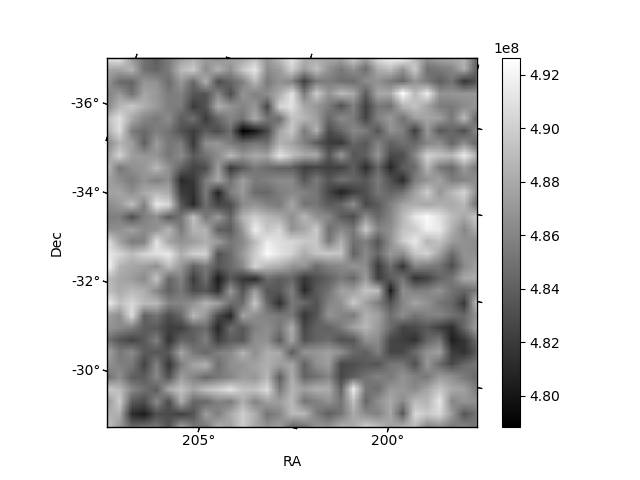
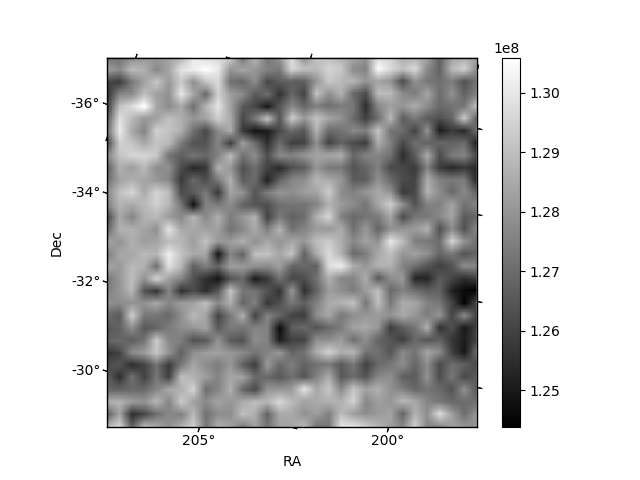
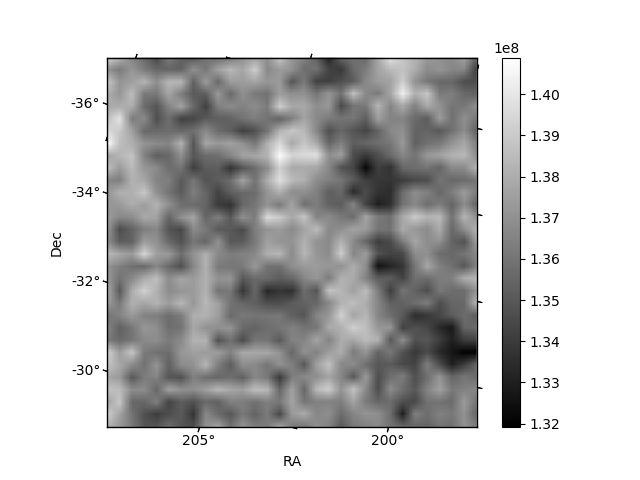
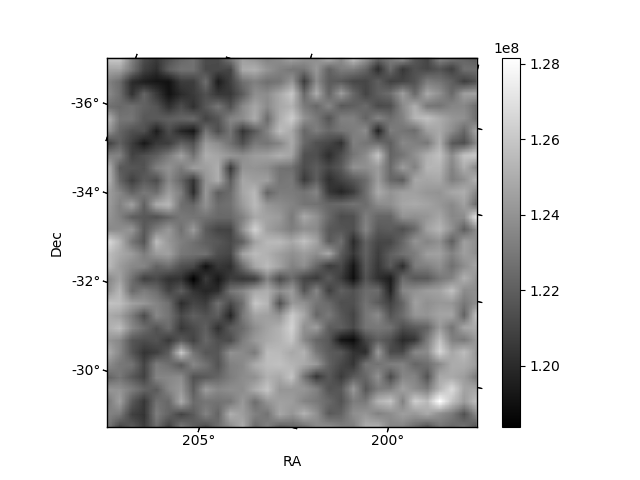
Histogram calculated using DETX and DETY for each event in the final _common_clean file
| Quadrant A | 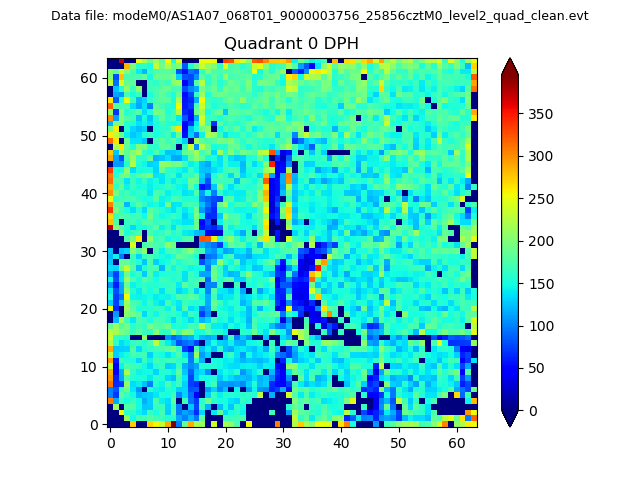 |
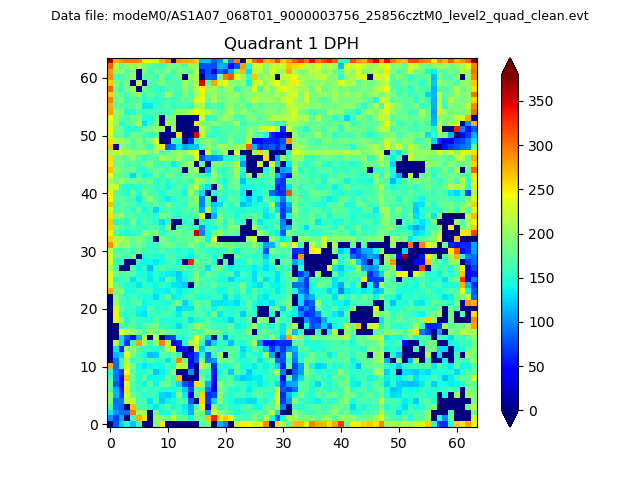 |
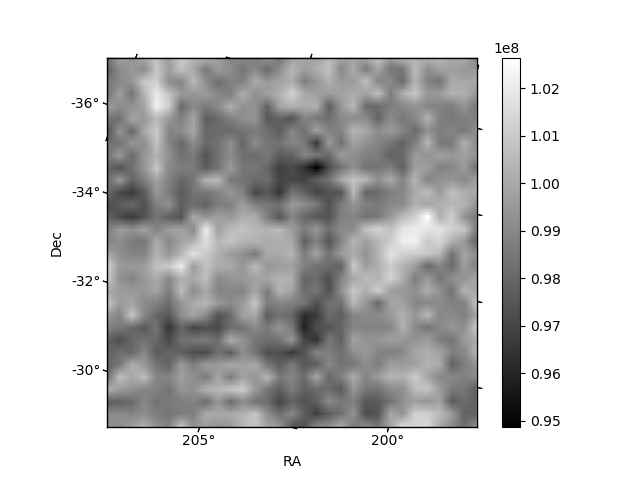
Quadrant B |
|---|---|---|---|
| Quadrant D | 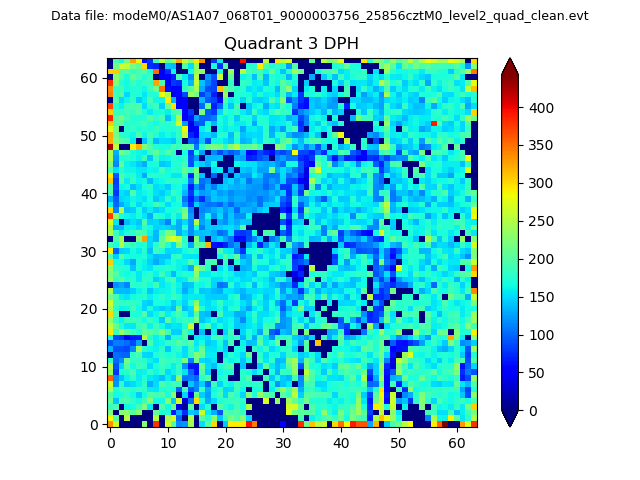 |
 |
Quadrant C |
| Plot type | Count rate plots | Images |
|---|---|---|
| Comparison with Poisson distribution Blue bars denote a histogram of data divided into 1 sec bins. Red curve is a Poisson curve with rate = median count rate of data. |
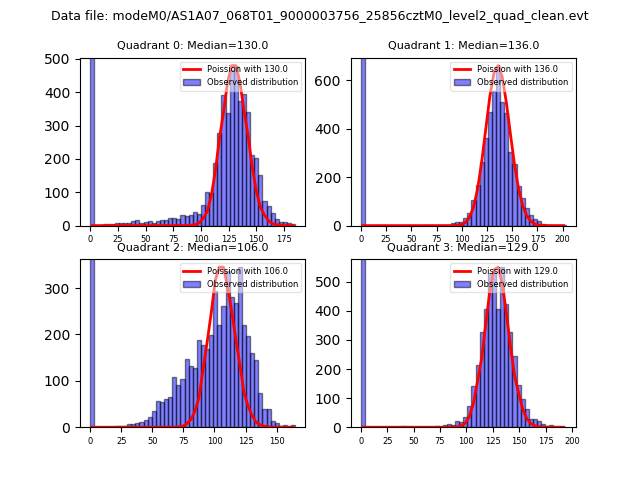 |
 |
| Quadrant-wise count rates Data is divided into 100 sec bins |
 |
|
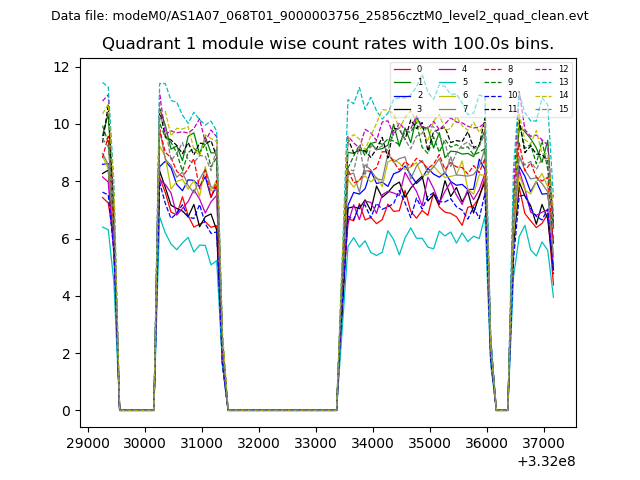
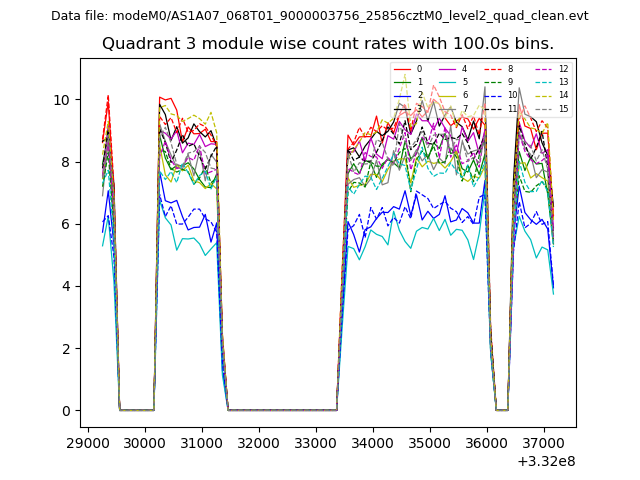
| Module-wise count rates for Quadrant A Data is divided into 100 sec bins |
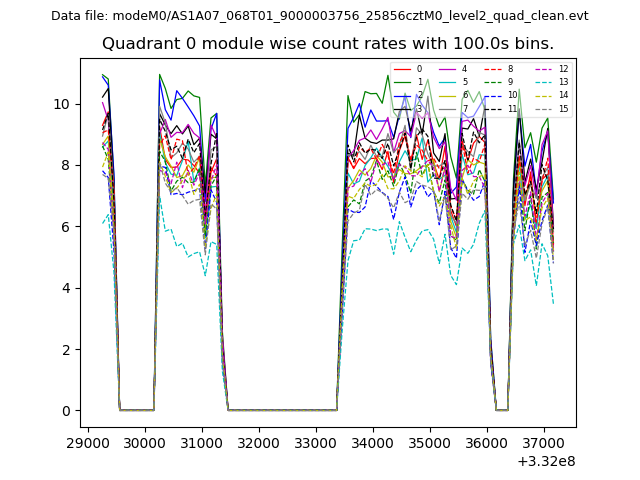 |
 |
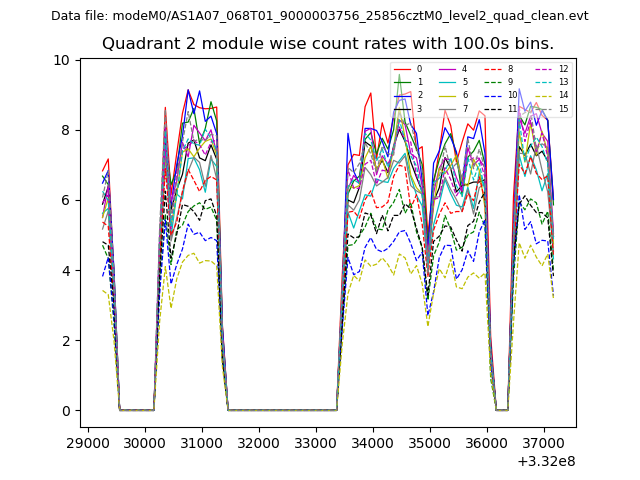
| Module-wise count rates for Quadrant B Data is divided into 100 sec bins |
 |
 |
| Module-wise count rates for Quadrant C Data is divided into 100 sec bins |
 |
 |
| Module-wise count rates for Quadrant D Data is divided into 100 sec bins |
 |
 |
| Parameter | Plot |
|---|---|
| CZT HV Monitor | 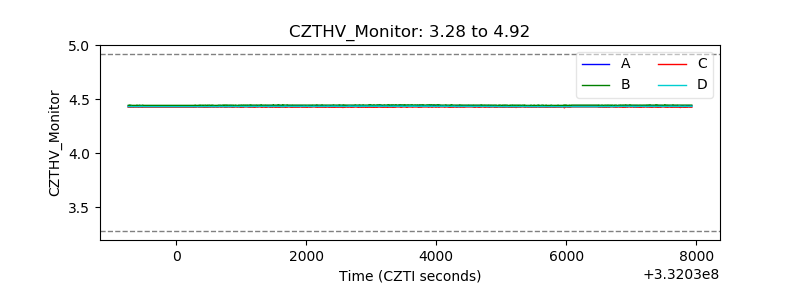 |
| D_VDD | 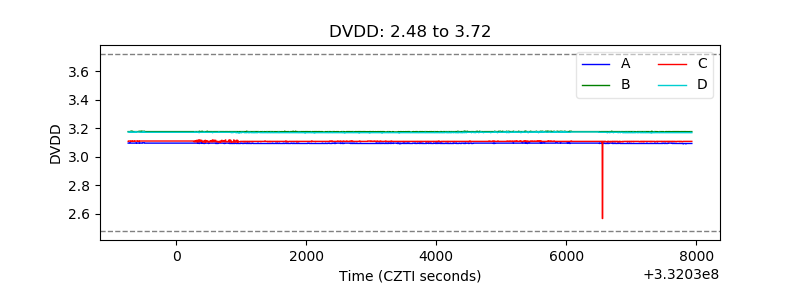 |
| Temperature 1 | 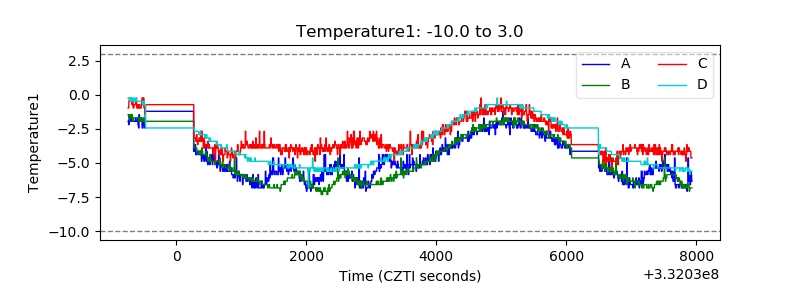 |
| Veto HV Monitor | 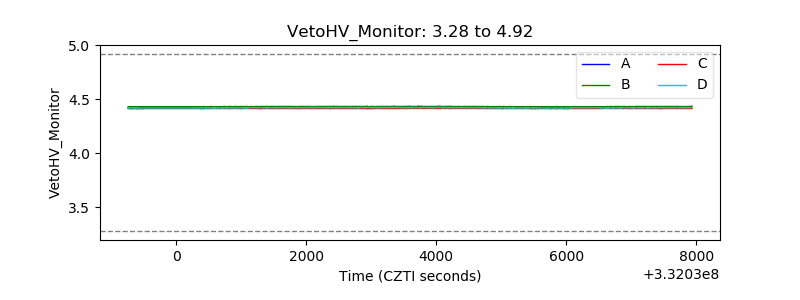 |
| Veto LLD | 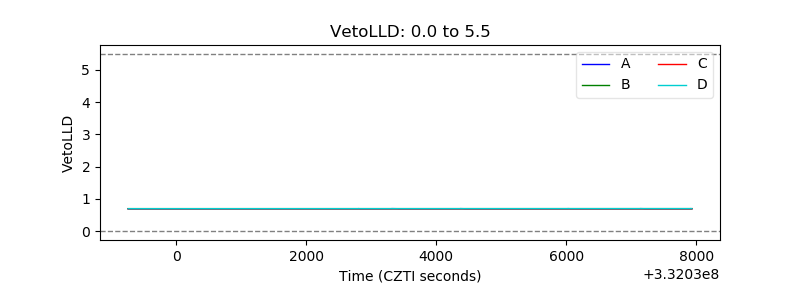 |
| Alpha Counter | 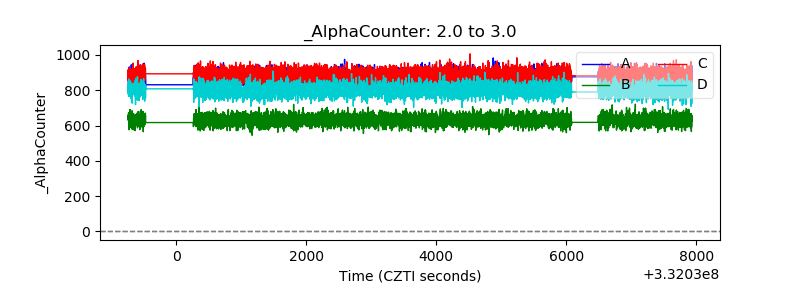 |
| _CPM_Rate |  |
| CZT Counter | 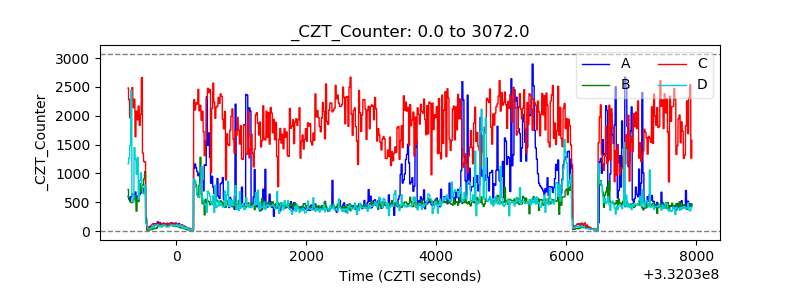 |
| +2.5 Volts monitor | 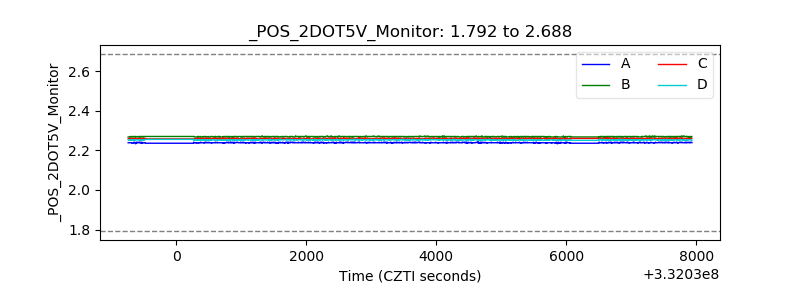 |
| +5 Volts monitor |  |
| _ROLL_ROT | 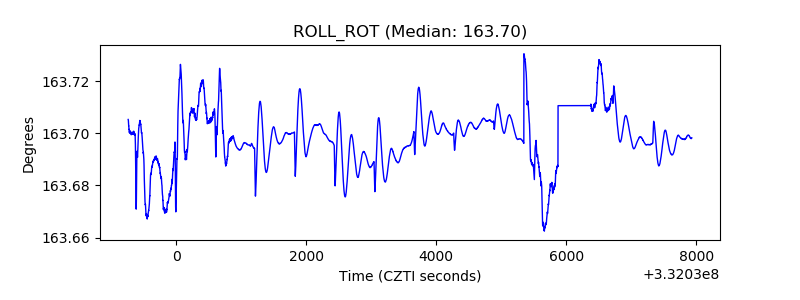 |
| _Roll_DEC | 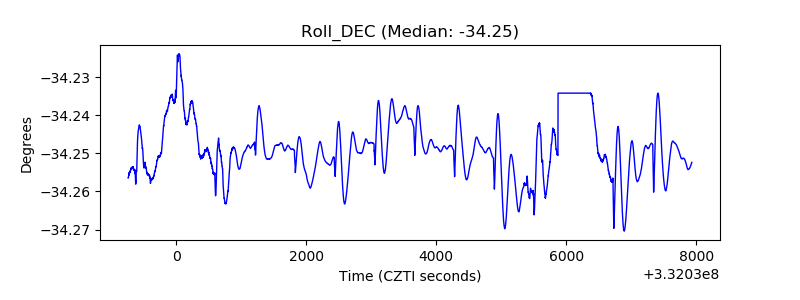 |
| _Roll_RA | 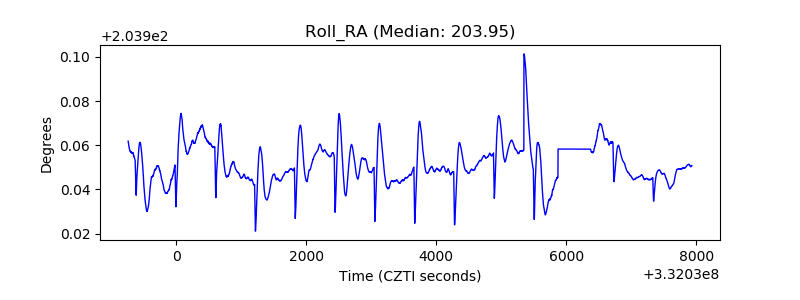 |
| Veto Counter | 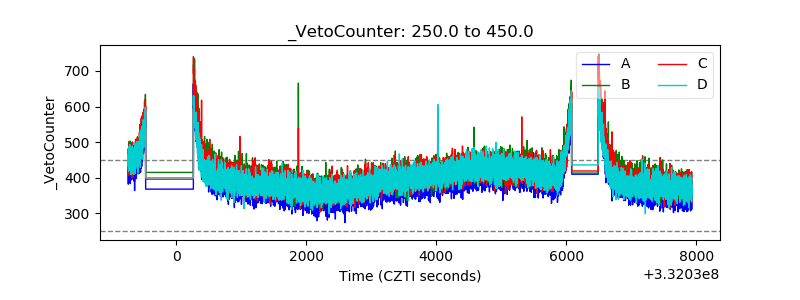 |